Abstract
We investigated 1) the ability of purified glargine (GLA), metabolites 1 (M1) and 2 (M2), IGF-I, and NPH insulin to activate the insulin receptor (IR)-A and IR-B and IGF-I receptor (IGF-IR) in vitro; 2) plasma concentrations of GLA, M1, and M2 during long-term insulin therapy in type 2 diabetic patients; and 3) IR-A and IR-B activation in vitro induced by serum from patients treated with GLA or NPH insulin. A total of 104 patients (age 56.3 ± 0.8 years, BMI 31.4 ± 0.5 kg/m2, and A1C 9.1 ± 0.1% [mean ± SE]) were randomized to GLA or NPH insulin therapy for 36 weeks. Plasma concentrations of GLA, M1, and M2 were determined by liquid chromatography–tandem mass spectrometry assay. IR-A, IR-B, and IGF-IR autophosphorylation was induced by purified hormones or serum by kinase receptor activation assays. In vitro, M1 induced comparable IR-A, IR-B, and IGF-IR autophosphorylation (activation) as NPH insulin. After 36 weeks, M1 increased from undetectable (<0.2 ng/mL) to 1.5 ng/mL (0.9–2.1), while GLA and M2 remained undetectable. GLA dose correlated with M1 (r = 0.84; P < 0.001). Serum from patients treated with GLA or NPH insulin induced similar IR-A and IR-B activation. These data suggest that M1 rather than GLA mediates GLA effects and that compared with NPH insulin, GLA does not increase IGF-IR signaling during long-term insulin therapy in type 2 diabetes.
Besides its typical metabolic effects, insulin also has growth effects. In 2009, four observational studies were published, of which three suggested that use of insulin glargine (GLA) was associated with an increased risk of cancer (1–4). Since it was shown that GLA had an increased affinity for the IGF-I receptor (IGF-IR) (5,6), mitogenic effects of GLA were believed to occur through increased stimulation of the IGF-IR. However, we recently observed that serum from type 2 diabetic patients, who were treated for 36 weeks with metformin and GLA, induced similar IGF-IR activation compared with that of patients treated with metformin and NPH insulin (7).
After subcutaneous injection, GLA is metabolized into two metabolites, M1 and M2 (8–10). GLA undergoes sequential cleavage of the COOH terminus of the B-chain, forming metabolites M1 and M2 that lack the di-arginine (M1 after removal of the two arginines, M2 with additional deamination of threonine at position B30). M1 and M2 have the same metabolic properties as human insulin and do not differ from human insulin in affinity for the IGF-IR (5). Our previous observation of a lack of increase in IGF-IR activation by serum (7) could have been the result of GLA not reaching in vivo concentrations needed to stimulate the IGF-IR (11). However, it may also be the result of metabolism of GLA to M1 or M2 before it enters the circulation. Pharmacodynamic studies have shown that in type 1 diabetes mellitus, after a subcutaneous injection, GLA is rapidly and dose-independently metabolized almost completely into M1 (10). Moreover, in type 2 diabetic patients, after a subcutaneous injection of a therapeutic dose, GLA was minimally detectable in blood, and M2 was undetectable in blood, whereas M1 accounted for most (≈90%) of the plasma insulin concentration up to 31 h (8). Yet, whether GLA accumulates during long-term GLA therapy is still unknown.
Mitogenic effects of insulin may also occur via increased stimulation of the insulin receptor (IR) (12). IRs are usually expressed at high levels in cancer cells (13,14). Moreover, cells can express two IR isoforms (IR-A and IR-B), generated by alternative splicing of the IR gene (15). The two IR isoforms have slightly different biological properties (15). IR-B is the classical form of the IR, which is primarily expressed in liver, muscle, and adipose tissues and predominantly mediates metabolic effects (15–18). IR-A is expressed ubiquitously but is predominantly expressed in central nervous system, hematopoietic cells, and cancer tissues and has predominantly mitogenic effects (15–18).
The aims of the current study were to measure 1) the ability of purified GLA, M1, M2, IGF-I, and NPH insulin to activate IR-A, IR-B, and IGF-IR in vitro; 2) plasma concentrations of GLA and M1 and M2 during long-term insulin therapy in type 2 diabetic patients; and 3) IR-A and IR-B activation in vitro induced by serum from patients treated with GLA or NPH insulin.
RESEARCH DESIGN AND METHODS
In vitro effects of GLA, M1, M2, NPH insulin, and IGF-I on IR-A, IR-B, and IGF-IR autophosphorylation (activation).
Equimolar concentrations of GLA (Lantus; Sanofi, Frankfurt am Main, Germany), M1 (provided by Sanofi), M2 (provided by Sanofi), NPH insulin (Insulatard; Novo Nordisk, Bagsvaerd, Denmark), and IGF-I (Austral Biologicals, San Ramon, CA) were tested in a range of 0.1–100 nmol/L. IR-A, IR-B, and IGF-IR activation was measured by kinase receptor activation (KIRA) assays as detailed below.
Concentrations of metabolites in serum and effects of serum on IR-A and IR-B activation in vitro.
Serum samples from type 2 diabetic patients treated with GLA were used to measure concentrations of GLA, M1, and M2 by liquid chromatography–tandem mass spectrometry assay (LCMS) (see Research Design and Methods) (vide infra) at baseline and after 36 weeks of GLA treatment. Serum-induced IR-A and IR-B activation was measured by KIRA assays as detailed below (Research Design and Methods section) before and after 36 weeks of insulin treatment in the same type 2 diabetic patients and in type 2 diabetic patients treated with NPH insulin for 36 weeks. Serum samples tested were samples obtained from the previously reported LANMET study (19) in which extra serum samples had been collected as part of the original protocol (104 of 110 LANMET participants). The LANMET study was a multicentre, open, randomized, parallel-group study. Briefly, in the LANMET study, the efficacy and safety of bedtime GLA and metformin was compared with NPH insulin and metformin treatment in insulin-naive, poorly controlled type 2 diabetic patients (HbA1c ≥8.0%). The study consisted of a 4-week run-in phase and a 36-week treatment phase. It was performed at six sites in Finland and one in the U.K. The study was performed in accordance with the Declaration of Helsinki and good clinical practice as described by Note for Guidance CPMP/ICH/135/95. Approval by institutional ethics committees, including permission to obtain extra serum samples at 0 and 36 weeks, was obtained for each participating site. All patients provided written informed consent before entry into the study.
IR-A, IR-B, and IGF-IR KIRA assays using pure hormone, metabolites, or serum.
The IR-A, IR-B, and IGF-IR KIRA assays have been previously described (20,21). All three assays use human embryonic kidney cells stably transfected with either cDNA of the human IR-A or human IR-B gene (HEK IR-A or IR-B) or with cDNA of the human IGF-IR gene (HEK IGF-IR). The principle of all three KIRA bioassays is based on quantification of tyrosine residue phosphorylation of the IR or IGF-IR. For the in vitro experiments, after 48 h of culture, cells were stimulated for 10 (for IR KIRA assays) or 15 min (for the IGF-IR KIRA assay) at 37°C. Cells were stimulated with equimolar concentrations of GLA, M1, M2, NPH insulin, or human recombinant IGF-I diluted in 0.5% human serum albumin (Octalbine; Octopharma, Lachen, Switzerland).
For serum experiments, after 48 h of culture, cells were stimulated for 10 min (for IR KIRA assays) at 37°C. Cells were stimulated with in serum or increasing amounts of human recombinant insulin (Actrapid; Novo Nordisk) in a range of 0.06–1.0 nmol/L. In addition, two control serum samples were tested on every plate to ensure optimal performance. Standards and serum samples were diluted in Krebs-Ringer bicarbonate buffer adjusted to pH 7.4 by CO2 and supplemented human serum albumin diluted to 0.5 and 0.1%, respectively. Serum samples were diluted 1:10.
After stimulation, cells were lysed. Crude lysates were transferred to a sandwich assay. In the IR KIRA assays, wells were coated with a monoclonal antibody directed against the IR (Novozymes-Gropep, Adelaide, Australia) that was used as capture antibody in a concentration of 2.5 µg/mL. In the IGF-IR KIRA assay, wells were coated with a monoclonal capture antibody directed against the IGF-IR in a concentration of 5.0 μg/mL. A biotinylated antiphosphotyrosine monoclonal antibody (BAM 1676; R&D Systems Europe Ltd, Abingdon, U.K.) was used in a concentration of 0.2 µg/mL together with streptavidin-labeled europium (DELFIA Eu-N1; PerkinElmer Life Sciences, Groningen, the Netherlands) in a concentration of 50 pmol/L as detection antibody. Contents were read in a time-resolved fluorometer (Victor2 multilabel counter; PerkinElmer Life Sciences). Assays were performed in 48-well plates (Corning, Corning, NY). All measurements were done in duplicate. The inter- and intra-assay CVs were <15%.
GLA, M1, and M2 metabolite assays.
Plasma GLA, M1, and M2 concentrations were determined in citrate plasma samples taken after an overnight fast after 36 weeks of insulin treatment as follows: GLA, M1, and M2 were extracted in plasma samples by immunoaffinity columns and quantified by a specific LCMS, without cross-reactivity to endogenous human or other insulins. The limit of quantitation was ≈33 pmol/L (0.2 ng/mL) (10).
Statistical analysis.
Baseline characteristics are shown as means (or geometric means) ± SE. The Kolmogorov-Smirnov test was used to test normality of variables (data were considered to be normally distributed when P > 0.05). For data that did not meet the criteria for normality, logarithmic transformations were applied and are presented as geometric means with 95% CI or/ if logarithmic transformation did not normalize data, as medians with interquartile range. Spearman correlation coefficients were calculated to assess the associations between variables. Differences in continuous variables were calculated by an unpaired t test or Mann-Whitney test. Differences in categorical variables were tested by using the χ2 test. A P value ≤0.05 was considered statistically significant. Data were analyzed using SPSS 17 for Windows (SPSS Inc., Chicago, IL).
RESULTS
Effects of purified GLA, M1, M2, and NPH insulin on IGF-IR, IR-A, and IR-B activation in vitro
IGF-IR activation.
As depicted in Fig. 1A, at 10–100 nmol/L GLA was significantly more potent than NPH insulin or M1 and M2 to activate the IGF-IR. IGF-I was the most potent activator of IGF-IR (Fig. 1A). M1 and M2 and NPH insulin activated the IGF-IR in a comparable manner (Fig. 1A).
FIG. 1.
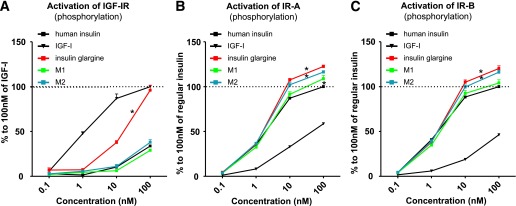
Activation of the IGF-IR (A), IR-A (B), and IR-B (C) in vitro: comparing equimolar concentrations of NPH insulin, human IGF-I, insulin GLA, and M1 and M2. Dose-response profiles ranged from 0.1 to 100 nmol/L. Points represent the mean value (+ SEM) of three independent experiments. *P < 0.05 compared with NPH insulin.
IR-A activation.
At 10–100 nmol/L, GLA and M2 were more potent than NPH insulin in activating the IR-A (P < 0.001) (Fig. 1B). M1 activates IR-A similarly to NPH insulin at concentrations up to 100 nmol/L (Fig. 1B) and was only slightly more potent than NPH insulin at 100 nmol/L (P = 0.04) (Fig. 1B).
IR-B activation.
At 10–100 nmol/L, GLA and M2 were more potent than NPH insulin in activating the IR-B (P < 0.001) (Fig. 1C). M1 was as potent as NPH insulin over the entire range tested (Fig. 1C).
Table 1 shows the half-maximal effective concentration (EC50) values of IGF-I, NPH insulin, GLA, M1, and M2 for IGF-IR, IR-A, and IR-B, respectively. For the IGF-IR, the EC50 of GLA was substantially lower than NPH insulin, while EC50 values for M1 and M2 were higher compared with NPH insulin. For IR-A and IR-B, the EC50 values were similar for NPH insulin, GLA, M1, and M2.
TABLE 1.
EC50 values of IGF-I, NPH insulin, insulin GLA, M1, and M2 for human IR-A, human IR-B, and human IGF-IR

Plasma concentrations of GLA and its metabolites after 36 weeks of therapy.
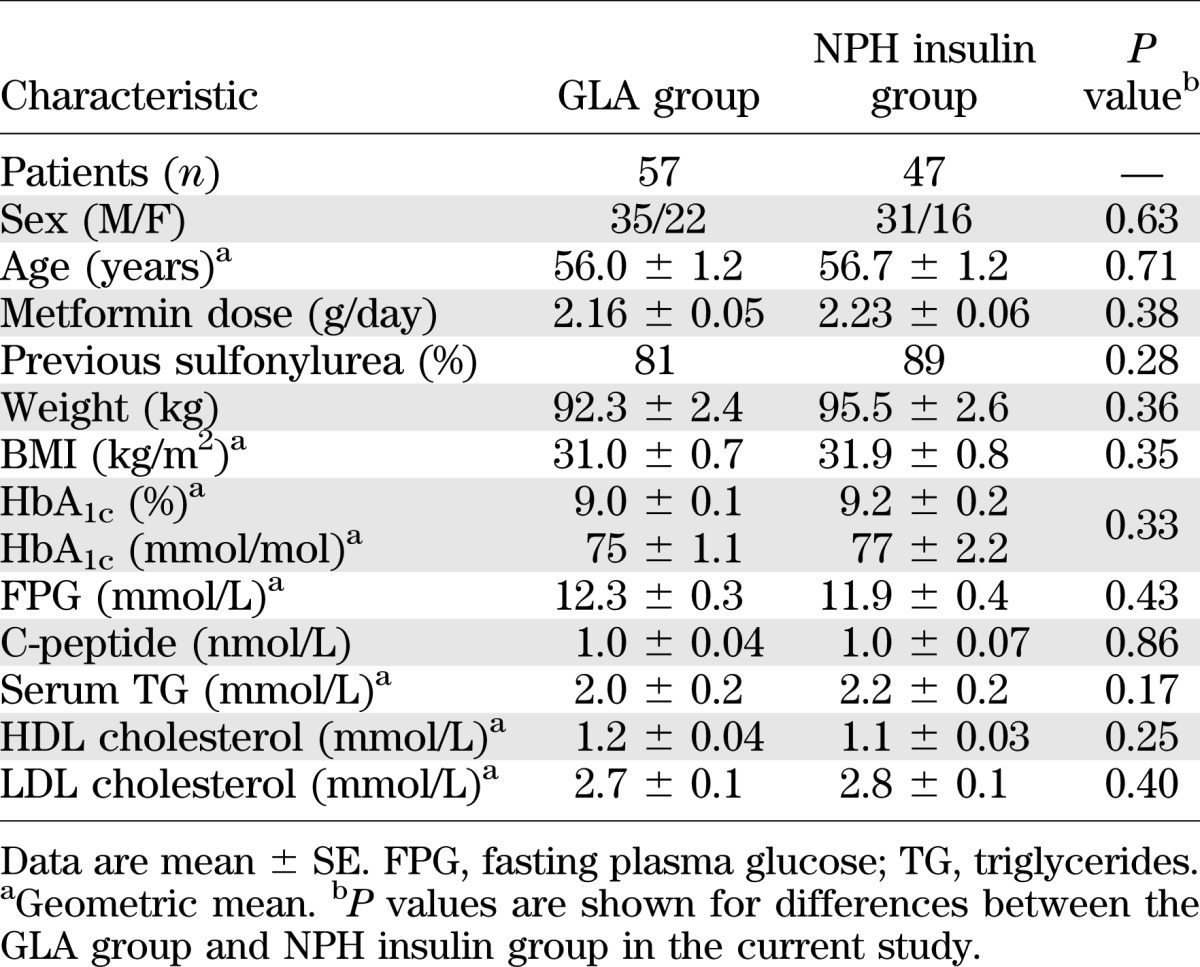
As reported previously (7,19), baseline characteristics were comparable (Table 2). At 36 weeks, the mean doses of GLA and NPH insulin to achieve HbA1c of 7.0 ± 0.1 and 7.1 ± 0.1% (P = 0.93) were 68 ± 6 and 71 ± 6 IU/day (P = 0.68). The insulin doses were also comparable (GLA, 0.69 ± 0.05 vs. NPH, 0.69 ± 0.05 IU/kg; P = 0.98).
TABLE 2.
Baseline characteristics of diabetic patients randomized to the GLA therapy or NPH insulin therapy
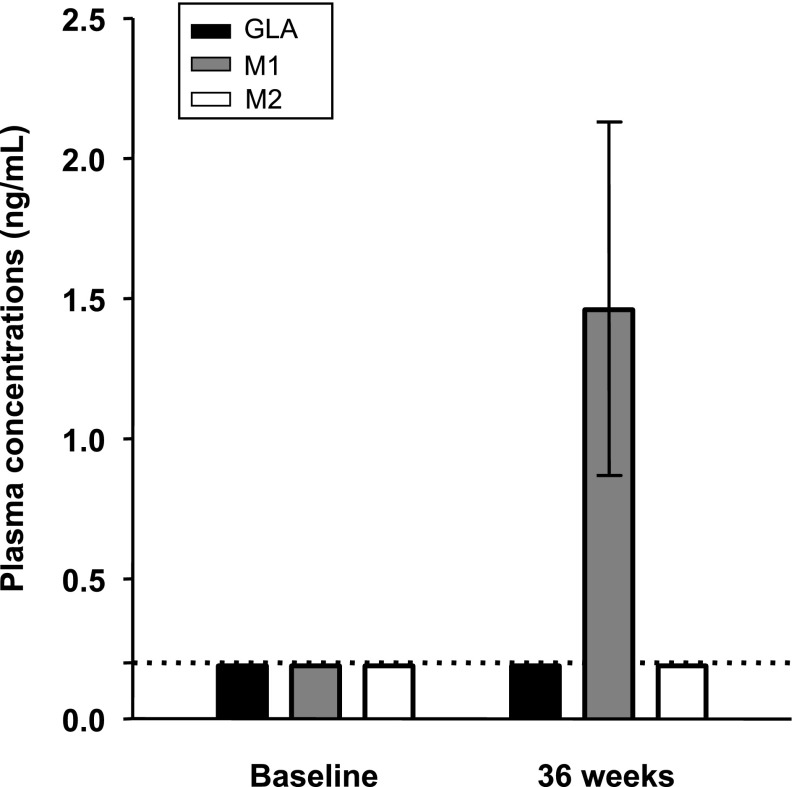
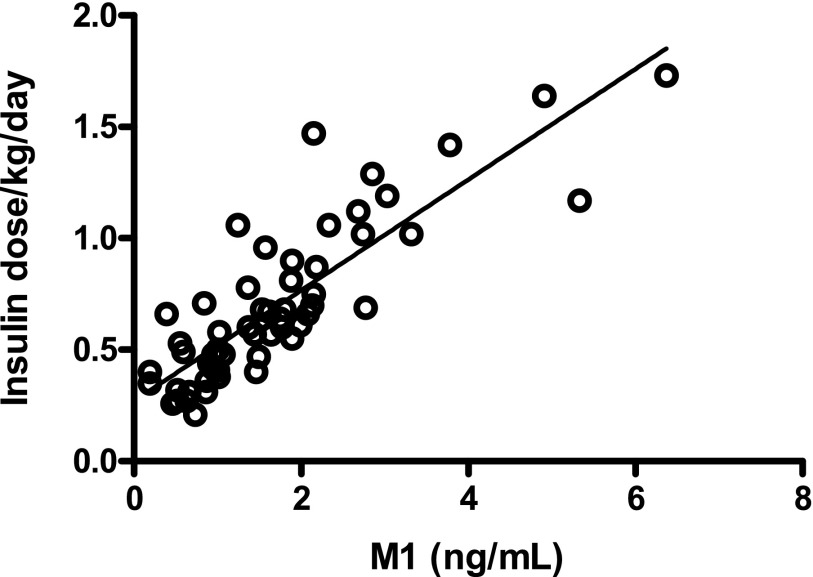
At 36 weeks of GLA treatment, plasma M1 concentrations increased from undetectable (<0.2 ng/mL) to 1.5 ng/mL (0.9–2.1) (median [interquartile range]), whereas GLA and M2 concentrations remained undetectable (<0.2 ng/mL) (Fig. 2). The dose of insulin GLA (IU/kg) correlated with M1 (r = 0.84; P < 0.001) (Fig. 3).
FIG. 2.
Plasma concentrations of insulin GLA and its metabolites M1 and M2 at baseline and at 36 weeks of insulin GLA therapy determined by LCMS. Results are shown as median with interquartile ranges. The broken line shows the detection limit for all three substances (0.20 ng/mL).
FIG. 3.
Correlation between insulin GLA dose per kilogram per day at 36 weeks of insulin therapy and concentrations of its metabolite M1.
IR-A and IR-B activation in vitro, induced by serum from patients in the GLA- versus NPH insulin–treated groups.
At baseline, serum-induced IR-A and IR-B activation did not differ between the two treatment groups (IR-A: GLA vs. NPH insulin, 76 [63–91] (median [interquartile range]) vs. 72 pmol/L [52–83]; P = 0.09; IR-B: 134 [106–166] vs. 123 pmol/L [102–159]; P = 0.33).
At 36 weeks of insulin therapy, serum-induced IR-A and IR-B activation did not differ between the two treatment groups (IR-A: GLA vs. NPH insulin, 72 [54–82] vs. 71 pmol/L [57–92]; P = 0.96; IR-B: GLA vs. NPH insulin, 116 [93–148] vs. 121 pmol/L [102–133]; P = 0.65).
At 36 weeks, the insulin dose (IU/kg) was positively correlated with serum-induced IR-A (r = 0.28; P = 0.004) but not to IR-B activation (r = 0.16; P = 0.12). In the NPH insulin–treated group, the insulin dose (IU/kg) was positively correlated with serum-induced IR-A (r = 0.39; P = 0.008) but not to IR-B activation (r = 0.24; P = 0.11) (Fig. 4A). In subjects treated with GLA, the insulin dose did not correlate to serum-induced IR-A (r = 0.17; P = 0.22) or IR-B activation (r = 0.08; P = 0.55). However, M1 correlated with serum-induced IR-A (r = 0.33; P = 0.01) but not IR-B (r = 0.17; P = 0.20) activation (Fig. 4B).
FIG. 4.
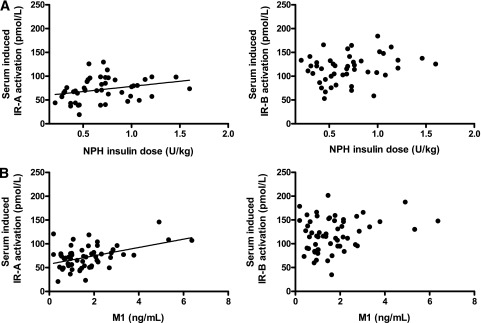
A: Correlation between NPH insulin dose per kilogram per day and serum-induced IR-A and IR-B activation at 36 weeks of insulin therapy. NPH dose per kilogram per day was positively related to IR-A activation. B: Correlation between concentrations of metabolite M1 and serum-induced IR-A and IR-B activation at 36 weeks of GLA therapy. M1 concentrations were positively correlated to IR-A activation.
DISCUSSION
The most important finding of this study was that there was no detectable GLA in the circulation of type 2 diabetic patients treated with high doses of GLA for 36 weeks. Of the metabolites of GLA, only M1 could be detected in the circulation of patients treated with GLA. Circulating M1 concentrations correlated closely with the GLA dose and with the ability of serum (from the same patients) to induce IR-A activation. In contrast to purified GLA, purified M1 did not activate IGF-IR in vitro, even at high concentrations and activated IR-A and IR-B similar to NPH insulin.
Sommerfeld et al. (6) found that GLA had a higher affinity for the IGF-IR and was also more potent than human insulin to stimulate thymidine incorporation in Saos-2 cells. In contrast, M1 and M2 were significantly less active than human insulin in binding to and activating the IGF-IR (6). Their mitogenicity in Saos-2 cells was equal to that of human insulin (6). In another study, IGF-I and GLA more efficiently stimulated phosphatidyl-inositol 3 phosphate (3) production in breast cancer–derived MCF-7 cells as compared with human insulin (22). In contrast, as compared with insulin, M1 and M2 showed lower potency in stimulating hybrid receptors (IR/IGF-IR), they induced less phosphatidyl-inositol 3 phosphate (3) production, less Akt and extracellular signal–related kinase 1/2 phosphorylation, and less DNA synthesis in MCF-7 cells. These experimental results are in keeping with our findings of slightly greater IR-A, IR-B, and IGF-IR activation at high (supraphysiologic) concentrations by GLA compared with human insulin and with data showing that GLA metabolites M1 and M2 do not share these properties of GLA (Fig. 1 and Table 1).
These findings may thus explain why the ability of serum from type 2 diabetic patients to induce IR-A and IR-B activation in the GLA-treated group was comparable to that of patients treated with NPH insulin. Moreover, they may also explain why we previously were not able to detect differences in serum-induced IGF-IR activation between patients treated with GLA or NPH insulin (7).
In a recent study, circulating concentrations of GLA, M1, and M2 were determined in type 1 diabetic subjects after a single subcutaneous dose of 0.3, 0.6, or 1.2 IU/kg GLA, respectively (10). The authors concluded that GLA was rapidly and nearly completely processed into M1. In another study, nine type 2 diabetic subjects were investigated after 1 week of GLA treatment (8). GLA was detected at low concentrations in five of the nine subjects and at only a few time points. In contrast, M1 was detected in all subjects and accounted for most of the plasma insulin and metabolic action of the injected GLA, while M2 was undetectable. In contrast to our study, these studies did not include measurements of the ability of pure hormones or serum from the patients to activate the IR-A, IR-B, and IGF-IR. Moreover, these studies did not address long-term effects of high-dose GLA treatment on GLA and its metabolites. Nevertheless, our findings are in line and consistent with conclusions of these latter studies.
The data in the present and our previous study (7) do not give support to the idea that treatment with GLA in type 2 diabetes leads to a stronger stimulation of the IRs or IGF-IR than NPH insulin. In spite of that, we did find a positive relationship between insulin dose and serum-induced IR-A activation for both treatment groups. This suggests that, irrespective of insulin type, there may be an enhanced IR-A signaling in subjects who are treated with relatively high insulin doses. Whether these results have any clinical consequences is still uncertain. In a recent study, in which an animal model of type 2 diabetes was studied, no differences could be demonstrated in the degree of colonic epithelial proliferation between animals treated with GLA or NPH insulin (23). However, insulin treatment as such did result in a higher degree of colonic epithelial proliferation, suggesting that potential insulin-mediated mitogenic properties are irrespective of the type of insulin (23).
Finally, a few limitations of our study need to be addressed. The LANMET study was not primarily designed and performed to study the effects of insulin therapy on IR-A–, IR-B–, or IGF-IR–stimulating activities. Therefore, the current study is inevitably a post hoc analysis. Secondly, as for all in vitro systems, the IR-A and IR-B KIRA assays do not mimic the exact in vivo conditions. The autophosphorylation of the tyrosine residues at the β-subunits of the IGF-IR and IRs does not necessarily give insights into whether activation of the IGF-IR or IR by an insulin analog results in a normal (i.e., balanced metabolic and mitogenic) activity at cellular level in vivo. Thus, it would be important also to study downstream signaling pathways of the IGF-IR and IRs. However, lack of detectable GLA in plasma after long-term insulin therapy precludes any direct role of GLA in mediating metabolic or mitogenic effects during insulin therapy. Another limitation of the current study is that metabolite measurements were performed at 0 and 36 weeks, but not at other time points.
In conclusion, M1 induced similar IGF-IR, IR-A, and IR-B activation as human insulin. After long-term, high-dose GLA therapy, only M1, but not GLA nor M2, could be detected in the circulation of type 2 diabetic patients. The concentration of plasma M1 correlated with insulin dose and also with IR-A–stimulating activity. Serum from type 2 diabetic patients treated with GLA or NPH insulin induced similar IR-A and IR-B activation. Taken together, these data show that long-term high-dose GLA therapy does not increase IGF-IR signaling.
ACKNOWLEDGMENTS
The LANMET study was sponsored by Sanofi, but the current study was investigator-initiated. The current study was supported by an unrestricted grant from Sanofi (Frankfurt, Germany). Sanofi had no involvement in the study design or in the collection and interpretation of data. The measurement in plasma of insulin glargine, M1, and M2 was performed at and supported by Sanofi. R.S. and N.T. are employees at Sanofi. No other potential conflicts of interest relevant to this article were reported.
A.J.V. wrote the manuscript, researched data, and edited the manuscript. H.Y.-J. contributed to conception and design, researched data, and reviewed and edited the manuscript. R.S. and N.T. researched data and reviewed the manuscript. J.A.M.J.L.J. contributed to conception and design and reviewed and edited the manuscript. All authors gave their final approval of this version of the manuscript to be published. J.A.M.J.L.J. is the guarantor of this work and, as such, had full access to all the data in the study and takes responsibility for the integrity of the data and the accuracy of the data analysis.
Data from this study were presented at The Endocrine Society's 95th Annual Meeting & Expo, San Francisco, California, 15–18 June 2013.
The authors thank R. Kauppinen-Mäkelin (Jorvia Hospital, Espoo, Finland), M. Tiikkainen (University of Helsinki, Helsinki, Finland), M. Vähätalo (City of Turku Health Centre, Turku, Finland), H. Virtamo (City of Turku Health Centre, Turku, Finland), K. Nikkilä (Jorvi Hospital, Espoo, Finland), T. Tulokas (Lappi Central Hospital, Rovaniemi, Finland), S. Hulme (Whiston Hospital, Prescot, U.K.), K. Hardy (Whiston Hospital, Prescot, U.K.), S. McNulty (Whiston Hospital, Prescot, U.K.), J. Hänninen (Mikkeli Health Centre, Mikkeli, Finland), H. Levänen (Mikkeli Health Centre, Mikkeli, Finland), S. Lahdenperä (Sanofi, Helsinki, Finland), R. Lehtonen (Sanofi, Helsinki, Finland), and L. Ryysy (Kymenlaakso Central Hospital, Kotka, Finland) for contributions to the LANMET study. The authors also thank P. Uitterlinden (Erasmus MC, Rotterdam, the Netherlands) for performing the immunoassays.
REFERENCES
- 1.Colhoun HM, SDRN Epidemiology Group Use of insulin glargine and cancer incidence in Scotland: a study from the Scottish Diabetes Research Network Epidemiology Group. Diabetologia 2009;52:1755–1765 [DOI] [PMC free article] [PubMed] [Google Scholar]
- 2.Currie CJ, Poole CD, Gale EA. The influence of glucose-lowering therapies on cancer risk in type 2 diabetes. Diabetologia 2009;52:1766–1777 [DOI] [PubMed] [Google Scholar]
- 3.Hemkens LG, Grouven U, Bender R, et al. Risk of malignancies in patients with diabetes treated with human insulin or insulin analogues: a cohort study. Diabetologia 2009;52:1732–1744 [DOI] [PMC free article] [PubMed] [Google Scholar]
- 4.Jonasson JM, Ljung R, Talbäck M, Haglund B, Gudbjörnsdòttir S, Steineck G. Insulin glargine use and short-term incidence of malignancies-a population-based follow-up study in Sweden. Diabetologia 2009;52:1745–1754 [DOI] [PubMed] [Google Scholar]
- 5.Kurtzhals P, Schäffer L, Sørensen A, et al. Correlations of receptor binding and metabolic and mitogenic potencies of insulin analogs designed for clinical use. Diabetes 2000;49:999–1005 [DOI] [PubMed] [Google Scholar]
- 6.Sommerfeld MR, Müller G, Tschank G, et al. In vitro metabolic and mitogenic signaling of insulin glargine and its metabolites. PLoS ONE 2010;5:e9540. [DOI] [PMC free article] [PubMed] [Google Scholar]
- 7.Varewijck AJ, Janssen JA, Vähätalo M, Hofland LJ, Lamberts SW, Yki-Järvinen H. Addition of insulin glargine or NPH insulin to metformin monotherapy in poorly controlled type 2 diabetic patients decreases IGF-I bioactivity similarly. Diabetologia 2012;55:1186–1194 [DOI] [PMC free article] [PubMed] [Google Scholar]
- 8.Lucidi P, Porcellati F, Rossetti P, et al. Metabolism of insulin glargine after repeated daily subcutaneous injections in subjects with type 2 diabetes. Diabetes Care 2012;35:2647–2649 [DOI] [PMC free article] [PubMed] [Google Scholar]
- 9.Kuerzel GU, Shukla U, Scholtz HE, et al. Biotransformation of insulin glargine after subcutaneous injection in healthy subjects. Curr Med Res Opin 2003;19:34–40 [DOI] [PubMed] [Google Scholar]
- 10.Bolli GB, Hahn AD, Schmidt R, et al. Plasma exposure to insulin glargine and its metabolites M1 and M2 after subcutaneous injection of therapeutic and supratherapeutic doses of glargine in subjects with type 1 diabetes. Diabetes Care 2012;35:2626–2630 [DOI] [PMC free article] [PubMed] [Google Scholar]
- 11.Sciacca L, Le Moli R, Vigneri R. Insulin analogs and cancer. Front Endocrinol (Lausanne) 2012;3:21 [DOI] [PMC free article] [PubMed] [Google Scholar]
- 12.Ish-Shalom D, Christoffersen CT, Vorwerk P, et al. Mitogenic properties of insulin and insulin analogues mediated by the insulin receptor. Diabetologia 1997;40(Suppl. 2):S25–S31 [DOI] [PubMed] [Google Scholar]
- 13.Frasca F, Pandini G, Scalia P, et al. Insulin receptor isoform A, a newly recognized, high-affinity insulin-like growth factor II receptor in fetal and cancer cells. Mol Cell Biol 1999;19:3278–3288 [DOI] [PMC free article] [PubMed] [Google Scholar]
- 14.Papa V, Pezzino V, Costantino A, et al. Elevated insulin receptor content in human breast cancer. J Clin Invest 1990;86:1503–1510 [DOI] [PMC free article] [PubMed] [Google Scholar]
- 15.Belfiore A, Frasca F, Pandini G, Sciacca L, Vigneri R. Insulin receptor isoforms and insulin receptor/insulin-like growth factor receptor hybrids in physiology and disease. Endocr Rev 2009;30:586–623 [DOI] [PubMed] [Google Scholar]
- 16.Benecke H, Flier JS, Moller DE. Alternatively spliced variants of the insulin receptor protein. Expression in normal and diabetic human tissues. J Clin Invest 1992;89:2066–2070 [DOI] [PMC free article] [PubMed] [Google Scholar]
- 17.Mosthaf L, Grako K, Dull TJ, Coussens L, Ullrich A, McClain DA. Functionally distinct insulin receptors generated by tissue-specific alternative splicing. EMBO J 1990;9:2409–2413 [DOI] [PMC free article] [PubMed] [Google Scholar]
- 18.Seino S, Seino M, Nishi S, Bell GI. Structure of the human insulin receptor gene and characterization of its promoter. Proc Natl Acad Sci USA 1989;86:114–118 [DOI] [PMC free article] [PubMed] [Google Scholar]
- 19.Yki-Järvinen H, Kauppinen-Mäkelin R, Tiikkainen M, et al. Insulin glargine or NPH combined with metformin in type 2 diabetes: the LANMET study. Diabetologia 2006;49:442–451 [DOI] [PubMed] [Google Scholar]
- 20.Chen JW, Ledet T, Orskov H, et al. A highly sensitive and specific assay for determination of IGF-I bioactivity in human serum. Am J Physiol Endocrinol Metab 2003;284:E1149–E1155 [DOI] [PubMed] [Google Scholar]
- 21.Varewijck AJ, Brugts MP, Frystyk J, et al. Circulating insulin-like growth factors may contribute substantially to insulin receptor isoform A and insulin receptor isoform B signalling. Mol Cell Endocrinol 2013;365:17–24 [DOI] [PMC free article] [PubMed] [Google Scholar]
- 22.Pierre-Eugene C, Pagesy P, Nguyen TT, et al. Effect of insulin analogues on insulin/IGF1 hybrid receptors: increased activation by glargine but not by its metabolites M1 and M2. PLoS ONE 2012;7:e41992. [DOI] [PMC free article] [PubMed] [Google Scholar]
- 23.Nagel JM, Staffa J, Renner-Müller I, et al. Insulin glargine and NPH insulin increase to a similar degree epithelial cell proliferation and aberrant crypt foci formation in colons of diabetic mice. Horm Cancer 2010;1:320–330 [DOI] [PMC free article] [PubMed] [Google Scholar]


