Abstract
Several mechanisms, such as innate immune responses via Toll-like receptor-4, accumulation of diacylglycerols (DAG)/ceramides, and activation of protein kinase C (PKC), are considered to underlie skeletal muscle insulin resistance. In this study, we examined initial events occurring during the onset of insulin resistance upon oral high-fat loading compared with lipid and low-dose endotoxin infusion. Sixteen lean insulin-sensitive volunteers received intravenous fat (iv fat), oral fat (po fat), intravenous endotoxin (lipopolysaccharide [LPS]), and intravenous glycerol as control. After 6 h, whole-body insulin sensitivity was reduced by iv fat, po fat, and LPS to 60, 67, and 48%, respectively (all P < 0.01), which was due to decreased nonoxidative glucose utilization, while hepatic insulin sensitivity was unaffected. Muscle PKCθ activation increased by 50% after iv and po fat, membrane Di-C18:2 DAG species doubled after iv fat and correlated with PKCθ activation after po fat, whereas ceramides were unchanged. Only after LPS, circulating inflammatory markers (tumor necrosis factor-α, interleukin-6, and interleukin-1 receptor antagonist), their mRNA expression in subcutaneous adipose tissue, and circulating cortisol were elevated. Po fat ingestion rapidly induces insulin resistance by reducing nonoxidative glucose disposal, which associates with PKCθ activation and a rise in distinct myocellular membrane DAG, while endotoxin-induced insulin resistance is exclusively associated with stimulation of inflammatory pathways.
Insulin resistance is frequently associated with obesity and precedes the onset of type 2 diabetes by decades (1). Although the pathogenesis of common insulin resistance is not yet clarified, activation of the innate immune system and abnormal lipid and/or energy metabolism are considered as key mechanisms (2,3).
Particularly, circulating fatty acids (FA) and triglycerides associate with obesity and insulin resistance and can predict type 2 diabetes (3–5). Using intravenous lipid infusion in humans made it possible to detect that FA elevation induces insulin resistance (6), which is due to a reduction of insulin-stimulated muscle glucose transport (6,7). While numerous studies, mainly in rodents, showed that a long-term high-fat diet also results in insulin resistance (3), data on the initiation of insulin resistance after a single high-fat meal are scarce (8). Moreover, the mechanisms underlying lipid-induced insulin resistance are also under debate. Cellular accumulation of lipid metabolites such as diacylglycerols (DAG) can activate novel protein kinase C (PKC) isoforms, which cause serine phosphorylation of insulin receptor substrate-1 (3). Alternatively, binding of FA to muscle Toll-like receptor 4 (TLR4) can give rise to ceramides, which impair insulin-stimulated AKT activation (9). FA, like the bacteria-derived lipopolysaccharide (LPS), may bind to TLR4 on macrophages and adipocytes and thereby activate the innate immune system and proinflammatory pathways (10). Indeed, deficiency of TLR4 (11) or CD14 (12) largely protects mice from lipid-induced insulin resistance, suggesting a causal role of the CD14–TLR4 receptor complex for high-fat diet and LPS-induced insulin resistance. Of note, ingestion of high-fat meals and infusion of low-dose LPS can raise circulating cytokines (13,14), which in turn could activate different cellular pathways and raise lipid metabolites (2,3,9). These divergent and complex findings leave the primary mechanism by which fat loading induces insulin resistance in humans unresolved.
This study examined the initial events associated with the onset of insulin resistance upon a high-fat load applied either by the oral or the intravenous route compared with induction of a similar degree of insulin resistance by low-dose LPS infusion in healthy humans.
RESEARCH DESIGN AND METHODS
Volunteers.
All participants gave their written informed consent before inclusion into the study (ClinicalTrials.gov identifier number NCT01054989), which was performed according to the Declaration of Helsinki and approved by the local institutional ethics board. Inclusion criteria were an age of 20–40 years and a BMI of 20–25 kg/m2. Exclusion criteria were dysglycemia, menstrual irregularities, family history of diabetes, a history of smoking, and other acute or chronic diseases including cancer. Humans taking any medication affecting insulin sensitivity, lipid metabolism, or immune system were also excluded. Screening included a standardized 75-g oral glucose tolerance test, routine laboratory tests, bioimpedance analysis to obtain lean body mass, and a questionnaire on habitual physical activity. Females were studied between days 5–9 of their menstrual cycle. All participants were assigned to 4 study days at least 4 weeks apart in random order and were instructed to maintain normal physical activity and a carbohydrate-rich diet for 3 days before all study days.
Experimental design.
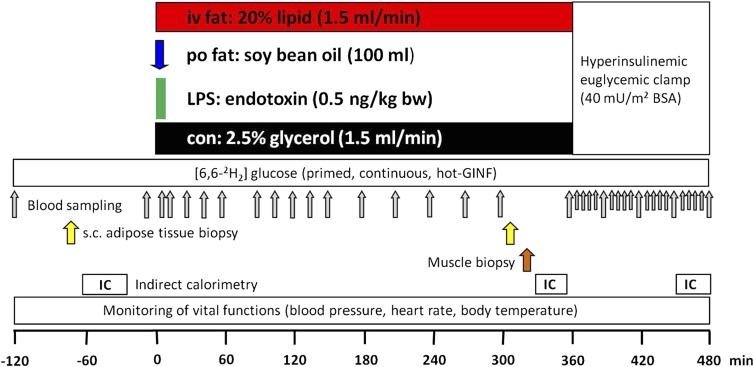
Participants arrived at the Clinical Research Center in the morning after 10-h overnight fasting (Fig. 1). Two intravenous catheters were inserted to contralateral forearm veins. From −120 min, a continuous infusion (0.036 mg · [kg body weight]−1 · min−1) of D-[6,6-2H2]glucose (99% enriched in 2H glucose; Cambridge Isotope Laboratories, Andover, MA) was given after a priming bolus (0.36 mg · [kg body weight]−1 · min−1 · [mg/dL fasting plasma glucose]) for 5 min (15). At zero time, participants received one of four interventions: 1) oral fat (po fat): 100 mL of soy bean oil (61% polyunsaturated, 23% monounsaturated, and 16% saturated FA; Sojola; Vandemoortele Deutschland GmbH, Dresden, Germany) consumed within 10 min; 2) LPS: 10-min infusion of LPS (0.5 ng/kg body weight; National Reference Endotoxin, Escherichia coli O:113; USP, Rockville, MD); 3) intravenous fat (iv fat): infusion of Intralipid (1.5 mL/min; Fresenius Kabi GmbH, Bad Homburg, Germany) over 360 min; or 4) control: 2.5% glycerol infusion dissolved in 0.9% saline (1.5 mL/min; Fresenius Kabi GmbH) for 6 h. Each intervention was followed by a hyperinsulinemic-euglycemic clamp (10-min insulin bolus: 40 U/h; continuous insulin infusion: 40 mU · m−2 · min−1; Insuman Rapid; Sanofi, Frankfurt, Germany). Plasma glucose was adjusted with 20% glucose (B. Braun AG, Melsungen, Germany) enriched with 2% D-[6,6-2H2]glucose to 5.0 mmol/L according to previously established protocols (15). Vital function (heart rate, blood pressure, and body temperature) was monitored every 30 min. Only endotoxin administration led to mild flulike symptoms with a maximum after 3 h, while other interventions had no side effects.
FIG. 1.
Study protocol. One out of four interventions was started at 0 min at each study day: 1) iv fat: infusion of intralipid (1.5 mL/min) over 360 min; 2) po fat: 100 mL of soy bean oil consumed within 10 min; 3) LPS: short-term infusion of LPS (0.5 ng/kg body weight [bw]); or 4) control (con): infusion of 2.5% glycerol solution (1.5 mL/min) for 6 h. GINF, glucose infusion; s.c., subcutaneous; IC, indirect calorimetry.
Indirect calorimetry.
Indirect calorimetry was performed in the canopy mode using Vmax Encore 29n (CareFusion, Höchberg, Germany) during baseline, end of intervention, and steady-state clamp conditions for 20 min after 10-min adaptation. Oxygen consumption (VO2) and carbon dioxide production (VCO2) were measured and respiratory quotient and resting energy expenditure (REE) calculated using abbreviated Weir equations. Substrate oxidation was calculated with fixed estimated protein oxidation rate (Pox) of 15% of REE: carbohydrate oxidation rate (mg · kg−1 · min−1) = ([4.55 · VCO2] − [3.21 · VO2] − 0.459 · Pox) · 1,000/kg body weight; lipid oxidation rate (mg · kg−1 · min−1) = ([1.67 · VO2] − [1.67 · VCO2] − 0.307· Pox) · 1,000/kg body weight (16). Nonoxidative glucose disposal was calculated from the difference between rate of glucose disappearance and carbohydrate oxidation.
Muscle biopsy.
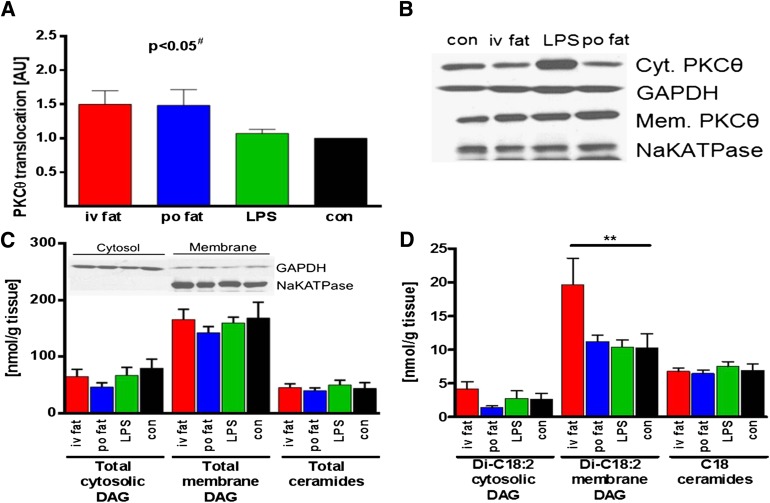
The biopsy was obtained at the end of intervention period from the vastus lateralis muscle using a modified Bergström needle with suction under local anesthesia as described (17). Samples were immediately blotted free of blood, fat, and connective tissue, frozen in liquid nitrogen and stored at −80°C. For DAG extraction, muscle tissue was homogenized in buffer A (20 mmol/L Tris-HCl, 1 mmol/L EDTA, 0.25 mmol/L EGTA, 250 mmol/L sucrose, and 2 mmol/L phenylmethylsulfonyl fluoride) containing a protease and phosphatase inhibitor mixture (Roche) in thickwall polycarbonate tubes and centrifuged (40,000 × g, 4°C, 1 h). The supernatants containing the cytosolic fraction were collected, the pellet was resuspended in 500 µl buffer A as membrane fraction, and enrichment of membrane and cytosolic proteins was checked by Western blotting (Fig. 6C). DAG and ceramide levels were measured using mass spectrometry as described (18). Total DAG content is expressed as the sum of individual species. Measurement of membrane translocation of PKCθ was performed as described (19). Both membrane and cytosolic proteins were detected on the same film with enhanced chemiluminescence at the same exposure time. PKCθ translocation was expressed as the ratio of arbitrary units of membrane bands over cytosol bands (Fig. 6B). Membrane band density was corrected by sodium potassium ATPase band density (Abcam, Cambridge MA), and cytosolic band density was corrected by glyceraldehyde-3-phosphate dehydrogenase band density (Cell Signaling Technology, Danvers, MA).
FIG. 6.
Muscle PKCθ translocation (A), total cytosolic (Cyt.) and membrane (Mem.) DAG, total ceramides (C), and C18 DAG and C18 ceramide levels (D). Representative blot of cytosolic/membrane PKCθ using enhanced chemiluminescence and respective control (con) proteins (sodium potassium ATPase [NaKATPase] for membrane and glyceraldehyde-3-phosphate dehydrogenase [GAPDH] for cytosolic band density) for correction (B), and enrichment of cytosolic/membrane markers after DAG fractionation is depicted as inset in C. Biopsies were taken 5 h after intervention: iv fat (red), po fat (blue), LPS (green), and control (con; black). #P < 0.05 for overall difference between groups analyzed by repeated-measures ANOVA; **P < 0.01 vs. control using repeated-measures ANOVA. AU, arbitrary units.
Subcutaneous adipose tissue biopsy.
The biopsy was obtained before and at the end of the intervention period from abdominal subcutaneous adipose tissue by needle suction technique under local anesthesia. Fat tissue was immediately blotted free of blood, frozen in liquid nitrogen, and stored at −80°C. Total RNA was isolated according to the protocol of the miRNeasy Mini Kit (Qiagen, Hilden, Germany) including on-column DNase digestion. RNA quantity and quality were determined by Nanodrop (Peqlab, Erlangen, Germany) and RNA 6000 Nano Kit (Agilent Technologies, Böblingen, Germany). For reverse transcription, we used the miScript Reverse Transcription Kit (Qiagen) and for RT-PCR, QuantiTect SYBR Green PCR Kit and QuantiTect Primer Assay (Qiagen). Details are given in Supplementary Fig. 1. For relative quantification of gene expression, we used the comparative threshold cycle method and determined the threshold to be 0.4 and the baseline to be between cycle 3 and 15.
Metabolites and hormones.
Blood samples were immediately chilled, centrifuged, and supernatants stored at −20°C until analysis. Venous blood glucose concentration was measured immediately using the glucose oxidase method, which offers excellent performance (EKF biosen C-Line glucose analyzer; EKF Diagnostic GmbH, Barleben, Germany) (20). Serum triglycerides, liver enzymes, and cholesterol were analyzed enzymatically on a Hitachi analyzer (Roche Diagnostics, Mannheim, Germany). Plasma chylomicron content was determined from the triglyceride concentration in the first fraction of density gradient ultracentrifugation as described (21). FA were assayed microfluorimetrically (intra-assay coefficient of variation [CV]; <1%, interassay CV, 2.4%; Wako, Neuss, Germany) after prevention of in vitro lipolysis using orlistat (22). Serum C-peptide, insulin, and plasma glucagon were measured by radioimmunoassay (intra-assay CV for all, <1%; interassay CV, 6 to 7, 5–9, and 5–10%, respectively; Millipore, St. Charles, MO). Cortisol was measured using fluorescence polarization immunoassay on the Axsym analyzer (intra-assay CV, 4.0%; interassay CV, 5.9%; Abbott, Abbott Park, IL). Glucagon-like peptide 1 (GLP-1) and gastric inhibitor peptide (GIP) were measured using ELISA (GLP-1: interassay CV, 10%; TECOmedical, Sissach, Switzerland; GIP: interassay CV, 12%; Millipore). Serum inflammatory markers were assayed using the Quantikine HS (tumor necrosis factor-α [TNF-α], interleukin-6 [IL-6]) and Quantikine (interleukin-1 receptor antagonist [IL-1ra]) ELISA kits (R&D Systems, Wiesbaden, Germany) as described (23) with mean intra-assay and interassay CVs of 6.7, 5.2, and 3.9 and 8.8, 15.5, and 10.9%, respectively, and limits of detection of 0.25, 0.08, and 14 pg/mL, respectively.
Fluorescence-activated cell sorting.
The distribution of leukocyte subfractions from heparinized blood samples was determined before and after 300 min. Upon lysis of erythrocytes using BD Lysing solution (BD Biosciences, Heidelberg, Germany), granulocytes, monocytes, and lymphocytes were differentiated by their characteristic forward light scatter/side scatter signals on an FACSCalibur flow cytometer (BD Biosciences) using Cell Quest software (BD Biosciences).
Gas chromatography-mass spectrometry.
Determination of atom percent enrichment (APE) of 2H was done as described (24) after deproteinization. Briefly, 100 µL KF-EDTA plasma was diluted with an equal amount of water and deproteinized after adding 300 µL of 0.3 N ZnSO4 solution followed by 300 µL of 0.3 N Ba(0H)2 solution. After vortexing for 20 min, samples were centrifuged (21,000 × g, room temperature). Then, 400 µL was evaporated under a stream of nitrogen 5.0 at 37°C, and both endogenous and infused [6,6-2H2] glucose were derivatized with hydroxylamine hydrochloride (100 µL of 2% solution in pyridine, 60 min at 90°C, cooling for 5 min) and acetic anhydride (200 µL, 60 min at 90°C, 5-min cooling) to the aldonitrile-pentaacetate. The analyses were performed on a Hewlett-Packard 6890 gas chromatograph equipped with a 25-m CPSil5CB capillary column (0.2-mm inner diameter, 0.12-µm film thickness; Chrompack/Varian, Middelburg, the Netherlands) and interfaced to a Hewlett Packard 5975 mass selective detector (Hewlett Packard). Selected ion monitoring was used to determine enrichments of the fragments C3 to C6 with the average mass units 187 for the endogenous glucose and 189 for the [6,6-2H2]glucose. Intra- and interassay CVs were 0.6 and 1.0%.
Calculation of whole-body glucose turnover and endogenous glucose production.
Rates of endogenous glucose production (EGP) were determined from the tracer infusion rate of D-[6,6-2H2] glucose and its enrichment to the hydrogens bound to carbon 6 divided by the mean percent enrichment of plasma D-[6,6-2H2]glucose. Because tracer-to-tracee ratios were constant after 300 min (Supplementary Fig. 1B), steady-state equations were appropriate for calculation of basal EGP over the last hour of intervention (300–360 min) and insulin-suppressed EGP during the last 30 min of clamp test. Whole-body glucose disposal (M-value) was calculated from glucose infusion rates during the last 30 min of the clamp.
Statistical analyses.
Results are presented as means ± SEM and were compared using two-tailed Student t test for paired analysis (comparisons before and after intervention for circulating immune cells and adipose tissue gene expression) or using repeated-measures ANOVA with the Dunnett post hoc testing. Incremental area under the curve (AUC) was calculated using the trapezoid method. Statistical significance of differences was defined at P < 0.05. Calculations were performed using GraphPad Prism version 4.03 (GraphPad, La Jolla, CA).
RESULTS
Metabolites and hormones.
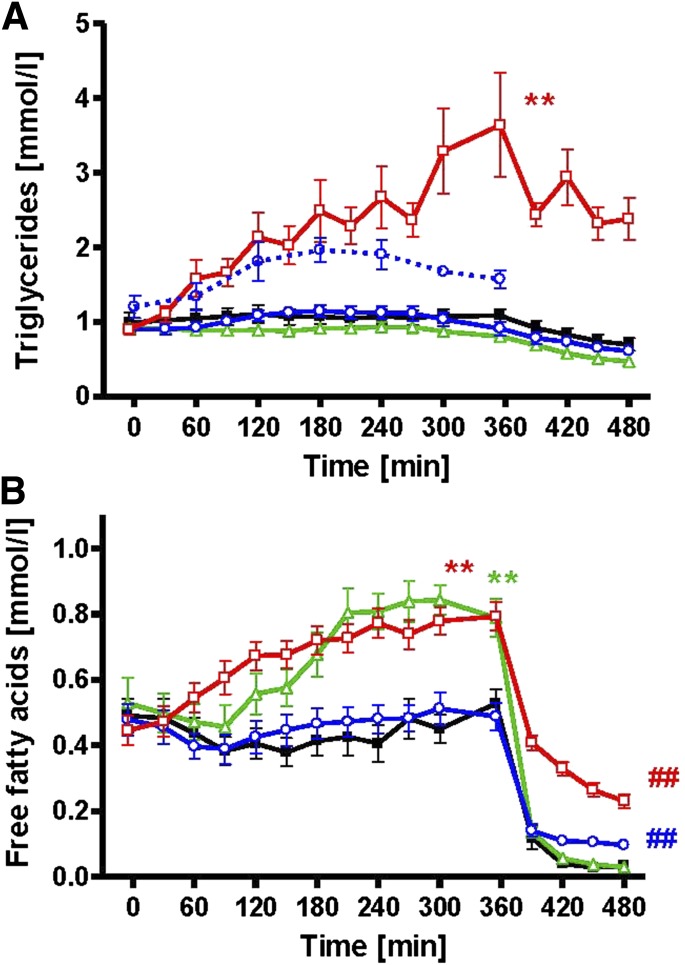
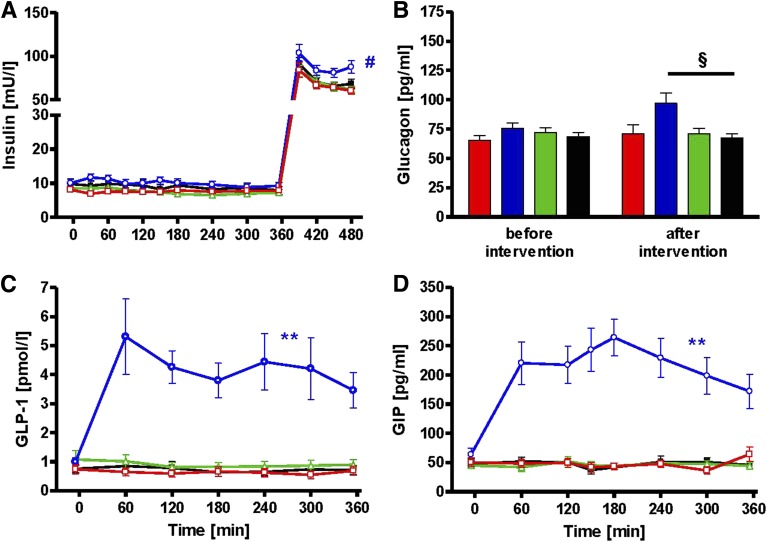
Sixteen lean, young insulin-sensitive volunteers (Table 1) underwent four different interventions (iv fat, po fat, endotoxin [LPS], and glycerol i.v. serving as control) in random order at least 4 weeks apart (Fig. 1). Plasma triglycerides rose continuously to 3.7 ± 0.7 mmol/L (AUC P < 0.01 vs. control) during iv fat infusion and remained unchanged after po fat or LPS (Fig. 2A), while triglyceride content in chylomicrons increased from 1.2 ± 0.3 to 2.0 ± 0.3 mmol/L after po fat (P < 0.05 vs. baseline). Plasma free FA increased after iv fat by 178% to 0.79 ± 0.04 mmol/L at 360 min (AUC P < 0.01 vs. control), but not after po fat (Fig. 2B). Plasma FA started to increase 90 min following endotoxin application to 0.84 ± 0.04 mmol/L (AUC P < 0.01 vs. control). During the clamp, plasma FA decreased rapidly but remained higher after iv and po fat (0.23 ± 0.02 and 0.10 ± 0.02 mmol/L; both P < 0.01 vs. control). Plasma insulin concentrations were constant during the intervention period and increased during clamp after po fat in the presence of comparable clamp-induced glycemia (P < 0.05; Fig. 3A and Supplementary Fig. 1A). In parallel, steady-state plasma C-peptide levels were also greater after po fat compared with control (4.7 ± 0.6 vs. 2.3 ± 0.3 ng/dL; P < 0.01). Only upon po fat, GLP-1 and GIP rose immediately and remained elevated until the end of intervention period (Fig. 3C and D). Plasma glucagon rose after po fat and remained higher until the clamp (Fig. 3B).
TABLE 1.
Volunteers' characteristics
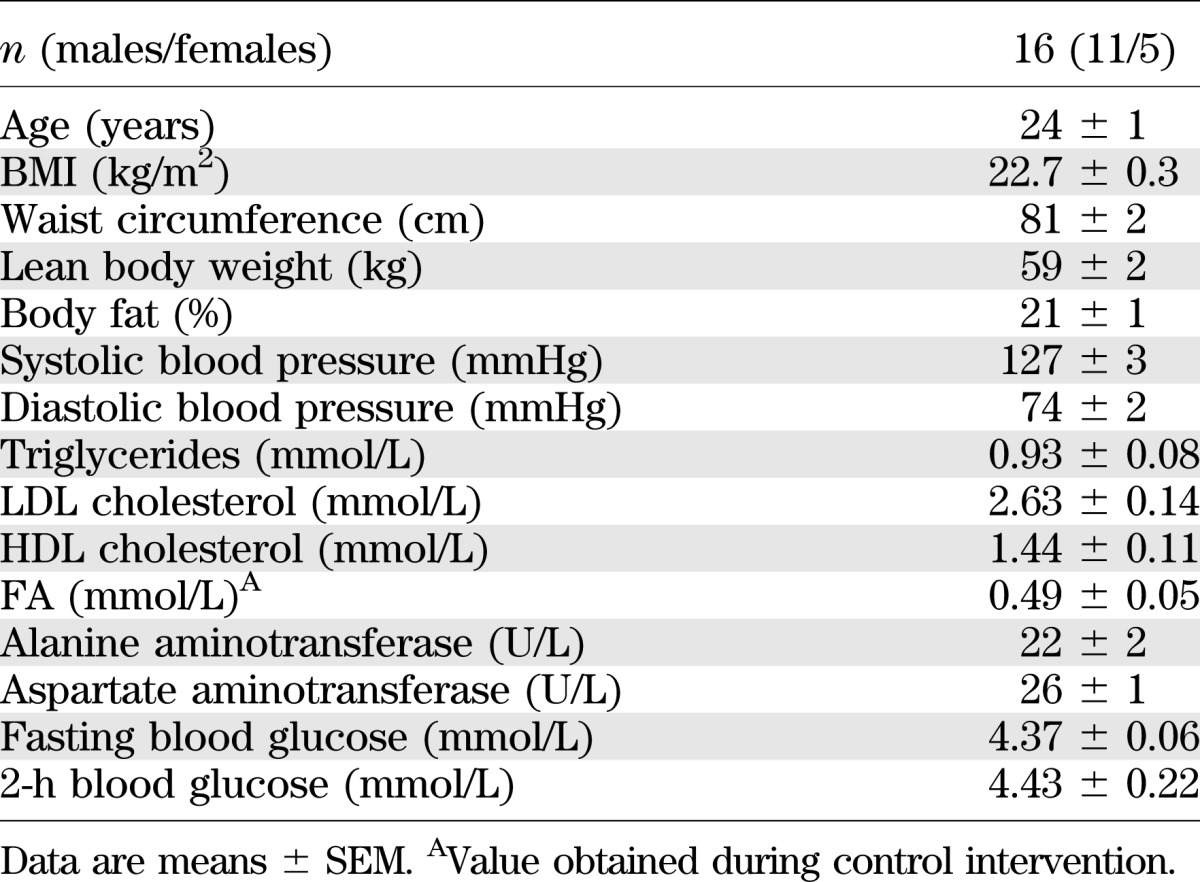
FIG. 2.
Time course of total and chylomicron triglycerides (A) and FA (B) during iv fat (red), po fat (blue), LPS (green), control (black), and triglyceride content in chylomicron fraction after po fat as broken line (blue). **P < 0.01 for AUC during intervention vs. AUC during control; ##P < 0.01 vs. control at 480 min using repeated-measures ANOVA and post hoc Dunnett testing.
FIG. 3.
Time course of plasma insulin (A), glucagon (B), GLP-1 (C), and GIP (D) during iv fat (red), po fat (blue), LPS (green), and control (black). **P < 0.01 for AUC during po fat vs. AUC during control; #P < 0.05 po fat vs. control for mean of 450 and 480 min and P < 0.01 vs. fat iv and LPS, respectively; §P < 0.05 po fat vs. control using repeated-measures ANOVA and post hoc Dunnett testing.
Tissue-specific insulin sensitivity.
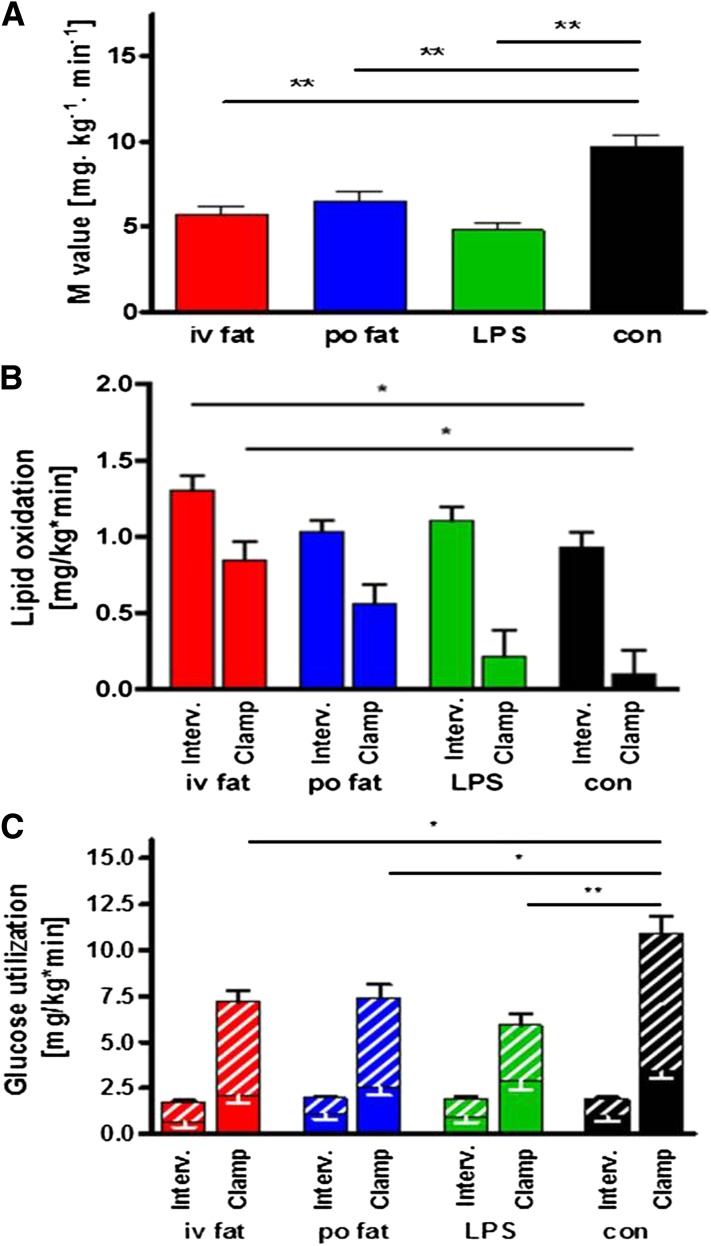
The iv and po fat as well as endotoxin similarly reduced whole-body insulin sensitivity compared with control to 60, 67, and 48%, respectively (all P < 0.01; Fig. 4A). Hepatic insulin sensitivity, assessed from insulin-mediated suppression of EGP, was not different among all studies (EGP suppression by 42 ± 8% [iv fat], 67 ± 13% [po fat], and 54 ± 7% [LPS] vs. 69 ± 15% after control).
FIG. 4.
Whole-body insulin sensitivity (A) and rates for lipid oxidation (B) and oxidative/nonoxidative glucose use (C). The M-value was obtained during steady-state conditions of the hyperinsulinemic-euglycemic clamp test. Lipid oxidation and glucose use were assessed after intervention (Interv.) and during steady-state conditions of hyperinsulinemic-euglycemic clamp (Clamp). iv fat (red), po fat (blue), LPS (green), and control (con; black), and hatched bars are given for nonoxidative glucose use. Mean ± SEMs are given. *P < 0.05, **P < 0.01 vs. control analyzed by repeated-measures ANOVA and post hoc Dunnett testing.
Energy expenditure and substrate oxidation.
REE was 1579 ± 221 kcal/day, and respiratory quotient was 0.83 ± 0.06%. At 6 h, lipid oxidation rates were 40% higher (P < 0.05) after iv but not after po fat compared with control (Fig. 4B). During insulin stimulation, lipid oxidation rates fell by 39 ± 7, 48 ± 15, 94 ± 18, and 106 ± 22% during iv fat, po fat, LPS, and control (all P < 0.001 vs. fasting), but remained higher after iv fat (P < 0.01 vs. control). Oxidative glucose use was not different among the studies, but iv fat, po fat, and LPS decreased nonoxidative glucose use by 30 (P < 0.05), 33 (P < 0.05), and 56% (P < 0.01) compared with control (Fig. 4C).
Systemic and adipose tissue inflammation.
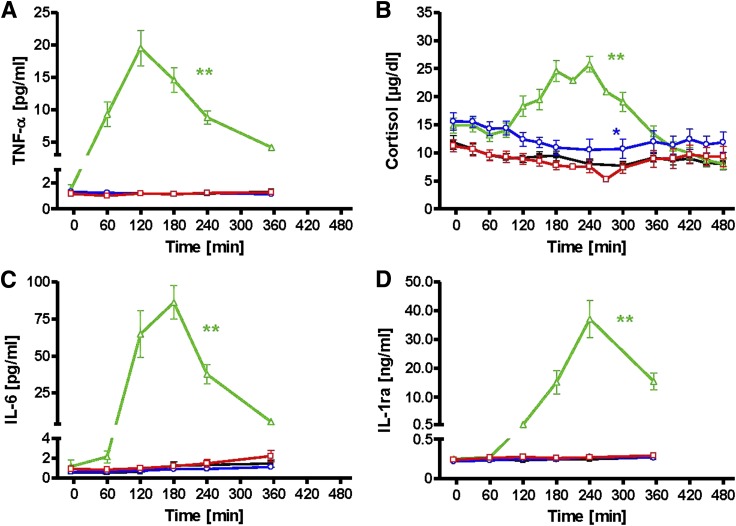
After endotoxin, the fractional contribution of granulocytes to blood leukocytes rose by 44% (P < 0.0001), while that of lymphocytes fell by 75% (P < 0.0001) (Table 2). Po fat induced minor changes of the granulocyte and monocyte fractions. After endotoxin, plasma TNF-α and IL-6 transiently rose, with peaks at 120 and 180 min, respectively. Plasma cortisol and IL-1ra peaked at 240 min (Fig. 5). Neither fat, regardless of the route of administration, nor control conditions affected systemic concentrations of immune markers. In subcutaneous adipose tissue, the mRNA expression of the related genes showed similar behavior and was increased only after endotoxin (Table 2).
TABLE 2.
Parameters of systemic and tissue-specific inflammation

FIG. 5.
Time courses of systemic immune-regulating proteins and hormones. TNF-α (A), cortisol (B), IL-6 (C), and IL-1ra (D). iv fat (red), po fat (blue), LPS (green), and control (black). **P < 0.01 for AUC during intervention vs. AUC during control visit.
Muscle DAG, ceramides, and PKC.
In biopsies obtained from vastus lateralis muscle at 5 h, the membrane/cytosol PKCθ translocation reflecting its activation was 50% greater after iv and po fat, but unchanged after endotoxin when compared with control (P < 0.05 for differences between groups; Fig. 6A and B). Total cytosolic and membrane DAG as well as ceramides were unchanged (Fig. 6C), while the membrane Di-C18:2 DAG species doubled after iv fat (P < 0.01 vs. control; Fig. 6D). After po fat, total membrane DAG and Di-C18:2 DAG species exhibited a tight positive correlation with muscle PKCθ translocation (r = 0.77 and r = 0.86, respectively; both P < 0.05), while iv fat and LPS did not have any effect.
DISCUSSION
This study shows that one single po fat load decreases whole-body insulin sensitivity to an extent comparable to that induced by iv fat or low-dose endotoxin administration. This effect associates with reduced insulin-stimulated nonoxidative glucose use by skeletal muscle and activation of PKCθ, whereas systemic or local adipose tissue inflammation does not seem to be involved.
Previous studies on insulin action after po fat loading found either no or only minor decrease of insulin sensitivity in humans (25–27). This is most likely attributable to the different study designs, which used lipid meals ingested over the course of several hours or up to few weeks or offered mixed meals also containing protein and/or carbohydrates. An hourly intake of oil enriched in polyunsaturated (78%), monosaturated (78%), or saturated FA (50%) over 12 h increased plasma FA starting at 8 h after the first dose and resulted in higher glucose infusion rates during clamps after ingestion of polyunsaturated, but not monosaturated or saturated, FA after 24 h (28). In contrast, the current study demonstrates a profound reduction of insulin sensitivity at 6–8 h after single ingestion of soybean oil rich in polyunsaturated FA (61%), which was used in order to match for the composition of the iv fat solution known to rapidly induce insulin resistance in humans (6,7). The seemingly contradictory findings probably result from different time intervals between fat ingestion and assessment of insulin sensitivity, differences in timing of fat application, its composition, and the absolute plasma FA concentration achieved (26,29). Of note, the aim of the current study was to analyze whether the mechanisms proposed from the lipid infusion models are also involved after ingestion of identically composed pure fat and to set the stage for further studies analyzing mechanisms involved in the interaction of po fat with other macronutrients under real-life conditions.
The current study also found that neither intravenous nor oral lipids immediately affect hepatic insulin sensitivity. Over a longer period of 5 days, a hypercaloric mixed diet containing 60% fat equally composed of poly-, mono-, and saturated FA combined with carbohydrates and proteins affected hepatic glucose metabolism by increased fasting EGP and decreasing hepatic insulin sensitivity (25), but it does not allow conclusions on the effect of fat per se. In contrast, the glycerol infusion used as a control to account for increased glycerol delivery during lipid application may have stimulated gluconeogenesis and resulted in the incomplete (∼75%) insulin-induced suppression of EGP (24). Thus, the design allowed assessing the net hepatic effect of FA and endotoxin application per se at the expense of underestimating total (i.e., glycerol-mediated, hepatic insulin resistance). As this study was primarily designed to examine effects on muscle insulin sensitivity, the use of higher insulin doses may have prevented to detect differences in hepatic insulin sensitivity. In addition, incretin-mediated changes in portal insulin and glucagon concentrations may have masked effects of oral lipid ingestion on liver glucose metabolism, which is sensitive to small changes in portal insulin and glucagon (30). Incretins can also increase lipoprotein lipase activity in adipose tissue (31), thereby further increasing the release and uptake of FA from chylomicrons and reducing the spillover (i.e., the release into the blood) (32), which is in line with the observation of elevated chylomicrons, but not FA, in the current study.
The reduction of insulin-stimulated muscle glucose disposal upon fat or endotoxin application was accounted for by lower nonoxidative glucose disposal without changes in glucose oxidation. This extends the concept originally derived from lipid infusion studies to po fat ingestion and endotoxin exposure, in that diminished muscle glucose uptake is not due to substrate (glucose-FA) competition for oxidation, but results from impaired glucose transport/phosphorylation followed by lower nonoxidative glucose storage (3,6,29). Furthermore, membrane PKCθ was activated in skeletal muscle at 5 h after oral lipid ingestion and lipid infusion. While an increase in membrane PKCθ translocation has been shown in animal models after a 3-week high-fat diet (33) and 3 h after lipid infusion (18,34), PKCθ-knockout mice are protected (35). In humans, PKC isoforms βII and δ, but not θ, were elevated in muscle 6 h after combined insulin and lipid infusion (36), and this has not been reported after high-fat meals in humans before. Thus, basal muscle PKCθ activation may represent the key signaling event in lipid-induced insulin resistance by serine phosphorylation of insulin receptor substrate-1 at residues 307/312 (18) or 1101 (37) or alternatively via serine phosphorylation of 3-phosphoinositide-dependent kinase-1, which in turn inactivates Akt (38).
Although muscle PKCθ is a target of DAG, total DAG concentrations were not different between all interventions at 5 h, which is in line with one (39) but not with other studies reporting increased total DAG at 5 to 6 h of a parallel lipid and insulin–glucose infusion in humans (36) and mice (18,40). Other studies associated PKCθ or other PKC isoforms with increased DAG concentrations in cross-sectional analyses (36,41) or after high-fat diet in mice (42). Nevertheless, total DAG mass might be less relevant for insulin sensitive pathways than its distribution in specific subcellular compartments (41,43,44). In this study, we show that myocellular membrane Di-C18:2 DAG content was increased at 5 h of lipid infusion, which reflects the 53% content of linoleic acid in the infusion. Of note, desaturation of both FA moieties of total DAG was also found in muscles of obese insulin-resistant humans without lipid infusion (43), whereas others hold Di-C18:0 subspecies responsible (41). Nevertheless, soybean oil infusion in rats exclusively raises myocellular 18:2-fatty acyl CoA within 2 h prior to the transient increase in DAG between 2 and 4 h and ultimately followed by PKCθ translocation in rats (18). This time sequence of events also holds true for lipid infusion in humans (44) and is probably responsible for a peak in DAG species occurring earlier after po fat ingestion than during continuous lipid infusion; therefore, we may have missed the DAG peak in our po fat study.
Total concentrations of ceramide species remained unchanged not only after lipid, but also after endotoxin application. This is similar to some studies in humans (36,39) and mice (18), but not all studies (45,46). The relatively low content of saturated FA (16%) in soybean oil, which are key to de novo synthesis of ceramides also after TLR4 activation (9), could contribute to the divergent results, but the current study cannot exclude a transient increase in ceramides. In humans, high-fat diets generally contain more saturated FA, which might affect the mechanisms causing insulin resistance and could also involve ceramides or inflammatory processes (2,9). Moreover, chronic overnutrition usually leads to greater protein intake with augmented availability of amino acids, which cause insulin resistance via other pathways (17).
The po and iv fat did not result in detectable inflammatory processes, which are known to relate to insulin resistance in humans (47). The minor changes in leukocyte fractions upon po fat are in line with those found upon endotoxin and could result from mild endotoxin spillover, which cannot be confirmed by measuring plasma endotoxin levels, although recent studies suggested an increase in LPS and cytokines after meals enriched in saturated fat (12), indicating that insulin resistance by mainly unsaturated FA occurs independently of TLR4 activation. Application of LPS O:113 induced an equal degree of peripheral insulin resistance in association with pronounced proinflammatory response, including mild clinical signs of increased body temperature (48). Nevertheless, application of other LPS subtypes of Gram-negative bacteria might have caused different effects. The observed rise in TNF-α and IL-6 concentration and adipose tissue expression is comparable to a recent study (14) using combined lipid and endotoxin administration. In this study, we further describe a subsequent rise in the anti-inflammatory cytokine IL-1ra, which could have attenuated the endotoxin effect on insulin sensitivity. Although plasma FA concentrations transiently rose after endotoxin infusion to similar levels as during lipid infusion for about 2 h, this was neither associated with elevation of myocellular lipid intermediates nor with PKCθ translocation. Probably, FA contribute to a more pronounced activation of inflammatory pathways such as nuclear factor-κB p65 binding and c-Jun-N-terminal kinase that mostly mediate endotoxin-induced insulin resistance (47). Additional lipid-induced mechanisms such as reduced blood flow, as reported in a mouse model (49), are possible, but rather unlikely to occur in humans under these conditions (50).
In conclusion, this study showed that: 1) po fat ingestion rapidly induces insulin resistance, which is primarily accounted for by reduced muscle nonoxidative glucose disposal; 2) lipid-induced insulin resistance is due to PKCθ translocation and likely mediated by distinct myocellular membrane DAG, but neither by local nor systemic inflammation in humans; and 3) endotoxin-induced insulin resistance also starts in skeletal muscle, occurs independently of PKCθ, and is exclusively associated with adipose tissue inflammation.
Supplementary Material
ACKNOWLEDGMENTS
This study was supported in part by the European Foundation for the Study of Diabetes (EFSD Clinical Research Grant in the Field of Diabetes 2010), the German Research Foundation (Deutsche Forschungsgemeinschaft, SFB 575), the German Diabetes Association (“Fett & Immunregulation”), the German Center for Diabetes Research (DZD e.V.), and grants from the National Institutes of Health (DK-49230, DK-085638, and DK-45735).
N.C.S. is currently on leave of absence and employed by Lilly Deutschland GmbH. No other potential conflicts of interest relevant to this article were reported.
B.N. wrote the manuscript and researched data. L.Z., D.K., M.C., T.Y., J.S., and E.P. researched data. P.J.N., C.H., P.S., N.C.S., and G.I.S. contributed to discussion and reviewed and edited the manuscript. M.R. designed the study, contributed to discussion, and reviewed and edited the manuscript. M.R. is the guarantor of this work and, as such, had full access to all the data in the study and takes responsibility for the integrity of the data and the accuracy of the data analysis.
The authors thank Monika Dirk, Petra Heidkamp, and Elisabeth Moll for taking care of the volunteers; Gabriele Gornitzka, Dr. Barbara Menart-Houtermans, Irena Latta, Diana Musenbrock, Karin Röhrig, Ruth Rütter, and Rita Schreiner for excellent technical assistance; and Dr. Achim Hübinger for helping with adipose tissue biopsies (all at the German Diabetes Center).
Footnotes
Clinical trial reg. no. NCT01054989, clinicaltrials.gov.
This article contains Supplementary Data online at http://diabetes.diabetesjournals.org/lookup/suppl/doi:10.2337/db12-1179/-/DC1.
REFERENCES
- 1.Tabák AG, Jokela M, Akbaraly TN, Brunner EJ, Kivimäki M, Witte DR. Trajectories of glycaemia, insulin sensitivity, and insulin secretion before diagnosis of type 2 diabetes: an analysis from the Whitehall II study. Lancet 2009;373:2215–2221 [DOI] [PMC free article] [PubMed] [Google Scholar]
- 2.Gregor MF, Hotamisligil GS. Inflammatory mechanisms in obesity. Annu Rev Immunol 2011;29:415–445 [DOI] [PubMed] [Google Scholar]
- 3.Samuel VT, Shulman GI. Mechanisms for insulin resistance: common threads and missing links. Cell 2012;148:852–871 [DOI] [PMC free article] [PubMed] [Google Scholar]
- 4.Jensen MD, Haymond MW, Rizza RA, Cryer PE, Miles JM. Influence of body fat distribution on free fatty acid metabolism in obesity. J Clin Invest 1989;83:1168–1173 [DOI] [PMC free article] [PubMed] [Google Scholar]
- 5.Paolisso G, Tataranni PA, Foley JE, Bogardus C, Howard BV, Ravussin E. A high concentration of fasting plasma non-esterified fatty acids is a risk factor for the development of NIDDM. Diabetologia 1995;38:1213–1217 [DOI] [PubMed] [Google Scholar]
- 6.Roden M, Price TB, Perseghin G, et al. Mechanism of free fatty acid-induced insulin resistance in humans. J Clin Invest 1996;97:2859–2865 [DOI] [PMC free article] [PubMed] [Google Scholar]
- 7.Roden M, Krssak M, Stingl H, et al. Rapid impairment of skeletal muscle glucose transport/phosphorylation by free fatty acids in humans. Diabetes 1999;48:358–364 [DOI] [PubMed] [Google Scholar]
- 8.Giacco R, Clemente G, Busiello L, et al. Insulin sensitivity is increased and fat oxidation after a high-fat meal is reduced in normal-weight healthy men with strong familial predisposition to overweight. Int J Obes Relat Metab Disord 2004;28:342–348 [DOI] [PubMed] [Google Scholar]
- 9.Bikman BT, Summers SA. Ceramides as modulators of cellular and whole-body metabolism. J Clin Invest 2011;121:4222–4230 [DOI] [PMC free article] [PubMed] [Google Scholar]
- 10.Medzhitov R. Recognition of microorganisms and activation of the immune response. Nature 2007;449:819–826 [DOI] [PubMed] [Google Scholar]
- 11.Shi H, Kokoeva MV, Inouye K, Tzameli I, Yin H, Flier JS. TLR4 links innate immunity and fatty acid-induced insulin resistance. J Clin Invest 2006;116:3015–3025 [DOI] [PMC free article] [PubMed] [Google Scholar]
- 12.Cani PD, Amar J, Iglesias MA, et al. Metabolic endotoxemia initiates obesity and insulin resistance. Diabetes 2007;56:1761–1772 [DOI] [PubMed] [Google Scholar]
- 13.Nappo F, Esposito K, Cioffi M, et al. Postprandial endothelial activation in healthy subjects and in type 2 diabetic patients: role of fat and carbohydrate meals. J Am Coll Cardiol 2002;39:1145–1150 [DOI] [PubMed] [Google Scholar]
- 14.Krogh-Madsen R, Plomgaard P, Akerstrom T, Møller K, Schmitz O, Pedersen BK. Effect of short-term intralipid infusion on the immune response during low-dose endotoxemia in humans. Am J Physiol Endocrinol Metab 2008;294:E371–E379 [DOI] [PubMed] [Google Scholar]
- 15.Weickert MO, Loeffelholz CV, Roden M, et al. A Thr94Ala mutation in human liver fatty acid-binding protein contributes to reduced hepatic glycogenolysis and blunted elevation of plasma glucose levels in lipid-exposed subjects. Am J Physiol Endocrinol Metab 2007;293:E1078–E1084 [DOI] [PubMed] [Google Scholar]
- 16.Frayn KN. Calculation of substrate oxidation rates in vivo from gaseous exchange. J Appl Physiol 1983;55:628–634 [DOI] [PubMed] [Google Scholar]
- 17.Tremblay F, Krebs M, Dombrowski L, et al. Overactivation of S6 kinase 1 as a cause of human insulin resistance during increased amino acid availability. Diabetes 2005;54:2674–2684 [DOI] [PubMed] [Google Scholar]
- 18.Yu C, Chen Y, Cline GW, et al. Mechanism by which fatty acids inhibit insulin activation of insulin receptor substrate-1 (IRS-1)-associated phosphatidylinositol 3-kinase activity in muscle. J Biol Chem 2002;277:50230–50236 [DOI] [PubMed] [Google Scholar]
- 19.Kumashiro N, Erion DM, Zhang D, et al. Cellular mechanism of insulin resistance in nonalcoholic fatty liver disease. Proc Natl Acad Sci USA 2011;108:16381–16385 [DOI] [PMC free article] [PubMed] [Google Scholar]
- 20.Nowotny B, Nowotny PJ, Strassburger K, Roden M. Precision and accuracy of blood glucose measurements using three different instruments. Diabet Med 2012;29:260–265 [DOI] [PubMed] [Google Scholar]
- 21.Redgrave TG, Carlson LA. Changes in plasma very low density and low density lipoprotein content, composition, and size after a fatty meal in normo- and hypertriglyceridemic man. J Lipid Res 1979;20:217–229 [PubMed] [Google Scholar]
- 22.Brehm A, Krssak M, Schmid AI, Nowotny P, Waldhäusl W, Roden M. Increased lipid availability impairs insulin-stimulated ATP synthesis in human skeletal muscle. Diabetes 2006;55:136–140 [PubMed] [Google Scholar]
- 23.Herder C, Schneitler S, Rathmann W, et al. Low-grade inflammation, obesity, and insulin resistance in adolescents. J Clin Endocrinol Metab 2007;92:4569–4574 [DOI] [PubMed] [Google Scholar]
- 24.Stingl H, Krssák M, Krebs M, et al. Lipid-dependent control of hepatic glycogen stores in healthy humans. Diabetologia 2001;44:48–54 [DOI] [PubMed] [Google Scholar]
- 25.Brøns C, Jensen CB, Storgaard H, et al. Impact of short-term high-fat feeding on glucose and insulin metabolism in young healthy men. J Physiol 2009;587:2387–2397 [DOI] [PMC free article] [PubMed] [Google Scholar]
- 26.Galgani JE, Uauy RD, Aguirre CA, Díaz EO. Effect of the dietary fat quality on insulin sensitivity. Br J Nutr 2008;100:471–479 [DOI] [PubMed] [Google Scholar]
- 27.Lopez S, Bermudez B, Ortega A, et al. Effects of meals rich in either monounsaturated or saturated fat on lipid concentrations and on insulin secretion and action in subjects with high fasting triglyceride concentrations. Am J Clin Nutr 2011;93:494–499 [DOI] [PubMed] [Google Scholar]
- 28.Xiao C, Giacca A, Carpentier A, Lewis GF. Differential effects of monounsaturated, polyunsaturated and saturated fat ingestion on glucose-stimulated insulin secretion, sensitivity and clearance in overweight and obese, non-diabetic humans. Diabetologia 2006;49:1371–1379 [DOI] [PubMed] [Google Scholar]
- 29.Roden M. How free fatty acids inhibit glucose utilization in human skeletal muscle. News Physiol Sci 2004;19:92–96 [DOI] [PubMed] [Google Scholar]
- 30.Roden M, Perseghin G, Petersen KF, et al. The roles of insulin and glucagon in the regulation of hepatic glycogen synthesis and turnover in humans. J Clin Invest 1996;97:642–648 [DOI] [PMC free article] [PubMed] [Google Scholar]
- 31.Kim SJ, Nian C, McIntosh CH. GIP increases human adipocyte LPL expression through CREB and TORC2-mediated trans-activation of the LPL gene. J Lipid Res 2010;51:3145–3157 [DOI] [PMC free article] [PubMed] [Google Scholar]
- 32.Lambert JE, Parks EJ. Postprandial metabolism of meal triglyceride in humans. Biochim Biophys Acta 2012;1821:721–726 [DOI] [PMC free article] [PubMed] [Google Scholar]
- 33.Bell KS, Schmitz-Peiffer C, Lim-Fraser M, Biden TJ, Cooney GJ, Kraegen EW. Acute reversal of lipid-induced muscle insulin resistance is associated with rapid alteration in PKC-theta localization. Am J Physiol Endocrinol Metab 2000;279:E1196–E1201 [DOI] [PubMed] [Google Scholar]
- 34.Griffin ME, Marcucci MJ, Cline GW, et al. Free fatty acid-induced insulin resistance is associated with activation of protein kinase C theta and alterations in the insulin signaling cascade. Diabetes 1999;48:1270–1274 [DOI] [PubMed] [Google Scholar]
- 35.Kim JK, Fillmore JJ, Sunshine MJ, et al. PKC-theta knockout mice are protected from fat-induced insulin resistance. J Clin Invest 2004;114:823–827 [DOI] [PMC free article] [PubMed] [Google Scholar]
- 36.Itani SI, Ruderman NB, Schmieder F, Boden G. Lipid-induced insulin resistance in human muscle is associated with changes in diacylglycerol, protein kinase C, and IkappaB-alpha. Diabetes 2002;51:2005–2011 [DOI] [PubMed] [Google Scholar]
- 37.Li Y, Soos TJ, Li X, et al. Protein kinase C Theta inhibits insulin signaling by phosphorylating IRS1 at Ser(1101). J Biol Chem 2004;279:45304–45307 [DOI] [PubMed] [Google Scholar]
- 38.Wang C, Liu M, Riojas RA, et al. Protein kinase C theta (PKCtheta)-dependent phosphorylation of PDK1 at Ser504 and Ser532 contributes to palmitate-induced insulin resistance. J Biol Chem 2009;284:2038–2044 [DOI] [PubMed] [Google Scholar]
- 39.Høeg LD, Sjøberg KA, Jeppesen J, et al. Lipid-induced insulin resistance affects women less than men and is not accompanied by inflammation or impaired proximal insulin signaling. Diabetes 2011;60:64–73 [DOI] [PMC free article] [PubMed] [Google Scholar]
- 40.Holland WL, Bikman BT, Wang LP, et al. Lipid-induced insulin resistance mediated by the proinflammatory receptor TLR4 requires saturated fatty acid-induced ceramide biosynthesis in mice. J Clin Invest 2011;121:1858–1870 [DOI] [PMC free article] [PubMed] [Google Scholar]
- 41.Bergman BC, Hunerdosse DM, Kerege A, Playdon MC, Perreault L. Localisation and composition of skeletal muscle diacylglycerol predicts insulin resistance in humans. Diabetologia 2012;55:1140–1150 [DOI] [PMC free article] [PubMed] [Google Scholar]
- 42.Lee HY, Choi CS, Birkenfeld AL, et al. Targeted expression of catalase to mitochondria prevents age-associated reductions in mitochondrial function and insulin resistance. Cell Metab 2010;12:668–674 [DOI] [PMC free article] [PubMed] [Google Scholar]
- 43.Amati F, Dubé JJ, Alvarez-Carnero E, et al. Skeletal muscle triglycerides, diacylglycerols, and ceramides in insulin resistance: another paradox in endurance-trained athletes? Diabetes 2011;60:2588–2597 [DOI] [PMC free article] [PubMed] [Google Scholar]
- 44.Szendrödi J, Yoshimura T, Phielix E, et al. Role of diacylglycerol activation of PKCtheta in lipid-induced muscle insulin resistance in humans (Abstract). Diabetes 2012;61(Suppl. 1):A10. [DOI] [PMC free article] [PubMed] [Google Scholar]
- 45.Straczkowski M, Kowalska I, Nikolajuk A, et al. Relationship between insulin sensitivity and sphingomyelin signaling pathway in human skeletal muscle. Diabetes 2004;53:1215–1221 [DOI] [PubMed] [Google Scholar]
- 46.Watt MJ, Hevener A, Lancaster GI, Febbraio MA. Ciliary neurotrophic factor prevents acute lipid-induced insulin resistance by attenuating ceramide accumulation and phosphorylation of c-Jun N-terminal kinase in peripheral tissues. Endocrinology 2006;147:2077–2085 [DOI] [PubMed] [Google Scholar]
- 47.Glass CK, Olefsky JM. Inflammation and lipid signaling in the etiology of insulin resistance. Cell Metab 2012;15:635–645 [DOI] [PMC free article] [PubMed] [Google Scholar]
- 48.Suffredini AF, Hochstein HD, McMahon FG. Dose-related inflammatory effects of intravenous endotoxin in humans: evaluation of a new clinical lot of Escherichia coli O:113 endotoxin. J Infect Dis 1999;179:1278–1282 [DOI] [PubMed] [Google Scholar]
- 49.Mulligan KX, Morris RT, Otero YF, Wasserman DH, McGuinness OP. Disassociation of muscle insulin signaling and insulin-stimulated glucose uptake during endotoxemia. PLoS ONE 2012;7:e30160. [DOI] [PMC free article] [PubMed] [Google Scholar]
- 50.Szendröedi J, Frossard M, Klein N, et al. Lipid-induced insulin resistance is not mediated by impaired transcapillary transport of insulin and glucose in humans. Diabetes 2012;61:3176–3180 [DOI] [PMC free article] [PubMed] [Google Scholar]
Associated Data
This section collects any data citations, data availability statements, or supplementary materials included in this article.


