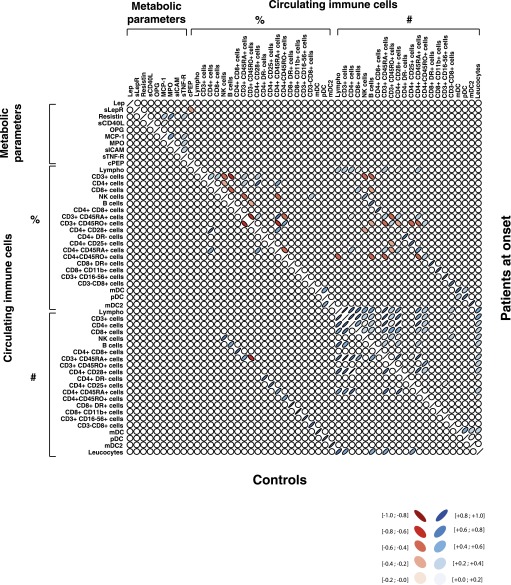
FIG. 4.
Multiple biological correlations in type 1 diabetes. Two-dimensional graphical representation of the Spearman ρ nonparametric correlation matrix among the studied variables. The presence of a significant correlation between two variables is expressed by means of a red (negative correlation) or blue (positive correlation) ellipse, and an empty circle refers to a nonsignificant correlation. The color intensity and thickness of each ellipse are proportional to the correlation value (see graphic legend for numeric values). Correlation analysis, performed on all parameters analyzed, revealed a distinctive immune/metabolic profile for controls and new-onset diabetic patients. A negative correlation between sLepR and β-cell residual fasting C-pep secretion (r = −0.39, P < 0.001) was observed in individuals affected by type 1 diabetes but not in controls. #Absolute number of indicated cell populations with respect to the number of leukocytes; %percentage of indicated cell populations with respect to the number of leukocytes.

