
FIG. 6.
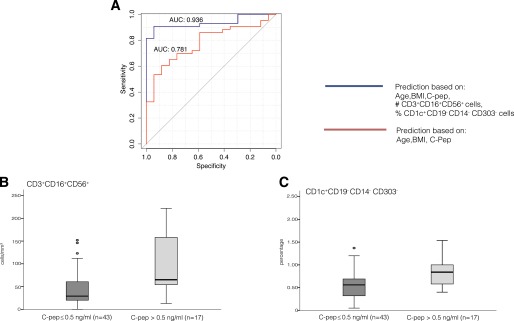
Prediction analysis. A: ROC curves of the model-based prognostic scores for residual β-cell functioning. The base model included age, BMI, and fasting C-pep secretion measured at disease onset, whereas the full model added the number of CD3+CD16+CD56+ T cells and the percentages of mDCs to the base model. B: Box plot shows that high numbers of CD3+CD16+CD56+ T cells at onset are associated with a reduced β-cell activity 1 year later. Low numbers were associated with a residual β-cell function. C: Box plot shows that the high percentage of mDCs at onset was associated with a reduced β-cell activity 1 year later. Conversely, low numbers of these cells were associated with residual β-cell function. Data are shown as median (horizontal line in the box) and Q1 and Q3 (borders of the box). Whiskers represent the lowest and the highest values that are not outliers (i.e., data points below Q1 − 1.5 x IQR or above Q3 + 1.5 × IQR) or extreme values (i.e., data points below Q1 − 3 × IQR or above Q3 + 3 × IQR). Dots represent outlier values and asterisks represent extreme values. Q1 = 25th percentile; Q3 = 75th percentile; IQR (interquartile range) = Q3–Q1. #Absolute number of indicated cell populations with respect to the number of leukocytes; %percentage of indicated cell populations with respect to the number of leukocytes.