

Abstract
The GLUT4 facilitative glucose transporter mediates insulin-dependent glucose uptake. We tested the hypothesis that moderate overexpression of human GLUT4 in mice, under the regulation of the human GLUT4 promoter, can prevent the hyperinsulinemia that results from obesity. Transgenic mice engineered to express the human GLUT4 gene and promoter (hGLUT4 TG) and their nontransgenic counterparts (NT) were fed either a control diet (CD) or a high-fat diet (HFD) for up to 10 weeks. Homeostasis model assessment of insulin resistance scores revealed that hGLUT4 TG mice fed an HFD remained highly insulin sensitive. The presence of the GLUT4 transgene did not completely prevent the metabolic adaptations to HFD. For example, HFD resulted in loss of dynamic regulation of the expression of several metabolic genes in the livers of fasted and refed NT and hGLUT4 TG mice. The hGLUT4 TG mice fed a CD showed no feeding-dependent regulation of SREBP-1c and fatty acid synthase (FAS) mRNA expression in the transition from the fasted to the fed state. Similarly, HFD altered the response of SREBP-1c and FAS mRNA expression to feeding in both strains. These changes in hepatic gene expression were accompanied by increased nuclear phospho-CREB in refed mice. Taken together, a moderate increase in expression of GLUT4 is a good target for treatment of insulin resistance.
GLUT4, the insulin-responsive facilitative glucose transporter, is expressed in adipose, skeletal muscle, and cardiac muscle cells. GLUT4 expression levels are correlated with whole-body insulin-mediated glucose homeostasis. Two lines of evidence support this notion. First, enhanced insulin sensitivity after exercise is associated with increased GLUT4 expression in skeletal muscle (1,2), and second, transgenic manipulation of GLUT4 in mice revealed a profound effect on both glucose and lipid homeostasis (3–6). In addition, insulin-resistant glucose transport in adipocytes from obese and diabetic subjects correlates with reduced GLUT4 mRNA and protein expression (7–9), confirming a role of GLUT4 for insulin-dependent glucose homeostasis.
Adipose tissue and skeletal muscle play unique roles in the regulation of insulin-dependent glucose homeostasis. Proliferation of adipose mass is tightly linked to obesity and the development of insulin resistance. Expansion of adipose mass in obesity is associated with decreased GLUT4 mRNA and protein expression, leading to insulin-resistant glucose transport (10,11). The fat-specific knockout of GLUT4 affects whole-body glucose homeostasis and leads to insulin resistance in muscle and liver (12). This clearly demonstrates a central role for adipose tissue and that GLUT4 levels in adipose tissue affect metabolic control. It is not clear why nutrient excess leads to a loss of GLUT4 in adipose tissue or that overexpression of GLUT4 only in adipose tissue is not sufficient to protect against diet-induced glucose intolerance (13).
Skeletal muscle is the major site of dietary glucose disposal in the body (14). In states of insulin resistance, glucose transport into skeletal muscle is impaired (15,16). At the outset, skeletal muscle insulin resistance occurs through inhibition of GLUT4 redistribution to the cell surface (17,18), indicating a distinct mechanism for the regulation of GLUT4 in muscle tissue compared with adipose tissue. In severe insulin resistance, muscle GLUT4 protein and mRNA expression can be reduced similarly to adipose tissue (19). Muscle-specific transgenic expression of GLUT4 improves insulin action in diabetic mice (20,21), which may be attributable to enhanced basal accumulation of GLUT4 at the cell surface as well as to a partial correction of the defect in insulin-mediated GLUT4 translocation (21). Conversely, transgenic, muscle-specific ablation of GLUT4 results in insulin resistance and inadequate glucose tolerance (22). Taken together, GLUT4-dependent glucose transport in skeletal muscle is likely the major mechanism for dietary glucose disposal by skeletal muscle.
Whole-body insulin-dependent glucose homeostasis results from the interactions of several tissues, including the pancreatic β-cells, liver, adipose tissue, and skeletal muscle. Transgenic mouse models have clearly demonstrated that manipulation of insulin action in one tissue can affect function of other tissues, making it difficult to identify any one target for prevention and treatment of type 2 diabetes (23). In the present study, we used transgenic mice that moderately overexpress the human GLUT4 gene under the control of its own promoter, as previously described (4,24), to better understand the physiologic role GLUT4 plays in the protection against insulin-resistant glucose homeostasis. This line of transgenic mice, referred to as hGLUT4 TG mice, has two unique features that set it apart from other models. First, the level of overexpression is two- to threefold over the endogenous GLUT4, which is similar to increased expression that might be attained from a long-term exercise program (25,26). Second, the transgene is driven by a dynamic human GLUT4 promoter, allowing it to undergo physiologic regulation (4,27). Through this model, we demonstrate that this level of moderate GLUT4 overexpression is highly protective against the development of peripheral insulin resistance in response to diet-induced obesity.
RESEARCH DESIGN AND METHODS
Animals and diets.
The animals used for these experiments were male C57BL/6 mice carrying a random insertion of the human GLUT4 gene (hGLUT4 TG) and have been described elsewhere (4,27). The control mice were the nontransgenic (NT) littermates. All procedures involving animals were approved by the Institutional Animal Care and Use Committee at the University of Oklahoma Health Sciences Center.
All mice were kept in a temperature-controlled room with a 12-h light/dark cycle. Eight to 10 weeks after birth, the mice were housed in individual cages, fasted 17 h for measurement of initial fasting parameters, and fed ad libitum either a control diet (CD) (10% kcal from fat, D12450B) or a high-fat diet (HFD) (60% kcal from fat, D12492) from Research Diets Inc. (New Brunswick, NJ) for indicated times.
Food consumption measurement.
Food consumption was estimated weekly by subtracting the mass of food left from the initial mass of food supplied. Energy intakes were calculated on the basis of 3.8 kcal/g for CD and 5.2 kcal/g for HFD.
Blood and plasma assays.
Blood was collected after 0, 4, and 8 weeks of feeding. The mice were fasted for 17 h, and blood samples from tail veins of conscious mice were collected in tubes containing EDTA. Plasma insulin concentrations were determined with the Ultra Sensitive Mouse Insulin ELISA Kit (Crystal Chem, Downers Grove, IL). Fasting plasma leptin concentrations were determined with the Mouse Leptin ELISA Kit (Crystal Chem). Blood glucose level was measured with the TRUETrack glucometer.
Homeostasis model assessment of insulin resistance scores.
The homeostasis model assessment of insulin resistance (HOMA-IR) scores were calculated from glucose and insulin concentrations obtained from mice after 17 h of fasting. The following equation was used: fasting blood glucose (mg/dL) × fasting insulin (µU/mL)/405.
Body mass and body composition measurements.
Body mass and body composition was measured with a minispec Body Composition Analyzer (LF-90; Bruker Corporation). Measurements were made weekly between 10 a.m. and 12 p.m. in nonfasted mice.
Pyruvate tolerance test.
After an overnight fast, mice were given sodium pyruvate 2 g/kg i.p. Blood glucose levels were measured 0, 20, 40, 60, 90, and 120 min postinjection.
Protein analysis.
Western blot analysis to estimate GLUT4 protein concentration was completed for epididymal white adipose tissue (WAT), subscapular brown adipose tissue (BAT), and quadriceps femoris skeletal muscle. Total detergent extracts were prepared in lysis buffer containing 20 mmol/L HEPES, 2% NP-40 (nonyl phenoxypolyethoxylethanol), 2 mmol/L EDTA, 10 mmol/L sodium fluoride, 10 mmol/L sodium pyrophosphate, 1 mmol/L sodium orthovanadate, 1 mmol/L molybdate, protease inhibitor cocktail (complete Mini EDTA-free Protease Inhibitor Cocktail; Roche Diagnostics), and 1 mmol/L phenylmethylsulfonyl fluoride. Liver nuclear extracts were obtained with use of a kit (Thermo Scientific Pierce). Protein concentrations were determined by using a Coomassie Plus (Bradford) Assay Kit (Thermo Scientific Pierce). Lysates were fractionated with 10% SDS-PAGE, and proteins were transferred to an Immobilon-FL polyvinylidene fluoride membrane (EMD Millipore Corporation, Billerica, MA). Membranes were stained with anti-GLUT4 antibody (C-20 goat polyclonal antibody, Santa Cruz Biotech), total Akt antibody (Cell Signaling), phospho-CREB (Cell Signaling), or total CREB (Cell Signaling) and visualized with appropriate secondary antibodies conjugated with AlexaFluor 680. Fluorescence was quantified with an Odyssey imager (Li-Cor Biosciences-U.S.).
RNA extraction, quantitative real-time PCR.
Mice were fasted for 17 h or were fasted for 17 h then refed for 4 h. After the fasting or fasting and refeeding, the animals were killed, and tissues were harvested and snap frozen in liquid nitrogen. Tissues were stored at −80°C until used later. mRNA was extracted as previously described (28). Samples were stored as an ethanol precipitate at −20°C until further analysis. mRNA levels of mouse GLUT4, human GLUT4, phosphoenolpyruvate carboxykinase (PEPCK), glucose-6-phosphatase (G6Pase), SREBP-1c, fatty acid synthase (FAS), and HMG-CoA reductase were quantified by quantitative real-time PCR (qPCR). Primer sequences were as follows: mouse GLUT4, 5′-AAAAGTGCCTGAAACCAGAG-3′ (forward), 5′-TCACCTCCTGCTCTAAAAGG-3′ (reverse); human GLUT4, 5′-GCGGCGAAGATGAAAGAAC-3′ (forward), 5′-CTCCAGGCCGGAGTCAGA-3′ (reverse); UCP-1, 5′-GTGAAGGTCAGAAT GCAAGC-3′ (forward), 5′-AGGGCCCCCTTCATGAGGTC-3′ (reverse); UCP-2, 5′-CAGCCAGCGCCCAGTACC-3′ (forward), 5′-CAATGCGGACGGAGGCAAAGC-3′ (reverse); PEPCK, 5′-ACACACACACATGCTCACAC-3′ (forward), 5′- ATCACCGCATAGTCTCTGAA-3′ (reverse); G6Pase, 5′-TGGTAGCCCTGTCTTTCTTTG-3′ (forward), 5′- TTCCAGCATTCACACTTTCCT-3′ (reverse); SREBP-1c, 5′-GTGAGCCTGACAAGCAATCA-3′ (forward), 5′-GGTGCCTACAGAGCAAGAG-3′ (reverse); FAS, 5′-GCTGCGGAAACTTCAGGAAAT-3′ (forward), 5′-AGAGACGTGTCACTCCTGGACTT-3′ (reverse); and TATA-binding protein (TBP), 5′-GAAGCTGCGGTACAATTCCAG-3′ (forward), 5′-CCCCTTGTACCCTTCACCAAT-3′ (reverse). The relative mRNA levels were calculated with a standard curve developed from normal mouse tissues. All qPCR analyses were completed with a modular thermal cycler platform comprising a C1000 Touch thermal cycler chassis (Bio-Rad) and a CFX96 optical reaction module (Bio-Rad). qPCR data were read by CFX Manager software (Bio-Rad).
Triacylglycerol analysis.
Plasma triacylglycerol (TAG) levels were measured with the triglyceride determination kit (Sigma) according to the manufacturer’s specifications. Liver TAG levels were measured with the same kit after a Folch extraction of lipids and resuspension in 0.1% Triton X-100.
Statistical analysis.
Data are expressed as mean and SEM. All statistical analyses were completed by VassarStats web-based software. Comparisons were carried out by one- or two-way ANOVA, mice fed CD or NT mice serving as the control groups. Pairwise comparisons were made with the CI set at 95%. Unless otherwise noted, significance was P < 0.05.
RESULTS
Moderate GLUT4 expression protects against diet-induced insulin resistance.
To evaluate the effects of moderate hGLUT4 overexpression under conditions of HFD feeding, we measured blood glucose and plasma insulin levels in hGLUT4 TG mice and NT littermate controls. Blood glucose levels of hGLUT4 TG mice were significantly lower than NT mice fed both CD and HFD (Table 1). In NT mice, blood glucose levels were significantly increased after 4 and 8 weeks on HFD compared with 0 weeks. Blood glucose levels in hGLUT4 TG mice fed HFD were increased at 8 weeks but were still significantly lower than their NT counterparts fed HFD.
TABLE 1.
Fasting plasma glucose and insulin levels
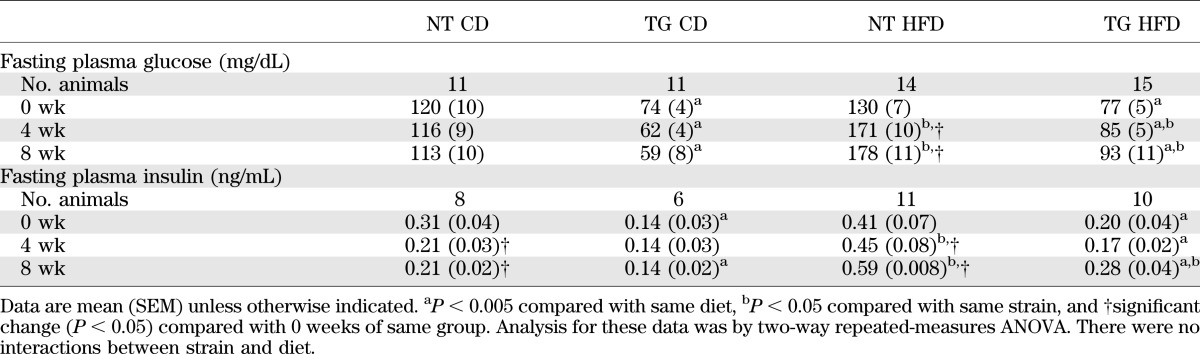
Similar to blood glucose levels, fasting insulin levels were lower in hGLUT4 TG than in NT mice under both dietary regimens at each time point (Table 1). The HFD regimen increased fasting plasma insulin levels in NT animals at both 4 and 8 weeks and in hGLUT4 TG animals at 8 weeks only.
The fasting blood glucose level and plasma insulin level data are consistent with the notion that hGLUT4 TG mice are less predisposed to HFD-induced insulin resistance. To quantify insulin resistance, we used HOMA-IR. hGLUT4 TG mice fed CD had a significantly lower average HOMA-IR score than NT mice fed CD at all time points (Fig. 1). Throughout HFD feeding, the HOMA-IR score for hGLUT4 TG mice was significantly lower than that for NT mice. These data indicate that moderate hGLUT4 overexpression in mice significantly reduces the development of HFD-induced insulin resistance.
FIG. 1.

HOMA-IR scores from NT and hGLUT4 TG mice fed CD or HFD. HOMA-IR scores were calculated from recorded fasting blood glucose and plasma insulin levels at the time indicated. The following equation was used: fasting blood glucose (mg/dL) × fasting insulin (µU/mL)/405. Analysis was by two-way repeated-measures ANOVA. *Significant difference compared with week 0 within the same strain. Differences between strains fed the same diet are shown. There were no interactions between strain and diet.
Moderate GLUT4 overexpression increases food intake but not adiposity.
To determine whether moderate hGLUT4 overexpression affects HFD-induced body composition, body mass, adipose mass, and lean mass were measured in both strains of mice fed either CD or HFD for 8 weeks. HFD conditions significantly increased both body mass and adipose mass in both strains of mice (Fig. 2A). The change in adipose mass reflected increases in white adipose pads but not brown adipose pads (Fig. 2B). Although total adiposity is not different between hGLUT4 TG and NT mice fed HFD, the mass of the epididymal fat pad of hGLUT4 TG mice was significantly greater when expressed as a percentage of body mass (Fig. 2B).
FIG. 2.

Body composition and adipose pad weight from NT and hGLUT4 TG mice fed CD or HFD for up to 8 weeks (n = 5–8 per group). A nuclear magnetic resonance method was used to measure body composition as described in research design and methods. A: Body weight, adipose mass, and lean body mass were measured. B: Wet weights for epididymal WAT and BAT are reported as a percentage of body mass. Data were analyzed by two-way ANOVA. *Significant difference between diets for the same strain. Differences between strains fed the same diet are shown.
The increase in adipose mass was accompanied by increased food intake over the 8-week feeding period. HFD increased energy intake in both NT and hGLUT4 TG mice compared with their CD-fed counterparts (Fig. 3A). When fed HFD, the hGLUT4 TG mice consumed, on average, 10% more kilocalories per week than NT mice (Fig. 3A). Although the 10% increase in food intake increased epididymal fat pat size (Fig. 2B), it was not sufficient to result in a measurable increase in total adiposity in hGLUT4 TG compared with NT mice fed HFD (Fig. 2A). The increased food intake may be partially offset by changes in UCP-1 expression in the visceral fat pad, which is supported by the observation that HFD feeding specifically reduced UCP-1 but not UCP-2 mRNA in the epididymal fat of NT mice fed HFD (Fig. 3B and C). In both strains, the increase in adipose mass correlated with increased plasma leptin levels (Fig. 3D). Plasma leptin levels rose as a function of time on HFD for both strains; however, leptin levels were significantly lower in hGLUT4 TG mice fed HFD at 4 and 8 weeks compared with NT mice fed HFD (Fig. 3D).
FIG. 3.
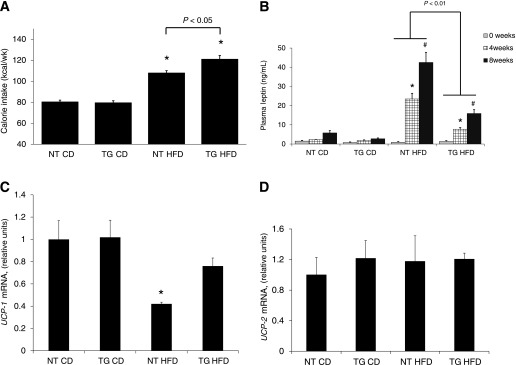
Average energy intake per week and plasma leptin levels from NT and hGLUT4 TG mice fed CD or HFD (n = 5–8 per group). A: Energy intake (kilocalorie equivalent of diet) was averaged over the 8-week feeding period. *Significant difference between diets. Differences between strains are shown. B: Fasting plasma leptin level was measured after 0, 4, and 8 weeks on diet. A strain-specific significant difference is indicated. *Significant difference between 4 and 0 weeks within a strain and diet, and #significant difference between 8 and 4 weeks within a strain and diet. Data were analyzed by one-way ANOVA. UCP-1 (C) and UCP-2 (D) mRNA were measured using qPCR and normalized to TBP mRNA (n = 4 mice per group). *Significant difference by one-way ANOVA.
Moderate GLUT4 overexpression does not prevent loss of GLUT4 expression in adipose tissue.
The blood glucose, plasma insulin, and HOMA-IR data suggest that hGLUT4 TG mice may be protected from insulin resistance presumably through enhanced glucose uptake as a result of mild overexpression of human GLUT4 in peripheral tissues (4,6). However, it is not clear which tissues are responsible for this effect. To determine whether HFD-induced reductions in GLUT4 expression is modified in WAT, BAT, and skeletal muscle in hGLUT4 TG mice, immunoblot analysis of GLUT4 levels in these tissues was carried out after 10 weeks on CD or HFD. As expected, hGLUT4 TG mice fed CD had a two- to threefold higher GLUT4 expression in WAT, BAT, and skeletal muscle than NT mice fed CD (Fig. 4) (4,24). When fed HFD, GLUT4 expression in WAT decreased to similar levels in both strains (Fig. 4A). The changes in GLUT4 protein were correlated with changes in GLUT4 mRNA (Fig. 4B). Both endogenous mouse GLUT4 mRNA and transgenic mRNA were similarly downregulated in response to the HFD. HFD feeding reduced GLUT4 levels in BAT; however, the GLUT4 levels in hGLUT4 TG mice fed HFD remained significantly higher than in NT mice fed HFD (Fig. 4C). The HFD feeding significantly reduced GLUT4 protein levels in skeletal muscle in NT mice but had no effect on that in hGLUT4 TG mice (Fig. 4D). Taken together, it appears that the main effects of GLUT4 overexpression may be a result of enhanced glucose uptake in skeletal muscle and BAT. This finding is consistent with the observation that skeletal muscle is a significant reservoir for hGLUT4 TG mice fed CD (6).
FIG. 4.

GLUT4 protein expression in perigonadal WAT (A), subscapular BAT (B), and hindquarter skeletal muscle (C) from NT and hGLUT4 TG mice fed CD or HFD for 8 weeks. A representative Western blot is shown. The histograms represent quantification of three independent experiments. Densitometry is normalized to Akt expression in each tissue. Mouse and transgenic human GLUT4 mRNA expression in perigonadal WAT (D) is the mean of three independent experiments. Data were analyzed by one-way ANOVA. *Difference between diets for the same strain. Differences between strains fed the same diet are shown. IB, immunoblot.
Moderate GLUT4 overexpression does not prevent diet-dependent changes in hepatic gene expression because of high-fat feeding.
Although moderate overexpression of hGLUT4 appears to maintain GLUT4 in skeletal muscle and protect against peripheral insulin resistance, it is not known whether it prevents all physiologic adaptations to an HFD. To test this possibility, we evaluated hepatic expression of gluconeogenic genes in the fasted and fasted and refed states to determine whether dynamic regulation during this transition is retained. To evaluate gene expression in the transition between fasting and refeeding, both hGLUT4 TG and NT mice fed either CD or HFD were subjected to a 17-h fast or a 17-h fast followed by a 4-h refeeding. Under the refed condition, both hGLUT4 TG and NT mice fed CD showed a significantly lower expression of PEPCK and G6Pase mRNA compared with their fasted counterparts (Fig. 5A and B). When fed HFD, both hGLUT4 TG mice and NT mice lost dynamic regulation PEPCK or G6Pase mRNA expression compared with the fasted and refed state (Fig. 5A and B). These data demonstrate that HFD resulted in constitutive gluconeogenic gene expression in the liver as previously described (29). Despite the changes in gluconeogenic gene expression with HFD, the hGLUT4 TG mice had significantly increased tolerance to pyruvate compared with NT mice (Fig. 5C), suggesting that either hepatic gluconeogenesis was lower or peripheral clearance of glucose was higher in the hGLUT4 TG mice.
FIG. 5.

Hepatic gluconeogenic gene expression during fasting and refeeding from NT and hGLUT4 TG mice fed CD or HFD for 8 weeks (n = 3–5 per group). Livers were removed from mice fasted for 17 h (Fasted) or fasted mice refed for 4 h (Refed). Hepatic mRNA was isolated and analyzed for PEPCK mRNA (A) and G6Pase mRNA (B). Data were analyzed by two-way ANOVA. Significant differences between fasted and fasted and refed are shown. C: Pyruvate tolerance test for NT and hGLUT4 TG mice fed HFD for 8 weeks (n = 5 animals per group). *Significant difference between strains at individual time points by two-tailed Student t test. D: In the fasted and refed group, plasma glucose levels were measured before and after refeeding. Plasma insulin level was measured after refeeding. Data were analyzed by two-way repeated-measures ANOVA. *Significant differences for different strains within the same diet, and #significant differences between same strain on different diets. E: Phospho-CREB and total CREB immunolabeling of fasted and refed liver nuclear extracts. The histogram represents three independent experiments. Data were analyzed by two-way ANOVA. Differences between fasted and refed animals are shown. ¶Significant difference compared with all refed animals, *significant between all refed animals compared with NT mice fed CD, and Asignificant difference between hGLUT4 TG fed HFD and all other fasted mice. F, fasted; IB, immunoblot; NS, not significant; R, refed.
The loss of dynamic regulation of gluconeogenesis was not correlated with diet-induced changes in fed insulin levels because these did not change for hGLUT4 TG mice fed CD compared with HFD (Fig. 5D). Fasted and refed glucose levels were significantly lower in hGLUT4 TG fed both CD and HFD compared with NT mice fed the same diets. Fed insulin levels were indistinguishable between strains fed CD; however, NT mice fed HFD showed trends toward higher fed insulin levels (Fig. 5D).
To determine whether HFD altered counter-regulatory hormone action in the refed state, we measured phospho-CREB and total CREB in liver nuclear extracts (Fig. 5E). As expected, the ratio of phospho-CREB to total CREB in liver nuclei was higher in fasted mice than in refed mice. This pattern was observed in both strains fed CD and in NT fed HFD. The hGLUT4 TG mice fed HFD lost the dynamic regulation of phospho-CREB in the transition from the fasted to the refed state. Hepatic nuclear accumulation of phospho-CREB in hGLUT4 TG mice was significantly lower in the fasted state and significantly higher in the refed state (Fig. 5E).
The transition from fasting to refeeding is accompanied by increased SREBP-1c expression, a transcription factor required for transcription of lipogenic genes regulated by insulin (29). As expected, hepatic expression of SREBP-1c mRNA increased after refeeding of fasted NT mice fed CD (Fig. 6A). SREBP-1c expression did not increase in response to refeeding in hGLUT4 TG mice fed CD (Fig. 6A). NT mice fed HFD lost the ability to increase SREBP-1c mRNA in response to refeeding. Under both feeding regimens, SREBP-1c mRNA in refed hGLUT4 TG mice was significantly lower than in refed NT mice, indicating that the transgene, rather than the diet, was the dominant regulator of SREBP-1c mRNA expression. Changes in expression of FAS mRNA, a target of SREBP-1c, mirrored the diet and strain-dependent changes observed for SREBP-1c mRNA (Fig. 6B).
FIG. 6.
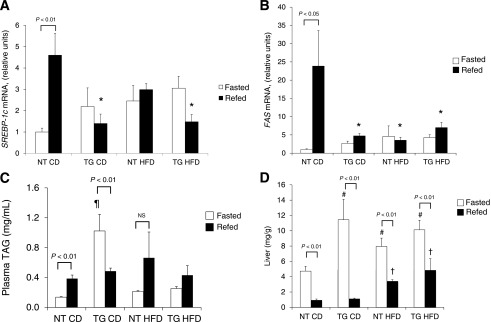
Hepatic lipid metabolism during fasting and refeeding from NT and hGLUT4 TG mice fed CD or HFD for 8 weeks. Livers were removed from mice fasted for 17 h (Fasted) or fasted mice refed for 4 h (Refed) after 8 weeks on the diet. Hepatic mRNA was isolated and analyzed for SREBP-1c mRNA (A) and FAS mRNA (B) (four independent experiments). Lipid-soluble material was isolated from blood plasma (n = 5 per group) (C) and liver homogenates (D) and assayed for total TAG level (n = 5 per group). Statistical differences between fasted and refed mice are indicated. *Significant difference in refed mice between strains and diets, ¶significant difference in fasted animals when comparing both strains and diets, #significant difference in fasted animals when comparing the same diet in different strains, and †significant difference in refed animals when comparing the same strain. NS, not significant.
Fasting plasma TAG levels were higher in hGLUT4 TG mice than in NT mice fed CD (Fig. 6C). HFD did not alter fasting plasma TAG levels in NT mice; however, HFD significantly reduced fasting plasma TAG levels in hGLUT4 TG (Fig. 6C).
Refed plasma TAG levels were similar in all four groups of mice (Fig. 6C). In the transition from fasted to fed, hGLUT4 TG mice had a significant decrease in plasma TAG levels, whereas this transition led to an increase in TAG levels in NT mice (Fig. 6C). This strain-dependent change in plasma TAG levels from fasting to refeeding may reflect the relative hypoinsulinemia present in the hGLUT4 TG mice fed CD. When fed HFD, both strains showed no significant change in plasma TAG levels in the transition from fasting to refeeding.
The liver TAG levels were subject to the expected temporal changes in the transition from the fasted to the refed state. In all cases, fasted liver TAG levels were significantly higher than that in refed liver (Fig. 6D). In all cases, refeeding lowered the liver TAG content; however, both strains had significantly higher fed liver TAG levels when fed HFD. Fasted liver TAG levels were significantly higher in hGLUT4 TG mice fed CD than in NT mice fed the same diet. When fed HFD, both strains had significantly elevated fasting liver TAG levels in the fasted state than NT mice fed CD.
DISCUSSION
HOMA-IR measurements revealed that hGLUT4 TG mice remained relatively insulin sensitive after 8 weeks on HFD, although the insulin sensitivity was slightly decreased compared with transgenic mice fed CD over the same time period. The HOMA-IR score for hGLUT4 TG mice fed HFD stayed within the range of scores for NT mice fed CD, indicating that the moderate overexpression of GLUT4 was sufficient to reduce hyperinsulinemia and hyperglycemia.
GLUT4 is known to play a major role in regulating insulin-mediated glucose homeostasis in normal physiology. Targeted and whole-body genetic manipulation of GLUT4 levels demonstrate that GLUT4 is limiting for glucose uptake and use in skeletal muscle and adipose tissue (4,6,12,21,30,31). Changes in GLUT4 expression in adipose tissue and insulin-dependent GLUT4 translocation in skeletal muscle in models of insulin deficiency and insulin resistance imply a role for GLUT4 in the pathogenesis of insulin-resistant metabolic diseases (7,9,18,32). Taken together, the current study shows that loss of GLUT4 at the cell surface in response to insulin (either through decreased expression or decreased translocation) is correlated with insulin resistance.
Transgenic overexpression of GLUT4 under the control of either the native promoter or a tissue-specific heterologous promoter leads to enhanced insulin sensitivity, enhanced glucose clearance, and some protection against insulin resistance. These observations have led many authors to conclude that upregulating glucose transporters may be an effective approach for the treatment of human type 2 diabetes (11,20,33–36). This notion was initially challenged by the observation that transgenic expression of human GLUT4 under the control of its own promoter enhances insulin sensitivity in chow-fed mice but at the same time, significantly increased serum TAG, free fatty acid, and ketone levels (6). Similarly, transgenic expression in adipose tissue, under the control of the aP2 promoter, also had increased serum TAG and free fatty acid levels (37). In the current study, we demonstrate that when stressed with an HFD, mild overexpression of GLUT4 under the control of a dynamic human GLUT4 promoter protects against insulin resistance and results in plasma TAG levels in the fasted and refed state that are indistinguishable between hGLUT4 TG and NT mice. The elevated plasma TAG levels in the hGLUT4 TG mice fed CD likely were a result of reduced clearance of VLDL particles as a result of the unusually low plasma insulin levels. Chronically low plasma insulin levels may reduce adipose and muscle lipoprotein lipase activity as well as VLDL receptor number (38,39). When fed HFD, both strains developed plasma TAG levels that were indistinguishable between strains. More importantly, under HFD, the difference between fasted and refed plasma TAG levels was no longer statistically significant. The loss of regulation appeared to result from a trend toward increased fasting plasma TAG levels, which may reflect insulin-resistant lipoprotein lipase activity associated with diet-induced obesity (40).
Despite very low HOMA-IR scores, moderate overexpression of GLUT4 may not completely prevent the metabolic adaptations to an HFD. Although hGLUT4 TG animals remained relatively insulin sensitive, changes in adipose GLUT4 gene expression and the changes in hepatic gluconeogenic gene expression were consistent with expected adaptations to an obesogenic diet (41,42). Because the HFD-dependent changes in gluconeogenic gene expression were not correlated with the pyruvate tolerance test (hGLUT4 TG mice remained highly pyruvate tolerant), it is likely that enhanced insulin sensitivity was a result of increased peripheral glucose uptake, presumably in skeletal muscle. This finding is consistent with hyperinsulinemic clamp studies performed on hGLUT4 TG mice fed the obesogenic Surwit diet (34). After 8 weeks on HFD, the HOMA-IR score for hGLUT4 TG mice was increased compared with hGLUT4 TG mice fed CD. This slight increase in HOMA-IR may be a reflection of decreased GLUT4 expression in adipose tissue (Fig. 4A) or of potential diet-dependent changes in GLUT4 abundance at the cell surface of skeletal muscle.
The current data reveal that HFD-dependent altered gene expression in both adipose tissue and liver occurred independently of the magnitude of changes in HOMA-IR. For example, the changes in GLUT4 expression in adipose tissue decreased to a similar extent in NT and hGLUT4 TG mice, even though the HOMA-IR scores were different (Figs. 1 and 4B). The changes in gene expression were also not a result of changes in fed insulin levels because these values were not statistically different between groups. The changes may be a result of either the diet composition or the changes in counter-regulatory hormone action (Fig. 5E).
It is unclear whether the changes in adipose and liver gene expression cause the change in HOMA-IR or are a result of changes in insulin sensitivity. The changes in GLUT4 gene expression in adipose tissue correlated with loss of regulation of the gluconeogenic gene expression. The possibility of coordinated regulation of GLUT4 in adipose tissue and gluconeogenic gene expression in liver is reinforced by the recent demonstration that downregulation of GLUT4 in WAT and upregulation of gluconeogenic genes are both under the control of class II HDAC proteins (42,43).
Although the gluconeogenic gene expression followed predictable patterns for the development of hepatic insulin resistance, the changes in lipogenic gene expression were more complicated. The presence of the human GLUT4 transgene altered the expression pattern of SREBP-1c and FAS mRNA under fasted and refed conditions, regardless of the diet regimen (Fig. 6A). Normally, SREBP-1c and FAS mRNA expression is increased in refed animals as a result of insulin signaling in the liver (41); however, the increased nuclear phospho-CREB (Fig. 5E) may be responsible for inhibiting the response to refeeding (44). The presence of the human GLUT4 transgene prevented the normal induction of SREBP-1c and FAS expression, suggesting that normal lipogenesis is altered in the transgenic animals. It is likely that de novo fatty acid synthesis is lower in hGLUT4 TG mice fed both CD and HFD.
Plasma and hepatic TAG levels in fasted hGLUT4 TG mice fed CD were significantly higher than in all other groups, which is most likely a result of enhanced lipid release from adipose tissue and enhanced VLDL secretion from the fasting liver because of hypoinsulinemia (45). These lipid abnormalities were corrected by HFD in the transgenic mice, reinforcing the notion that relative fasting hypoinsulinemia is the cause of the dyslipidemia.
Diet-induced obesity resulted in a small decrease in GLUT4 expression in BAT and skeletal muscle compared with WAT in both hGLUT4 TG and NT mice. It is likely, then, that elevated GLUT4 expression in skeletal muscle and BAT are responsible for enhanced insulin sensitivity in the hGLUT4 TG mice fed HFD. In addition to increased insulin sensitivity, the hGLUT4 TG animals fed HFD ate 10% more kilocalories but had no significant difference in body composition, suggesting that energy output through either increased activity or uncoupled cellular respiration was higher in the transgenic mice. The latter explanation is plausible because UCP-1 mRNA was lower in NT mice fed HFD than in hGLUT4 TG mice (Fig. 3).
The reason for enhanced food intake in hGLUT4 TG mice fed HFD compared with NT mice is not clear. Regulation of food is complex and may be related to changes in circulating factors or to expression of the transgene in GLUT4-expressing neurons. For example, the plasma leptin levels in the obese transgenic mice were significantly lower than in the obese NT mice. The decrease in leptin is most likely a result of the enhanced insulin sensitivity and generally lower plasma insulin levels in the transgenic mice (46).
In summary, moderate overexpression of GLUT4 is protective against hyperinsulinemia and hyperglycemia in transgenic mice with diet-induced obesity. The level of overexpression is similar to the level of overexpression that might be attained by long-term exercise, which gives a direction to pursue for therapeutic intervention. GLUT4 overexpression does not prevent all metabolic adaptations to an obesogenic diet, particularly loss of regulation of hepatic gluconeogenic gene expression. On the other hand, the increased glucose flux through skeletal muscle may limit availability of glucose in liver to be used for de novo fatty acid synthesis. This possibility is predicted by the loss of insulin-dependent SREBP-1c and FAS mRNA expression in the transgenic mice. The results of the current study strongly support that increased expression of GLUT4, particularly in skeletal muscle, is a relevant target for treatment of insulin-resistant metabolic disorders.
ACKNOWLEDGMENTS
This work was supported by a grant from the National Institutes of Health (DK-081545).
No potential conflicts of interest relevant to this article were reported.
B.J.A. researched data and wrote the manuscript. B.A.G., C.D.K., and M.A.J. researched data. A.L.O. researched data and reviewed and edited the manuscript. A.L.O. is the guarantor of this work and, as such, had full access to all the data in the study and takes responsibility for the integrity of the data and the accuracy of the data analysis.
REFERENCES
- 1.Ikemoto S, Thompson KS, Itakura H, Lane MD, Ezaki O. Expression of an insulin-responsive glucose transporter (GLUT4) minigene in transgenic mice: effect of exercise and role in glucose homeostasis. Proc Natl Acad Sci U S A 1995;92:865–869 [DOI] [PMC free article] [PubMed] [Google Scholar]
- 2.Ivy JL, Kuo CH. Regulation of GLUT4 protein and glycogen synthase during muscle glycogen synthesis after exercise. Acta Physiol Scand 1998;162:295–304 [DOI] [PubMed] [Google Scholar]
- 3.Deems RO, Evans JL, Deacon RW, et al. Expression of human GLUT4 in mice results in increased insulin action. Diabetologia 1994;37:1097–1104 [DOI] [PubMed] [Google Scholar]
- 4.Liu M-L, Gibbs EM, McCoid SC, et al. Transgenic mice expressing the human GLUT4/muscle-fat facilitative glucose transporter protein exhibit efficient glycemic control. Proc Natl Acad Sci U S A 1993;90:11346–11350 [DOI] [PMC free article] [PubMed] [Google Scholar]
- 5.Ranalletta M, Du XQ, Seki Y, et al. Hepatic response to restoration of GLUT4 in skeletal muscle of GLUT4 null mice. Am J Physiol Endocrinol Metab 2007;293:E1178–E1187 [DOI] [PubMed] [Google Scholar]
- 6.Treadway JL, Hargrove DM, Nardone NA, et al. Enhanced peripheral glucose utilization in transgenic mice expressing the human GLUT4 gene. J Biol Chem 1994;269:29956–29961 [PubMed] [Google Scholar]
- 7.Berger J, Biswas C, Vicario PP, Strout HV, Saperstein R, Pilch PF. Decreased expression of the insulin-responsive glucose transporter in diabetes and fasting. Nature 1989;340:70–72 [DOI] [PubMed] [Google Scholar]
- 8.Cushman SW, Wardzala LJ. Potential mechanism of insulin action on glucose transport in the isolated rat adipose cell. Apparent translocation of intracellular transport systems to the plasma membrane. J Biol Chem 1980;255:4758–4762 [PubMed] [Google Scholar]
- 9.Sivitz WI, DeSautel SL, Kayano T, Bell GI, Pessin JE. Regulation of glucose transporter messenger RNA in insulin-deficient states. Nature 1989;340:72–74 [DOI] [PubMed] [Google Scholar]
- 10.Garvey WT, Maianu L, Huecksteadt TP, Birnbaum MJ, Molina JM, Ciaraldi TP. Pretranslational suppression of a glucose transporter protein causes insulin resistance in adipocytes from patients with non-insulin-dependent diabetes mellitus and obesity. J Clin Invest 1991;87:1072–1081 [DOI] [PMC free article] [PubMed] [Google Scholar]
- 11.Ikemoto S, Thompson KS, Takahashi M, Itakura H, Lane MD, Ezaki O. High fat diet-induced hyperglycemic: prevention by low level expression of a glucose transporter (GLUT4) minigene in transgenic mice. Proc Natl Acad Sci U S A 1995;92:3096–3099 [DOI] [PMC free article] [PubMed] [Google Scholar]
- 12.Abel ED, Peroni OD, Kim JK, et al. Adipose-selective targeting of the GLUT4 gene impairs insulin action in muscle and liver. Nature 2001;409:729–733 [DOI] [PubMed] [Google Scholar]
- 13.Gnudi L, Tozzo E, Shepherd PR, Bliss JL, Kahn BB. High level overexpression of glucose transporter-4 driven by an adipose-specific promoter is maintained in transgenic mice on a high fat diet, but does not prevent impaired glucose tolerance. Endocrinology 1995;136:995–1002 [DOI] [PubMed] [Google Scholar]
- 14.DeFronzo RA, Jacot E, Jequier E, Maeder E, Wahren J, Felber JP. The effect of insulin on the disposal of intravenous glucose. Results from indirect calorimetry and hepatic and femoral venous catheterization. Diabetes 1981;30:1000–1007 [DOI] [PubMed] [Google Scholar]
- 15.Hollenbeck CB, Chen YD, Reaven GM. A comparison of the relative effects of obesity and non-insulin-dependent diabetes mellitus on in vivo insulin-stimulated glucose utilization. Diabetes 1984;33:622–626 [DOI] [PubMed] [Google Scholar]
- 16.Pendergrass M, Bertoldo A, Bonadonna R, et al. Muscle glucose transport and phosphorylation in type 2 diabetic, obese nondiabetic, and genetically predisposed individuals. Am J Physiol Endocrinol Metab 2007;292:E92–E100 [DOI] [PubMed] [Google Scholar]
- 17.Kahn BB. Dietary regulation of glucose transporter gene expression: tissue specific effects in adipose cells and muscle. J Nutr 1994;124(Suppl.):1289S–1295S [DOI] [PubMed] [Google Scholar]
- 18.Hansen PA, Han DH, Marshall BA, et al. A high fat diet impairs stimulation of glucose transport in muscle. Functional evaluation of potential mechanisms. J Biol Chem 1998;273:26157–26163 [DOI] [PubMed] [Google Scholar]
- 19.Kampmann U, Christensen B, Nielsen TS, et al. GLUT4 and UBC9 protein expression is reduced in muscle from type 2 diabetic patients with severe insulin resistance. PLoS ONE 2011;6:e27854–e27860 [DOI] [PMC free article] [PubMed] [Google Scholar]
- 20.Leturque A, Loizeau M, Vaulont S, Salminen M, Girard J. Improvement of insulin action in diabetic transgenic mice selectively overexpressing GLUT4 in skeletal muscle. Diabetes 1996;45:23–27 [DOI] [PubMed] [Google Scholar]
- 21.Tsao TS, Burcelin R, Katz EB, Huang L, Charron MJ. Enhanced insulin action due to targeted GLUT4 overexpression exclusively in muscle. Diabetes 1996;45:28–36 [DOI] [PubMed] [Google Scholar]
- 22.Zisman A, Peroni OD, Abel ED, et al. Targeted disruption of the glucose transporter 4 selectively in muscle causes insulin resistance and glucose intolerance. Nat Med 2000;6:924–928 [DOI] [PubMed] [Google Scholar]
- 23.Accili D. Lilly lecture 2003: the struggle for mastery in insulin action: from triumvirate to republic. Diabetes 2004;53:1633–1642 [DOI] [PubMed] [Google Scholar]
- 24.Olson AL, Liu M-L, Moye-Rowley WS, Buse JB, Bell GI, Pessin JE. Hormonal/metabolic regulation of the human GLUT4/muscle-fat facilitative glucose transporter gene in transgenic mice. J Biol Chem 1993;268:9839–9846 [PubMed] [Google Scholar]
- 25.Ezaki O, Higuchi M, Nakatsuka H, Kawanaka K, Itakura H. Exercise training increases glucose transporter content in skeletal muscles more efficiently from aged obese rats than young lean rats. Diabetes 1992;41:920–926 [DOI] [PubMed] [Google Scholar]
- 26.Goodyear LJ, Hirshman MF, Valyou PM, Horton ES. Glucose transporter number, function, and subcellular distribution in rat skeletal muscle after exercise training. Diabetes 1992;41:1091–1099 [DOI] [PubMed] [Google Scholar]
- 27.Olson AL, Pessin JE. Transcriptional regulation of the human GLUT4 gene promoter in diabetic transgenic mice. J Biol Chem 1995;270:23491–23495 [DOI] [PubMed] [Google Scholar]
- 28.Thai MV, Guruswamy S, Cao KT, Pessin JE, Olson AL. Myocyte enhancer factor 2 (MEF2)-binding site is required for GLUT4 gene expression in transgenic mice. Regulation of MEF2 DNA binding activity in insulin-deficient diabetes. J Biol Chem 1998;273:14285–14292 [DOI] [PubMed] [Google Scholar]
- 29.Shimomura I, Matsuda M, Hammer RE, Bashmakov Y, Brown MS, Goldstein JL. Decreased IRS-2 and increased SREBP-1c lead to mixed insulin resistance and sensitivity in livers of lipodystrophic and ob/ob mice. Mol Cell 2000;6:77–86 [PubMed] [Google Scholar]
- 30.Kotani K, Peroni OD, Minokoshi Y, Boss O, Kahn BB. GLUT4 glucose transporter deficiency increases hepatic lipid production and peripheral lipid utilization. J Clin Invest 2004;114:1666–1675 [DOI] [PMC free article] [PubMed] [Google Scholar]
- 31.Shepherd PR, Gnudi L, Tozzo E, Yang H, Leach F, Kahn BB. Adipose cell hyperplasia and enhanced glucose disposal in transgenic mice overexpressing GLUT4 selectively in adipose tissue. J Biol Chem 1993;268:22243–22246 [PubMed] [Google Scholar]
- 32.Richardson JM, Balon TW, Treadway JL, Pessin JE. Differential regulation of glucose transporter activity and expression in red and white skeletal muscle. J Biol Chem 1991;266:12690–12694 [PubMed] [Google Scholar]
- 33.Brozinick JT, Jr, McCoid SC, Reynolds TH, et al. GLUT4 overexpression in db/db mice dose-dependently ameliorates diabetes but is not a lifelong cure. Diabetes 2001;50:593–600 [DOI] [PubMed] [Google Scholar]
- 34.Marshall BA, Hansen PA, Ensor NJ, Ogden MA, Mueckler M. GLUT-1 or GLUT-4 transgenes in obese mice improve glucose tolerance but do not prevent insulin resistance. Am J Physiol 1999;276:E390–E400 [DOI] [PubMed] [Google Scholar]
- 35.Semeniuk LM, Kryski AJ, Severson DL. Echocardiographic assessment of cardiac function in diabetic db/db and transgenic db/db-hGLUT4 mice. Am J Physiol Heart Circ Physiol 2002;283:H976–H982 [DOI] [PubMed] [Google Scholar]
- 36.Tozzo E, Gnudi L, Kahn BB. Amelioration of insulin resistance in streptozotocin diabetic mice by transgenic overexpression of GLUT4 driven by an adipose-specific promoter. Endocrinology 1997;138:1604–1611 [DOI] [PubMed] [Google Scholar]
- 37.Gnudi L, Jensen DR, Tozzo E, Eckel RH, Kahn BB. Adipose-specific overexpression of GLUT-4 in transgenic mice alters lipoprotein lipase activity. Am J Physiol 1996;270:R785–R792 [DOI] [PubMed] [Google Scholar]
- 38.Iwasaki T, Takahashi S, Takahashi M, et al. Deficiency of the very low-density lipoprotein (VLDL) receptors in streptozotocin-induced diabetic rats: Insulin dependency of the VLDL receptor. Endocrinology 2005;146:3286–3294 [DOI] [PubMed] [Google Scholar]
- 39.Rauramaa R, Kuusela P, Hietanen E. Adipose, muscle and lung tissue lipoprotein lipase activities in young streptozotocin treated rats. Horm Metab Res 1980;12:591–595 [DOI] [PubMed] [Google Scholar]
- 40.Picard F, Boivin A, Lalonde J, Deshaies Y. Resistance of adipose tissue lipoprotein lipase to insulin action in rats fed an obesity-promoting diet. Am J Physiol Endocrinol Metab 2002;282:E412–E418 [DOI] [PubMed] [Google Scholar]
- 41.Li S, Brown MS, Goldstein JL. Bifurcation of insulin signaling pathway in rat liver: mTORC1 required for stimulation of lipogenesis, but not inhibition of gluconeogenesis. Proc Natl Acad Sci U S A 2010;107:3441–3446 [DOI] [PMC free article] [PubMed] [Google Scholar]
- 42.Weems JC, Griesel BA, Olson AL. Class II histone deacetylases downregulate GLUT4 transcription in response to increased cAMP signaling in cultured adipocytes and fasting mice. Diabetes 2012;61:1404–1414 [DOI] [PMC free article] [PubMed] [Google Scholar]
- 43.Mihaylova MM, Vasquez DS, Ravnskjaer K, et al. Class IIa histone deacetylases are hormone-activated regulators of FOXO and mammalian glucose homeostasis. Cell 2011;145:607–621 [DOI] [PMC free article] [PubMed] [Google Scholar]
- 44.Yamamoto R, Shimano H, Inoue N, et al. Protein kinase A suppresses sterol regulatory element-binding protein-1C via phosphorylation of liver X receptor in the liver. J Biol Chem 2007;282:11687–11695 [DOI] [PubMed] [Google Scholar]
- 45.Sparks JD, Sparks CE. Insulin regulation of triacylglycerol-rich lipoprotein synthesis and secretion. Biochim Biophys Acta 1994;1215:9–32 [DOI] [PubMed] [Google Scholar]
- 46.Bradley RL, Cheatham B. Regulation of ob gene expression and leptin secretion by insulin and dexamethasone in rate adipocytes. Diabetes 1996;48:272–278 [DOI] [PubMed] [Google Scholar]