

Abstract
Approximately 70% of women with polycystic ovary syndrome (PCOS) have intrinsic insulin resistance (IR) above and beyond that associated with body mass, including dysfunctional glucose metabolism in adipose tissue (AT). In AT, analysis of the IRS/PI3-K/AKT pathway signaling components identified only GLUT4 expression to be significantly lower in PCOS patients and in control subjects with IR. We examined the role of miRNAs, particularly in the regulation of GLUT4, the insulin-sensitive glucose transporter, in the AT of PCOS and matched control subjects. PCOS AT was determined to have a differentially expressed miRNA profile, including upregulated miR-93, -133, and -223. GLUT4 is a highly predicted target for miR-93, while miR-133 and miR-223 have been demonstrated to regulate GLUT4 expression in cardiomyocytes. Expression of miR-93 revealed a strong correlation between the homeostasis model assessment of IR in vivo values and GLUT4 and miR-93 but not miR-133 and -223 expression in human AT. Overexpression of miR-93 resulted in downregulation of GLUT4 gene expression in adipocytes through direct targeting of the GLUT4 3′UTR, while inhibition of miR-93 activity led to increased GLUT4 expression. These results point to a novel mechanism for regulating insulin-stimulated glucose uptake via miR-93 and demonstrate upregulated miR-93 expression in all PCOS, and in non-PCOS women with IR, possibly accounting for the IR of the syndrome. In contrast, miR-133 and miR-223 may have a different, although yet to be defined, role in the IR of PCOS.
Polycystic ovary syndrome (PCOS) is one of the most common endocrine disorders and affects ≥7–9% of reproductive-aged women (1). Sixty to seventy percent of PCOS patients demonstrate insulin resistance (IR) above and beyond that predicted by body mass, race, or age (2), resulting in compensatory hyperinsulinemia (3) and an increased risk for type 2 diabetes mellitus (T2DM) and cardiovascular disease (4,5).
The underlying cellular mechanisms leading to IR in PCOS remain unclear. Subcutaneous adipocyte functions, including the stimulation of glucose transport (4,6), GLUT4 production (7), and lipolysis (8,9), appear to be defective in the disorder (10–12). However, no defects in insulin signaling have been found; including insulin binding, insulin receptor expression, and the insulin receptor substrate (IRS)-1/phosphatidylinositol 3-kinase (PI3K)/AKT pathway (13).
Epigenetic regulation may influence PCOS-related IR. Although we have previously reported no significant difference in whole DNA methylation in PCOS versus control subjects (14), the role of microRNA (miRNA) regulation in PCOS is unknown. miRNAs are short (20–24 nucleotides) noncoding RNAs involved in posttranscriptional regulation of gene expression. miRNAs are known to influence many cellular functions including glucose and lipid metabolism (15–19). Insulin-resistant adipocytes are also known to contain a differentially expressed miRNA profile (20).
GLUT4 is the major protein responsible for insulin-mediated glucose translocation into adipocytes (21) and plays an important role in glucose homeostasis, as a 50% decrease in GLUT4 leads to a 50% decrease in GLUT4 translocation in adipocytes (22). Moreover, adipose tissue (AT)-specific GLUT4 regulates glucose tolerance, insulin sensitivity, and glucose metabolism (23,24). In addition, miRNAs have been demonstrated to alter insulin-mediated glucose uptake by regulating GLUT4 expression in cardiomyocytes. miR-133 was determined to regulate the expression of GLUT4 by targeting KLF15 in cardiomyocytes (25), and miR-223 overexpression in cardiomyocytes increases GLUT4 expression and improves glucose uptake (26).
GLUT4 protein expression is decreased in adipocytes of patients with PCOS (7) and type 2 diabetes (27–29). Thus, the loss of GLUT4 in the adipocytes may be a significant contributor to the IR in PCOS patients. In the current study, we tested the hypothesis that GLUT4 dysregulation plays a central role in IR in PCOS and that miRNAs related to the regulation of GLUT4 are abnormally expressed in the AT of women with PCOS, potentially denoting a primary defect in AT function in this disorder. Our findings demonstrate that PCOS women have significantly lower GLUT4 expression in AT and abnormal AT expression of miRNAs involved in glucose metabolism, reproduction and infertility, and lipid metabolism. Additionally, miR-93 was upregulated in the AT of PCOS patients, and miR-93 overexpression decreased GLUT4 expression, thereby contributing to IR. Interestingly, miR-93 is overexpressed in PCOS patients with and without IR and in control patients with IR, suggesting that this mechanism is operant in IR in general and in PCOS. These findings improve our understanding of the mechanisms underlying IR in other metabolic disorders.
RESEARCH DESIGN AND METHODS
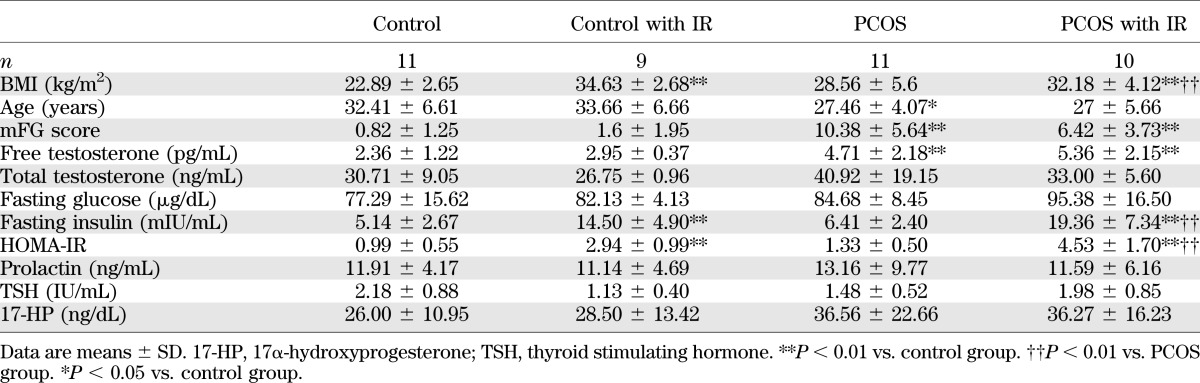
Forty-one subjects (20 control and 21 PCOS) were recruited for this study (Table 1). All subjects underwent a brief physical examination, including assessment for hirsutism using the modified Ferriman-Gallwey (mFG) hirsutism scoring system (30). No subjects had used hormonal preparations, including oral contraceptives, for ≥3 months preceding the study, and none were pregnant. All subjects had normal thyroid-stimulating hormone and prolactin levels.
TABLE 1.
Clinical characteristics of PCOS and control subjects
The diagnosis of PCOS was made according to the National Institutes of Health 1990 criteria (31): 1) clinical evidence of hyperandrogenism (mFG score ≥6) or hyperandrogenemia, 2) oligo-ovulation, and 3) the exclusion of related disorders. The criteria for defining hirsutism, hyperandrogenemia, ovulatory dysfunction, and exclusion of related disorders have previously been reported (31). Control subjects were healthy (mFG ≤3) women without hirsutism and on no medications, who had predictable regular menstrual cycles.
Fasting blood sampling was performed in cycle days 3 and 8 (follicular phase) after a spontaneous menstrual cycle or a progesterone-induced withdrawal bleed. IR was estimated using homeostasis model assessment of IR (HOMA-IR) (32). All subjects gave informed written consent, according to the guidelines of the institutional review board.
Adipocyte culture, real-time PCR, Western blot, and immunofluorescence.
Approximately 5 g tissue was excised from subcutaneous AT through a small incision in the lower abdomen (http://www.youtube.com/fatbx [33]). Specimens were processed and cultured as previously described (34).
Independent validation of miRNA by quantitative PCR (details in Supplementary Data) was performed on separate samples from nonobese PCOS subjects (n = 7) and BMI-matched control subjects (n = 8). Primers for human ACTB (internal control) and GLUT4 were purchased from SABioscience (Frederick, MD). Primers for mature miRNAs and mouse Actb and Glut4 were purchased from OriGene (Rockville, MD). miR-103 was used as an internal control (35). Relative fold change of mRNA and miRNA expression of targeted genes and miRNA were calculated by using the ΔΔCt method.
For Western blot analysis, 30 μg protein from adipocyte lysates was used. Blots were probed with specific primary antibodies and appropriate secondary antibodies (Jackson ImmunoResearch Laboratory, West Grove, PA). β-Actin was used as a loading control. GLUT4 antibody was purchased from Abcam, Cambridge, MA.
Immunofluorescence was performed as previously described (34). The samples were incubated with GLUT4 antibodies (Cell Signaling Tech, Danvers, MA). The secondary antibody was Alexa Fluor 568 (Invitrogen, Carlsbad, CA). Image analysis was performed using Image J software (36).
miRNA microarray and in silico studies: computational targeted gene predictions of PCOS-related miRNA and miR-93.
AT was collected from nonobese PCOS and matched control subjects (n = 3 for each group). Total RNA was extracted with the miRACLE Isolation kit (Jinfiniti Biosciences, Augusta, GA), and arrays were performed and analyzed by the Integrated Genomics Core of the Georgia Regents University Cancer Center. miRNA microarrays were performed using the GeneChip miRNA 2.0 Array (Affymetrix, Santa Clara, CA). Analysis was performed with Ingenuity Pathway Analysis software. Differentially expressed miRNA were defined as having a P < 0.05.
Sequences for miRNA were obtained from the miRNA database, miRBase (Faculty of Life Sciences, University of Manchester). Additional miRNA databases with target gene prediction (miRanda, miRTar, PicTar, and TargetScan) were used to find potential targets sites for miR-93 (37–40). RNAhybrid software (41) was used to predict the resulting secondary structure formed by interacting mRNA and miRNA.
Overexpression and inhibition of miR-93.
miR-93 overexpression (human cat. no. SC400685 and mouse SC401248), human miR-155 overexpression (SC400793), and empty (PCMVMIR) vectors were purchased from OriGene (Rockville, MD). All vectors contain green fluorescent protein as a reporter for transfection monitoring. An miR-93 inhibitor, antisense miR-93 (mirVana miRNA inhibitor, has-miR-93, cat. no. 4464084), and a scrambled control (mirVana miRNA inhibitor, negative control no. 1, cat. no. 4464076) were purchase from Ambion (Grand Island, NY). MegaTran 1.0 (cat. no. T200002; OriGene, Rockville, MD) reagent and Lipofectamine RNAiMAX reagent (cat. no. 13778–100; Life Technologies, Carlsbad, CA) were used for vectors and inhibitors in vitro transfections (details in Supplementary Data). Most assays were done at 48 h posttransfection. The transfection efficiency of vectors in adipocytes was ≥70% (74% in human differentiated adipocytes and 75% in 3T3-L1 adipocytes (Supplementary Fig. 1)
Luciferase reporter assay.
GLUT4 3′untranslated region (UTR) luciferase plasmid was purchased from OriGene (Rockville, MD). The 3′UTR luciferase plasmid (0.5 μg) with either miR-93 overexpression or empty plasmid (1.5 μg) was transfected in each well of a sixwell plate. Forty-eight hours after transfection, luciferase activity was assayed by a luciferase assay system (Promega, Madison, WI) measured on a fluorescence microplate reader (POLARstar Omega; BMG Labtech, Ortenberg, Germany).
Statistical analysis.
Significant differences were inferred when P < 0.05. Comparisons of multiple groups were carried out by ANOVA followed by a Duncan multiple range test. The comparison of two groups with a normal distribution was accomplished using an unpaired Student t test. All values were presented as SEM. Due to limitations in the amount of AT isolated, not all subjects contributed to each of the experiments performed.
RESULTS
GLUT4 expression is downregulated in adipocytes from women with PCOS.
To explore the mechanisms underlying the IR of PCOS patients, we examined the classical insulin-signaling pathway in PCOS-derived adipocytes for potential signaling defects in a subpopulation of eight PCOS and eight matched control subjects (age 25.78 ± 3.59 vs. 33.63 ± 4.07 years; BMI 30.86 ± 5.44 vs. 27.40 ± 8.55 kg/m2, respectively). The PI3K pathway is a critical pathway involved in glucose transport and glycogen synthesis. Systematically comparing basal protein expression and stimulated phosphorylation of critical components of the IRS-1/PI3K/AKT pathway revealed no significant abnormality in PCOS adipocytes (Supplementary Fig. 2). These findings correlate with previous studies in both adipocytes and myocytes (6,8,13). All subsequent studies were done with the entire population of subjects stratified by degree of IR (Table 1).
In primary cell cultures, GLUT4 gene and protein expression (Fig. 1A and B) is significantly reduced in adipocytes from PCOS patients versus control subjects (P < 0.01). When stratified according to presence or absence of IR (Table 1), as determined by HOMA-IR (IR ≥2.5) and correlating closely with BMI, our data demonstrate reduced GLUT4 gene expression in primary adipocyte cultures in all PCOS patients and in those control/IR subjects (Fig. 1C). GLUT4 gene expression was lower in PCOS/IR than in PCOS without IR; this latter group had similar GLUT4 gene expression levels similar to those of control/IR subjects. Interestingly, control/IR and PCOS women without IR expressed similar, albeit reduced, levels of GLUT4. These data support the concept of inherent dysregulation of glucose metabolism in control/IR and in all PCOS women, which is worse in those patients with overt IR.
FIG. 1.
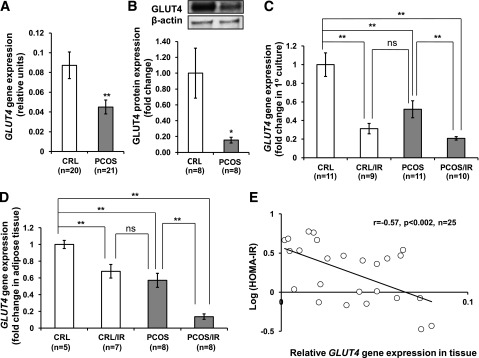
GLUT4 expression in adipocytes of PCOS patients. A: GLUT4 mRNA expression was significantly reduced in primary subcutaneous (sc) adipocyte culture derived from PCOS patients (n = 21) compared with matched control (CRL) subjects (n = 20). B: GLUT4 protein was also reduced in PCOS. C: Taking IR into account, significant differences are observed in GLUT4 expression between IR and non-IR groups in primary adipocyte culture. D: In whole AT, GLUT4 is significantly lower in PCOS and further reduced if the patient demonstrated IR. E: In ATs from all patients studied, GLUT4 gene expression was negatively correlated to HOMA-IR (r = −0.57, n = 25, P < 0.002). All data are shown as means ± SEM (error bars). *P < 0.05; **P < 0.01.
In contrast to primary adipocyte cultures, AT is a complex and heterogeneous tissue, consisting of not only adipocytes but also resident macrophages, preadipocytes, fibroblasts, adipose stem/progenitor cells, and endothelial cells (34). To determine whether expression is altered by this complex environment, we examined GLUT4 expression in whole AT. Overall, GLUT4 gene expression in AT correlated closely to that observed in primary adipocyte cultures (Fig. 1D). However, compared with adipocytes, AT demonstrated a greater reduction in GLUT4 gene expression in PCOS/IR versus control/IR subjects. Further analysis by HOMA-IR indicated a strong association between GLUT4 expression in whole AT and the degree of IR. In our subject population (n = 25), we found a significant association between higher HOMA-IR values and lower GLUT4 expression (P < 0.002), further underscoring the importance of AT GLUT4 expression in the development of IR (Fig. 1E).
Identification of miR-93 as a signature miRNA of PCOS.
For identification of differentially expressed miRNA, AT samples from 41 subjects, including 21 PCOS patients with and without IR and 20 BMI-matched control subjects, were studied. We first performed miRNA microarray analysis using AT from nonobese PCOS subjects (n = 3) and BMI/age-matched control subjects (n = 3) and then studied an additional independent sample of seven PCOS and eight matched control subjects to confirm the expression of specific miRNA genes by RT-qPCR.
Comparative miRNA array analysis determined 97 miRNA to be differentially expressed (P < 0.05) in PCOS, with changes of ≥1.5 fold (Supplementary Table 1). While only 10 miRNAs with twofold or greater change were specifically designated as human (Supplementary Table 2), many miRNA are highly conserved between species and often share identical mature strands (42). In line with known PCOS dysfunction, the top gene ontology networks associated with altered miRNA expression in PCOS included reproductive system dysfunction (n = 11) and genetic disorders (n = 14) (Supplementary Fig. 3B). Ingenuity Pathway Analysis software scored known miRNA associations; predicted target genes for these miRNA included insulin-signaling pathway molecules c-FOS, p38 mitogen-activated protein kinase, 17 β-estradiol, PI3K, β-catenin, and tumor necrosis factor-α (Supplementary Fig. 3C and D).
We confirmed differential expression by RT-qPCR (Supplementary Fig. 4) and developed a list of candidate genes for additional study (Supplementary Table 3). A particularly interesting candidate was miR-93, which was upregulated by ~twofold in PCOS AT (Supplementary Fig. 4). In silico analysis (algorithms miRanda, PicTar, and TargetScan [37–39]) was used to predict gene targets of miRNA observed to be differentially expressed in PCOS. A list of potential gene targets of miR-93 was generated (Supplementary Table 4), and all three algorithms predicted miR-93 to target GLUT4 (Fig. 2A).
FIG. 2.

In silico analysis predicts that miR-93 targets the GLUT4 gene. A: Venn diagram of miR-93 targets determined by 3′UTR target prediction software. Only 168 genes were predicted to be targets of miR-93 by all three programs, including GLUT4 (SLC2A4). B: Homology of both miR-93 and the GLUT4 3′UTR seeding region, highlighted in green, is highly conserved in mammals. C: miR-93 alignment with GLUT4 indicated that the mature miRNA strands seeding region (green), a key predictor of direct binding to the target gene, is perfect alignment between nucleotides 1–9. RNAhybrid analysis of GLUT4 3′UTR correlation offered further support to indicate direct binding. miR-93 (D) and miR-93* (E) both have highly favorable minimum free energy (mfe) scores of ΔG = −28.6 kcal/mol and ΔG = −32.8 kcal/mol, respectively.
GLUT4 expression was reduced in PCOS. We explored the predicted binding of miR-93 to the GLUT4 3′UTR. Both miR-93 and GLUT4 transcripts are highly conserved among mammals, and homology predicts that potential binding would be observed in primates and rodents, allowing for studies in mouse 3T3-L1 adipocytes (Fig. 2B). miR-93 alignment with GLUT4 indicated that the mature miRNA strands seeding region, a key predictor of direct binding to the target gene, had a site of perfect alignment between nucleotides 1–9 (Fig. 2C). RNA hybrid analysis of GLUT4 3′UTR offered further support for direct binding of both miR-93 and miR-93* (the pre-miRNA strand read from the 3′ direction) to the site; each predicted binding had highly favorable predicted minimum free energy scores of ΔG (Gibbs free energy) = −28.6 and −32.8 kcal/mol, respectively (Fig. 2D and E), consistent with known miRNA targeting (43). Therefore, we hypothesized that GLUT4 may serve as a target of miR-93.
miR-93 is overexpressed in PCOS and associated with decreased GLUT4 and increased IR.
In AT, miR-93 is significantly upregulated in all PCOS patients with or without IR. Additionally, expression was also increased in control patients with IR (Fig. 3A), similar to our findings regarding the suppression of GLUT4 expression in both primary adipocyte cultures and whole AT (Fig. 1C and D).
FIG. 3.
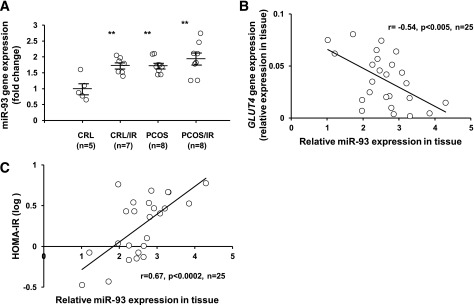
miR-93 is overexpressed in women with PCOS and associated with reduced GLUT4 and increased HOMA-IR. A: Observing miR-93 in the entire patient population, miR-93 is significantly increased in all PCOS ATs, as well as in control (CRL) subjects with IR (**P < 0.01 vs. control subjects). B: miR-93 is negatively correlated to GLUT4 expression in the AT from subjects studied (r = −0.54, n = 25, P < 0.005). C: miR-93 is correlated with HOMA-IR in the AT from subjects studied (r = 0.67, n = 25, P < 0.0002).
To support the notion that miR-93 expression could influence GLUT4 expression, AT samples from patients and control subjects were then studied to determine whether there was a correlation between increased miR-93 and reduced GLUT4 expression. Our finding in the population studied (n = 25) revealed that GLUT4 gene expression negatively correlated with miR-93 expression (P < 0.005) (Fig. 3B). Finally, we sought to investigate the possible association between miR-93 expression and IR in vivo. Analyzing the entire subject sample, we observed positive correlation between miR-93 expression and HOMA-IR (P < 0.0002) (Fig. 3C).
Interestingly two miRNAs, miR-133 and -223, which are already known to regulate GLUT4 expression in cardiomyocytes (25,26), were also overexpressed in PCOS ATs (Supplementary Tables 1 and 3). We further examined expression of these two miRNAs in our four subgroups; our results indicated that miR-223 and miR-133 were overexpressed only in PCOS/IR women (Supplementary Fig. 5), although neither miRNA demonstrated an association with GLUT4 expression or HOMA-IR values.
Induced overexpression of miR-93 directly inhibits GLUT4 expression, while inhibition of miR-93 increases GLUT4.
Differentiated human adipocytes were transfected with an miR-93 overexpression vector containing a green fluorescent protein reporter to produce a fold change that would be comparable with the observed increase of miR-93 in PCOS adipocytes (Supplementary Fig. 6A–C).
To determine whether miR-93 overexpression reduces GLUT4 protein production, Western blots were performed on cultured human adipocytes transfected with the miR-93 overexpression vector, as assessed by three independent experiments, and results indicated that miR-93 decreased GLUT4 expression significantly (Fig. 4A and B), whereas transfection of cells with miR-155, a control miRNA that was not predicted to target GLUT4, did not alter the expression of GLUT4 (Supplementary Fig. 7). Fig. 4C indicated that miR-93 vector transfection increased miR-93 expression by approximately twofold, which is comparable with the miR-93 levels observed in PCOS adipocytes. Additionally, immunofluorescence demonstrated an approximately threefold reduction in GLUT4 fluorescence intensity in adipocytes with induced miR-93 overexpression (Fig. 4D and E). In addition, miR-93 overexpression did not alter gene expression of miR-133 or miR-223 in human differentiated adipocytes (Supplementary Fig. 8).
FIG. 4.
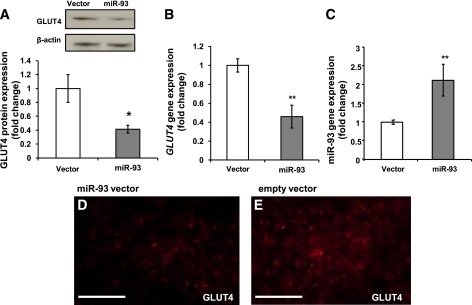
miR-93 represses GLUT4 in human adipocytes. Differentiated human adipocytes were transfected with miR-93 plasmid (2 μg) or empty vector. A: GLUT4 protein content was assessed in three independent experiments (P < 0.03). RT-qPCR assessed GLUT4 gene expression (B) and miR-93 gene expression (C) in human differentiated adipocytes transfected with miR-93 (P < 0.01). Results were obtained from three independent experiments. D and E: Protein expression of GLUT4 (red) was also assessed by immunofluorescence microscopy; scale bars are 300 μm.
miR-93 has also been reported to affect the phosphatase and tensin homolog (PTEN)/Akt pathway in ovarian cancer cells (44). Since miR-93 suppressed PTEN expression-induced phosphorylation of AKT, we also determined PTEN expression and AKT phosphorylation in our overexpression system (Supplementary Fig. 9). Our results indicated that overexpression of miR-93 did not alter PTEN expression or AKT phosphorylation in adipocytes.
In order to facilitate future molecular studies, we sought to determine whether murine Mus musculus (mmu)-miR-93 overexpression would show similar regulation in mouse-derived 3T3-L1 cells. Homology indicates that the predicted GLUT4 3′UTR binding site of miR-93 is highly conserved across mammalian species and is identical between humans and mice (Fig. 2B). Additionally, both human and mouse share identical sequence in miR-93 mature strands. As observed in human samples, transfection of the mmu-miR-93 in 3T3-L1 cells significantly increased expression, with transfection adjusted to produce an approximately twofold expression increase in miR-93 (which was the approximate fold change observed in PCOS women). Overexpression of miR-93 in 3T3-L1 adipocytes reduced Glut4 gene expression (Fig. 5A and B). Immunofluorescence confirmed that induction of miR-93 clearly diminished the expression of Glut4 protein content (Fig. 5C and D), demonstrating that miR-93 also regulates Glut4 in mouse 3T3-L1 adipocytes.
FIG. 5.
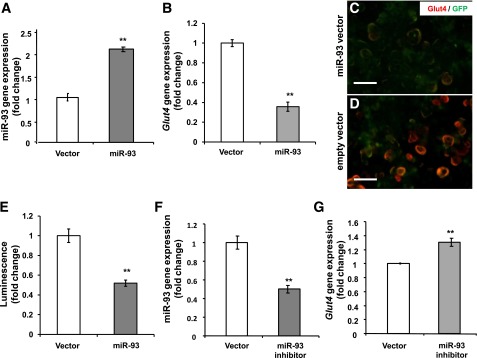
miR-93 targets Glut4 in 3T3-L1 adipocytes. Differentiated 3T3-L1 adipocytes were transfected with miR-93 plasmid (2 μg) or empty vector. 3T3-L1 adipocytes with induced miR-93 (A) have decreased Glut4 gene expression (B). C and D: Comparison of Glut4 (red) in 3T3-L1 adipocytes transfected with an GFP-miR-93 vector or empty vector (green) and expression of Glut4 (red); scale bars are 50 μm. E: Luciferase Glut4 3′UTR plasmid was cotransfected with either miR-93 or empty vector. Results were obtained from three independent experiments. F and G: miR-93 inhibition increases Glut4 gene expression in 3T3-L1 adipocytes.
To address whether direct binding of miR-93 to the Glut4 3′UTR is responsible for the observed suppression of Glut4, we performed a luciferase assay in which direct binding of miR-93 to the vector Glut4 3′UTR gene transcript would repress a luciferase reporter. Transient cotransfection of miR-93 and luciferase expression plasmids in 3T3-L1 adipocytes demonstrated direct binding of miR-93 to the Glut4 3′UTR, resulting in a significant reduction in luciferase (Fig. 5E). Finally, inhibition of miR-93 using an antisense miR-93 resulted in significant upregulation in Glut4 gene expression in 3T3-L1 adipocytes (Fig. 5E and F).
Taken together, these results indicate that when induced to expression ratios similar to those observed in PCOS, miR-93 in human- or mouse-derived 3T3-L1 adipocytes downregulates Glut4 expression to levels similar to those observed in the disorder through binding to the Glut4 3′UTR.
DISCUSSION
Our findings in this study demonstrate that miR-93, -133, and -223 are differentially expressed in PCOS, a condition often characterized by inherent IR that features decreased insulin-responsive GLUT4. We also demonstrate that miR-93 is overexpressed in PCOS patients and in control/IR subjects and that this overexpression is associated with decreased GLUT4 expression and increased HOMA-IR. GLUT4 is predicted to be a target of miR-93. We also demonstrated that the miR-93 transcript binds directly to the GLUT4 3′UTR to repress translation as well as cleave the mRNA, resulting in decreased GLUT4 protein and mRNA expression. Together, these data support miR-93, and possibly miR-133 and -223, as novel regulators of GLUT4 and contributors to IR in human, particularly PCOS, AT.
We first aimed to determine whether the inherent IR in PCOS adipocytes was due to dysfunction in the classical insulin-signaling IRS-1/PI3K/AKT pathways (Supplementary Fig. 2). However, in human subcutaneous AT excised from the lower abdomen, analysis of the IRS/PI3K/AKT pathway signaling components identified only GLUT4 expression to be significantly lower in PCOS patients and control/IR, consistent with the findings of other investigators in both skeletal muscle and AT (9,13,45,46). Decreased expression of GLUT4, the primary insulin-responsive glucose transporter, is associated with systemic IR in PCOS and other metabolic disorders (47), where decreased GLUT4 content results in decreased glucose translocation (22), reduced glucose tolerance, and lowered insulin sensitivity (23), while overexpression improves glucose metabolism (24).
GLUT4 content was greatly reduced in adipocytes from PCOS patients in accordance with the findings of Rosenbaum, Haber, and Dunaif (7). In contrast, Ciaraldi et al. (13) reported no difference in GLUT4 content between PCOS women and control subjects. However, of note, Ciaraldi and colleagues compared PCOS/IR patients with control/IR subjects, as both groups had a calculated average HOMA-IR of 3.22. The difference between the two studies is reconciled and illustrated clearly in Fig. 1D, where no significant difference was observed between control/IR women and PCOS. Taking the data together, these results suggest that the regulation of GLUT4 expression is a key molecular end point for IR in the AT of PCOS women.
Many biological mechanisms are regulated by miRNA (48,49), but no studies to date have investigated roles of miRNA in PCOS. Examining AT from PCOS patients with a lean phenotype allows for pathways (i.e., insulin signaling) to be studied without being masked by conditions associated with PCOS and concurrent obesity, such as the heightened IR found in PCOS women with high BMI. Many miRNAs were found to be differentially expressed in AT of lean PCOS women and many associated with pathways involving reproductive system dysfunction, insulin signaling, and lipid metabolism (Supplementary Fig. 3B-D). Similarly, miRNA profiles have been found to be differentially expressed in the AT of patients with T2DM and obesity (50,51), and miRNA, including miR-123, -143, and -144, appear to influence IR (52–54).
Confirmation with miRNA arrays and in silico analysis allowed for the generation of candidate miRNAs (Supplementary Table 3), including miR-93, -223, -21, -133, and -199. In particular, miR-93 was of interest because it was overexpressed in the AT of PCOS women and was predicted to target the GLUT4 3′UTR (Fig. 2A). Homology of both the miR-93 and the GLUT4 3′UTR seeding regions is highly conserved in mammals, and miR-93 and the GLUT4 3′UTR had a site of perfect alignment between nucleotides 1–9 (Fig. 2B and C). Perfect binding at the seeding region can result in the entire target mRNA being cleaved (55), resulting in a reduction of both protein translation and mRNA expression, which supports our observations (Fig. 1A and B).
Interestingly, tissue analysis demonstrates that while miR-93 is ubiquitously expressed in tissues, its expression is uniquely lowest in all insulin-responsive GLUT4-expressing tissues, including fat, muscle, and heart (56). Although each miRNA potentially regulates numerous proteins, this pattern of tissue expression implicates miR-93 as most tightly regulated in GLUT4-containing tissues, perhaps indicating that insulin-mediated glucose regulation is a central role for miR-93.
The expression of miR-93 was significantly increased in the subcutaneous lower abdominal AT of all PCOS women and control/IR subjects (Fig. 3A). Much like the relationship with intrinsic IR and reduced GLUT4, it appears that PCOS patients display an intrinsic overexpression of miR-93, regardless of BMI. A significant negative correlation was observed between GLUT4 expression and miR-93. Additionally, when all patients were included, a positive correlation between miR-93 and HOMA-IR was observed. Our results suggest that while miR-93 modulates insulin sensitivity via GLUT4 in all PCOS and control/IR subjects, there are potentially additional and unknown factors that further lower GLUT4 expression in PCOS/IR patients.
The precise regulation of miRNA expression is largely unknown; however, approximately one-half of conserved miRNA genetic information can be found within a host gene (57). The miR-106b/93/25 family is found within the intronic region of the MCM7 gene (58). Previous studies have all reported that miR-93 expression correlates to that of its host gene, MCM7 (59,60). Differences in the intensity of expression from that of family members miR-106b and miR-25, as well as the presence of an intronic region containing CpG islands, have lead to speculation that miR-93 may have its own promoter (60). Further studies will be necessary to determine whether miR-93 expression in adipocytes is regulated by MCM7 or if it has its own promoter.
In testing the hypothesis that miR-93 plays a direct role in regulating GLUT4 expression, we observed that human adipocytes transfected to overexpress miR-93 had reduced GLUT4 gene expression. Induction of miR-93 reduced GLUT4 protein and mRNA expression in human adipocytes, as well as in murine 3T3-L1 cells. This dual approach provided consistency to our results. The mature miR-93 and its predicted GLUT4 3′UTR binding site are highly conserved between mammalian species, as both human and mouse share identical sequences (Fig. 2B). In 3T3-L1 cells, direct binding of miR-93 to the Glut4 3′UTR was demonstrated by a luciferase assay. Consistent with the conclusion that miR-93 regulates Glut4, the use of a miR-93 inhibitor significantly increased Glut4 expression.
In addition to miR-93, previous studies demonstrated that miR-133 and miR-223 also regulate GLUT4 expression, at least in cardiomyocytes (25,26). Our results indicated that miR-223 and miR-133 were also overexpressed in PCOS/IR (Supplementary Fig. 5), but not in control/IR, subjects. The negative relationship between GLUT4 and miR-93 expression (Figs. 1 and 3) in AT from control/IR and in both PCOS with and without overt IR groups suggests that miR-93 may be involved in dysregulation of GLUT4 in these women. In contrast, miR-133 and miR-223 were not associated with GLUT4 expression. Our data also suggest that miR-93 may regulate GLUT4 in all PCOS subjects, and in control/IR subjects, whereas miR-133 and miR-223 may have a different and possibly additive, but as yet undefined, role in the IR of PCOS .
In summary, our study sought to determine the answer to a fundamental question of PCOS: why do 60–70% of afflicted women have intrinsic IR above and beyond that associated with BMI? We observed that the IR of both PCOS patients and control women is significantly correlated to decreased GLUT4 expression in adipocytes and demonstrated that miR-93 is capable of repressing GLUT4 expression. We also determined miR-93 to be overexpressed in PCOS AT and found that induced overexpression of miR-93 reduces GLUT4 expression. Finally, we observed that miR-93 is upregulated not just in PCOS but also in control subjects with IR, further suggesting that miR-93 may play a significant role in other IR-associated conditions such as T2DM and obesity. Finally, these findings may also have significant implications for the study of other metabolic disorders.
Supplementary Material
ACKNOWLEDGMENTS
This work was partially supported by National Institutes of Health Grant RO1-DK073632 (to R.A.). This work was also supported by an endowment from the Helping Hand of Los Angeles, Inc.
No potential conflicts of interest relevant to this article were reported.
Y.-H.C. designed the study, researched data, contributed to discussion, wrote the manuscript, and reviewed and edited the manuscript. S.H. researched data, contributed to discussion, wrote the manuscript, and reviewed and edited the manuscript. J.-M.L. researched data. L.C.L. contributed to discussion and reviewed and edited the manuscript. D.W.S. contributed to discussion. G.M.G. identified and phenotyped subjects and/or obtained study samples and researched data. B.-S.C. and G.C. researched data. R.A. designed the study, identified and phenotyped subjects and/or obtained study samples, researched data, wrote the manuscript, contributed to discussion, and reviewed and edited the manuscript. R.A. is the guarantor of this work and, as such, had full access to all the data in the study and takes responsibility for the integrity of the data and the accuracy of the data analysis.
The authors are thankful for the contribution of the PCOS patients and control subjects who participated in this study. The authors thank Dr. Jack Yu for assistance in providing materials for the development of laboratory techniques, and Dr. Michael Diamond for review and suggestions.
Footnotes
This article contains Supplementary Data online at http://diabetes.diabetesjournals.org/lookup/suppl/doi:10.2337/db12-0963/-/DC1.
REFERENCES
- 1.Azziz R, Sanchez LA, Knochenhauer ES, et al. Androgen excess in women: experience with over 1000 consecutive patients. J Clin Endocrinol Metab 2004;89:453–462 [DOI] [PubMed] [Google Scholar]
- 2.Azziz R, Carmina E, Dewailly D, et al. Task Force on the Phenotype of the Polycystic Ovary Syndrome of The Androgen Excess and PCOS Society The Androgen Excess and PCOS Society criteria for the polycystic ovary syndrome: the complete task force report. Fertil Steril 2009;91:456–488 [DOI] [PubMed] [Google Scholar]
- 3.Legro RS, Finegood D, Dunaif A. A fasting glucose to insulin ratio is a useful measure of insulin sensitivity in women with polycystic ovary syndrome. J Clin Endocrinol Metab 1998;83:2694–2698 [DOI] [PubMed] [Google Scholar]
- 4.Shaw LJ, Bairey Merz CN, Azziz R, et al. Postmenopausal women with a history of irregular menses and elevated androgen measurements at high risk for worsening cardiovascular event-free survival: results from the National Institutes of Health—National Heart, Lung, and Blood Institute sponsored Women’s Ischemia Syndrome Evaluation. J Clin Endocrinol Metab 2008;93:1276–1284 [DOI] [PMC free article] [PubMed] [Google Scholar] [Retracted]
- 5.Ovalle F, Azziz R. Insulin resistance, polycystic ovary syndrome, and type 2 diabetes mellitus. Fertil Steril 2002;77:1095–1105 [DOI] [PubMed] [Google Scholar]
- 6.Ciaraldi TP, el-Roeiy A, Madar Z, Reichart D, Olefsky JM, Yen SS. Cellular mechanisms of insulin resistance in polycystic ovarian syndrome. J Clin Endocrinol Metab 1992;75:577–583 [DOI] [PubMed] [Google Scholar]
- 7.Rosenbaum D, Haber RS, Dunaif A. Insulin resistance in polycystic ovary syndrome: decreased expression of GLUT-4 glucose transporters in adipocytes. Am J Physiol 1993;264:E197–E202 [DOI] [PubMed] [Google Scholar]
- 8.Ciaraldi TP. Molecular defects of insulin action in the polycystic ovary syndrome: possible tissue specificity. J Pediatr Endocrinol Metab 2000;13(Suppl. 5):1291–1293 [PubMed] [Google Scholar]
- 9.Ciaraldi TP, Morales AJ, Hickman MG, Odom-Ford R, Olefsky JM, Yen SS. Cellular insulin resistance in adipocytes from obese polycystic ovary syndrome subjects involves adenosine modulation of insulin sensitivity. J Clin Endocrinol Metab 1997;82:1421–1425 [DOI] [PubMed] [Google Scholar]
- 10.Marsden PJ, Murdoch AP, Taylor R. Tissue insulin sensitivity and body weight in polycystic ovary syndrome. Clin Endocrinol (Oxf) 2001;55:191–199 [DOI] [PubMed] [Google Scholar]
- 11.Biyasheva A, Legro RS, Dunaif A, Urbanek M. Evidence for association between polycystic ovary syndrome (PCOS) and TCF7L2 and glucose intolerance in women with PCOS and TCF7L2. J Clin Endocrinol Metab 2009;94:2617–2625 [DOI] [PMC free article] [PubMed] [Google Scholar]
- 12.Lord J, Thomas R, Fox B, Acharya U, Wilkin T. The effect of metformin on fat distribution and the metabolic syndrome in women with polycystic ovary syndrome—a randomised, double-blind, placebo-controlled trial. BJOG 2006;113:817–824 [DOI] [PubMed] [Google Scholar]
- 13.Ciaraldi TP, Aroda V, Mudaliar S, Chang RJ, Henry RR. Polycystic ovary syndrome is associated with tissue-specific differences in insulin resistance. J Clin Endocrinol Metab 2009;94:157–163 [DOI] [PMC free article] [PubMed] [Google Scholar]
- 14.Xu N, Azziz R, Goodarzi MO. Epigenetics in polycystic ovary syndrome: a pilot study of global DNA methylation. Fertil Steril 94:781–783, 2010 [DOI] [PMC free article] [PubMed]
- 15.Müller G, Schneider M, Biemer-Daub G, Wied S. Microvesicles released from rat adipocytes and harboring glycosylphosphatidylinositol-anchored proteins transfer RNA stimulating lipid synthesis. Cell Signal 2011;23:1207–1223 [DOI] [PubMed] [Google Scholar]
- 16.Zhu H, Shyh-Chang N, Segrè AV, et al. DIAGRAM Consortium. MAGIC Investigators The Lin28/let-7 axis regulates glucose metabolism. Cell 2011;147:81–94 [DOI] [PMC free article] [PubMed] [Google Scholar]
- 17.Esau C, Davis S, Murray SF, et al. miR-122 regulation of lipid metabolism revealed by in vivo antisense targeting. Cell Metab 2006;3:87–98 [DOI] [PubMed] [Google Scholar]
- 18.He A, Zhu L, Gupta N, Chang Y, Fang F. Overexpression of micro ribonucleic acid 29, highly up-regulated in diabetic rats, leads to insulin resistance in 3T3-L1 adipocytes. Mol Endocrinol 2007;21:2785–2794 [DOI] [PubMed] [Google Scholar]
- 19.Poy MN, Eliasson L, Krutzfeldt J, et al. A pancreatic islet-specific microRNA regulates insulin secretion. Nature 2004;432:226–230 [DOI] [PubMed] [Google Scholar]
- 20.Herrera BM, Lockstone HE, Taylor JM, et al. Global microRNA expression profiles in insulin target tissues in a spontaneous rat model of type 2 diabetes. Diabetologia 2010;53:1099–1109 [DOI] [PMC free article] [PubMed] [Google Scholar]
- 21.Shepherd PR, Kahn BB. Glucose transporters and insulin action—implications for insulin resistance and diabetes mellitus. N Engl J Med 1999;341:248–257 [DOI] [PubMed] [Google Scholar]
- 22.Thomson MJ, Williams MG, Frost SC. Development of insulin resistance in 3T3-L1 adipocytes. J Biol Chem 1997;272:7759–7764 [DOI] [PubMed] [Google Scholar]
- 23.Abel ED, Peroni O, Kim JK, et al. Adipose-selective targeting of the GLUT4 gene impairs insulin action in muscle and liver. Nature 2001;409:729–733 [DOI] [PubMed] [Google Scholar]
- 24.Tozzo E, Shepherd PR, Gnudi L, Kahn BB. Transgenic GLUT-4 overexpression in fat enhances glucose metabolism: preferential effect on fatty acid synthesis. Am J Physiol 1995;268:E956–E964 [DOI] [PubMed] [Google Scholar]
- 25.Horie T, Ono K, Nishi H, et al. MicroRNA-133 regulates the expression of GLUT4 by targeting KLF15 and is involved in metabolic control in cardiac myocytes. Biochem Biophys Res Commun 2009;389:315–320 [DOI] [PubMed] [Google Scholar]
- 26.Lu H, Buchan RJ, Cook SA. MicroRNA-223 regulates Glut4 expression and cardiomyocyte glucose metabolism. Cardiovasc Res 2010;86:410–420 [DOI] [PubMed] [Google Scholar]
- 27.Garvey WT, Maianu L, Huecksteadt TP, Birnbaum MJ, Molina JM, Ciaraldi TP. Pretranslational suppression of a glucose transporter protein causes insulin resistance in adipocytes from patients with non-insulin-dependent diabetes mellitus and obesity. J Clin Invest 1991;87:1072–1081 [DOI] [PMC free article] [PubMed] [Google Scholar]
- 28.Carvalho E, Jansson PA, Nagaev I, Wenthzel AM, Smith U. Insulin resistance with low cellular IRS-1 expression is also associated with low GLUT4 expression and impaired insulin-stimulated glucose transport. FASEB J 2001;15:1101–1103 [PubMed] [Google Scholar]
- 29.Carlson CJ, Koterski S, Sciotti RJ, Poccard GB, Rondinone CM. Enhanced basal activation of mitogen-activated protein kinases in adipocytes from type 2 diabetes: potential role of p38 in the downregulation of GLUT4 expression. Diabetes 2003;52:634–641 [DOI] [PubMed] [Google Scholar]
- 30.Hatch R, Rosenfield RL, Kim MH, Tredway D. Hirsutism: implications, etiology, and management. Am J Obstet Gynecol 1981;140:815–830 [DOI] [PubMed] [Google Scholar]
- 31.Azziz R, Woods KS, Reyna R, Key TJ, Knochenhauer ES, Yildiz BO. The prevalence and features of the polycystic ovary syndrome in an unselected population. J Clin Endocrinol Metab 2004;89:2745–2749 [DOI] [PubMed] [Google Scholar]
- 32.Katsuki A, Sumida Y, Gabazza EC, et al. Homeostasis model assessment is a reliable indicator of insulin resistance during follow-up of patients with type 2 diabetes. Diabetes Care 2001;24:362–365 [DOI] [PubMed] [Google Scholar]
- 33.Azziz R. Fat biopsy procedure with Dr. Ricardo Azziz [video online], 2012. Available from www.youtube.com Accessed 12 April 2012
- 34.Chazenbalk G, Bertolotto C, Heneidi S, et al. Novel pathway of adipogenesis through cross-talk between adipose tissue macrophages, adipose stem cells and adipocytes: evidence of cell plasticity. PLoS ONE 2011;6:e17834. [DOI] [PMC free article] [PubMed] [Google Scholar]
- 35.Neville MJ, Collins JM, Gloyn AL, McCarthy MI, Karpe F. Comprehensive human adipose tissue mRNA and microRNA endogenous control selection for quantitative real-time-PCR normalization. Obesity (Silver Spring) 2011;19:888–892 [DOI] [PMC free article] [PubMed] [Google Scholar]
- 36.Girish V, Vijayalakshmi A. Affordable image analysis using NIH Image/ImageJ. Indian J Cancer 2004;41:47. [PubMed] [Google Scholar]
- 37.Betel D, Wilson M, Gabow A, Marks DS, Sander C. The microRNA.org resource: targets and expression. Nucleic Acids Res 2008;36:D149–D153 [DOI] [PMC free article] [PubMed] [Google Scholar]
- 38.Krek A, Grün D, Poy MN, et al. Combinatorial microRNA target predictions. Nat Genet 2005;37:495–500 [DOI] [PubMed] [Google Scholar]
- 39.Lewis BP, Burge CB, Bartel DP. Conserved seed pairing, often flanked by adenosines, indicates that thousands of human genes are microRNA targets. Cell 2005;120:15–20 [DOI] [PubMed] [Google Scholar]
- 40.Hsu JB, Chiu CM, Hsu SD, et al. miRTar: an integrated system for identifying miRNA-target interactions in human. BMC Bioinformatics 2011;12:300. [DOI] [PMC free article] [PubMed] [Google Scholar]
- 41.Rehmsmeier M, Steffen P, Hochsmann M, Giegerich R. Fast and effective prediction of microRNA/target duplexes. RNA 2004;10:1507–1517 [DOI] [PMC free article] [PubMed] [Google Scholar]
- 42.Griffiths-Jones S, Grocock RJ, van Dongen S, Bateman A, Enright AJ. miRBase: microRNA sequences, targets and gene nomenclature. Nucleic Acids Res 2006;34:D140–D144 [DOI] [PMC free article] [PubMed] [Google Scholar]
- 43.Doench JG, Sharp PA. Specificity of microRNA target selection in translational repression. Genes Dev 2004;18:504–511 [DOI] [PMC free article] [PubMed] [Google Scholar]
- 44.Fu X, Tian J, Zhang L, Chen Y, Hao Q. Involvement of microRNA-93, a new regulator of PTEN/Akt signaling pathway, in regulation of chemotherapeutic drug cisplatin chemosensitivity in ovarian cancer cells. FEBS Lett 2012;586:1279–1286 [DOI] [PubMed] [Google Scholar]
- 45.Dunaif A, Wu X, Lee A, Diamanti-Kandarakis E. Defects in insulin receptor signaling in vivo in the polycystic ovary syndrome (PCOS). Am J Physiol Endocrinol Metab 2001;281:E392–E399 [DOI] [PubMed] [Google Scholar]
- 46.Dunaif A, Xia J, Book CB, Schenker E, Tang Z. Excessive insulin receptor serine phosphorylation in cultured fibroblasts and in skeletal muscle. A potential mechanism for insulin resistance in the polycystic ovary syndrome. J Clin Invest 1995;96:801–810 [DOI] [PMC free article] [PubMed] [Google Scholar]
- 47.Huang C, Somwar R, Patel N, Niu W, Török D, Klip A. Sustained exposure of L6 myotubes to high glucose and insulin decreases insulin-stimulated GLUT4 translocation but upregulates GLUT4 activity. Diabetes 2002;51:2090–2098 [DOI] [PubMed] [Google Scholar]
- 48.Heneghan HM, Miller N, Kerin MJ. Role of microRNAs in obesity and the metabolic syndrome. Obes Rev 2010;11:354–361 [DOI] [PubMed] [Google Scholar]
- 49.Klöting N, Berthold S, Kovacs P, et al. MicroRNA expression in human omental and subcutaneous adipose tissue. PLoS ONE 2009;4:e4699. [DOI] [PMC free article] [PubMed] [Google Scholar]
- 50.Esau C, Kang X, Peralta E, et al. MicroRNA-143 regulates adipocyte differentiation. J Biol Chem 2004;279:52361–52365 [DOI] [PubMed] [Google Scholar]
- 51.Dehwah MA, Xu A, Huang Q. MicroRNAs and type 2 diabetes/obesity. J Genet Genomics 2012;39:11–18 [DOI] [PubMed] [Google Scholar]
- 52.Ryu HS, Park SY, Ma D, Zhang J, Lee W. The induction of microRNA targeting IRS-1 is involved in the development of insulin resistance under conditions of mitochondrial dysfunction in hepatocytes. PLoS ONE 2011;6:e17343. [DOI] [PMC free article] [PubMed] [Google Scholar]
- 53.Jordan SD, Krüger M, Willmes DM, et al. Obesity-induced overexpression of miRNA-143 inhibits insulin-stimulated AKT activation and impairs glucose metabolism. Nat Cell Biol 2011;13:434–446 [DOI] [PubMed] [Google Scholar]
- 54.Karolina DS, Armugam A, Tavintharan S, et al. MicroRNA 144 impairs insulin signaling by inhibiting the expression of insulin receptor substrate 1 in type 2 diabetes mellitus. PLoS ONE 2011;6:e22839. [DOI] [PMC free article] [PubMed] [Google Scholar]
- 55.Yekta S, Shih IH, Bartel DP. MicroRNA-directed cleavage of HOXB8 mRNA. Science 2004;304:594–596 [DOI] [PubMed] [Google Scholar]
- 56.Lu J, Getz G, Miska EA, et al. MicroRNA expression profiles classify human cancers. Nature 2005;435:834–838 [DOI] [PubMed] [Google Scholar]
- 57.Griffiths-Jones S. Annotating noncoding RNA genes. Annu Rev Genomics Hum Genet 2007;8:279–298 [DOI] [PubMed] [Google Scholar]
- 58.Petrocca F, Visone R, Onelli MR, et al. E2F1-regulated microRNAs impair TGFbeta-dependent cell-cycle arrest and apoptosis in gastric cancer. Cancer Cell 2008;13:272–286 [DOI] [PubMed] [Google Scholar]
- 59.Wang J, Xiang G, Mitchelson K, Zhou Y. Microarray profiling of monocytic differentiation reveals miRNA-mRNA intrinsic correlation. J Cell Biochem 2011;112:2443–2453 [DOI] [PubMed] [Google Scholar]
- 60.Long J, Wang Y, Wang W, Chang BH, Danesh FR. Identification of microRNA-93 as a novel regulator of vascular endothelial growth factor in hyperglycemic conditions. J Biol Chem 2010;285:23457–23465 [DOI] [PMC free article] [PubMed] [Google Scholar]
Associated Data
This section collects any data citations, data availability statements, or supplementary materials included in this article.