Figure 6.
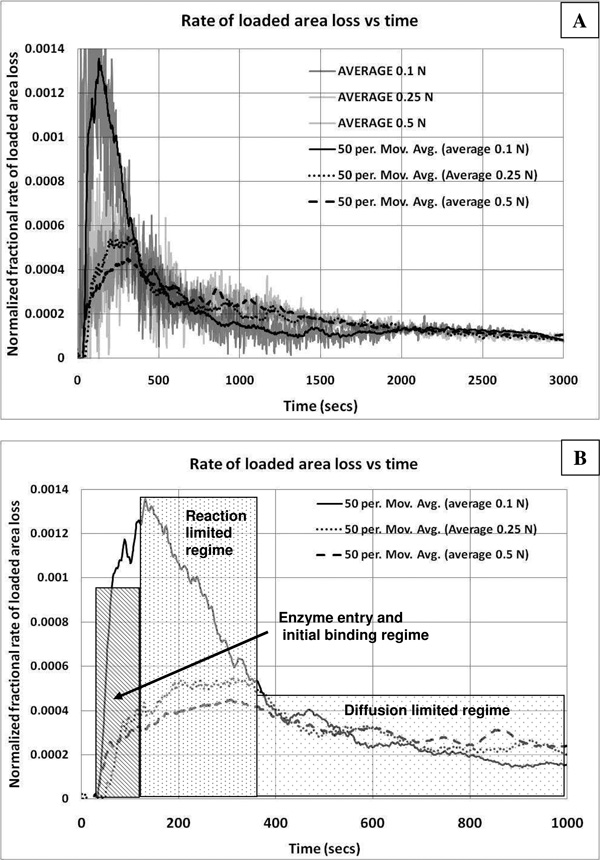
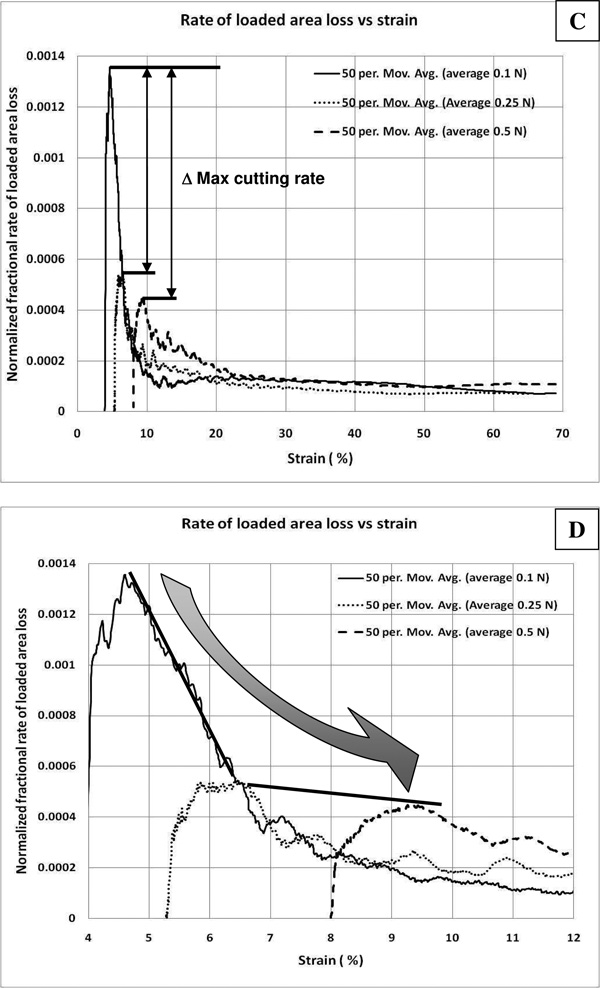
Dynamics of enzyme induced creep experiment. Rate of loss of load-bearing area vs time and strain (i.e. proportional to enzyme cutting rate). For all graphs, the ordinate axes represent the normalized rate of load bearing area loss which may be interpreted as a measure of enzymatic activity on load-bearing tissue components (at low strain). The first derivative was calculated using a 5 point centered difference. A) Area loss rate versus time for the whole experiment (smooth line is a 50 point moving average trendline). The general temporal trend in the loss of loaded material begins with an initial climb to a maximum degradation rate, followed by a decline in the rate of material loss during the remainder of the experiment. B) Area loss vs time for the initial 1000 seconds after enzymatic exposure (trendline). In this plot the temporal dynamics of the initial enzyme induced creep is shown. Given our scaling argument, we assume that during the initial 300 seconds (after a short transient indicating enzyme arrival and binding), that the enzymatic reaction is not limited by diffusion. During this time (dotted box), for all three experiments, a peak in the cutting rate is reached. As the reaction proceeds, diffusion is likely to begin to dominate the reaction rate (gradient box). C) Rate of load-bearing area loss as a function of strain (trendlines shown only). The effect of strain on the cutting rate can be directly extracted. Remarkably, at the beginning of the experiment, it can be seen that ~1.5% increase in applied strain decreases the cutting rate by a factor of ~2.6. The difference in maximum cutting rates (peaks) was statistically significant between the 0.1 and the 0.25 and 0.5 N runs (p<0.05). There was no significant difference between the 0.5 and 0.25N runs. In support of the hypothesis that enzymatic activity is a function of strain, once the strains for the 0.1 and 0.25N samples converge, so does the cutting rate. D) Relationship between strain and enzyme cutting rate at low strain (trendline). For the sample under the lower load, the effect of strain (over a continuous strain regime from ~4.5–6.5%) depresses the ability of the enzyme to cut the load bearing collagen fibrils at a rate of approximately 30%/1% (found by linear regression of the raw data). However, we suspect that diffusion limitation prevents further extrapolation given the higher maximum cutting rate for 0.5N sample at similar strains. If we connect the maximum cutting rates, we get two lines which suggest that the relationship between strain and enzyme activity is sharply non-linear and decreasing with strain from about 4.5 to 9.5%


