Abstract
Understanding the role of visceral fat accumulation in the occurrence and progression of metabolic syndrome is of considerable interest. In order to understand the difference between visceral tissue biology of healthy and unhealthy obese individuals, we have used microarray profiling to compare genome-wide expression differences between visceral adipose tissue biopsies obtained from obese diabetics, and those from age and body mass index (BMI) matched normal glucose tolerance subjects. Whereas genes upregulated in diabetics showed enrichment of natural killer cell mediated cytotoxicity, the downregulated genes showed enrichment of biosynthesis of unsaturated fatty acids. Given the known inhibitory effect of unsaturated fatty acids on inflammation and natural killer cell number or activity, our results suggest that visceral inflammation resulting from decreased levels of unsaturated fatty acids may underlie progression of diabetes in obese individuals.
Keywords: Diabetes, microarray, transcriptional analysis, visceral adipose tissue
INTRODUCTION
Obese individuals can be metabolically healthy or can suffer from various co-morbidities such as type 2 diabetes (T2D), insulin resistance, and cardiovascular disorders or dyslipidemia.[1,2,3,4,5] In particular, accumulation of fat in visceral tissue is considered a risk factor for obesity-related complications.[1,6,7] The obesity-related metabolic complications like T2D and insulin resistance possibly arise due to incorrect fat storage and processing in the adipose tissue, leading to increased circulatory free fatty acids and their uptake by non-adipose tissues.[1] Understanding the role of visceral fat accumulation in the occurrence and progression of metabolic syndrome constitutes an important area of investigation.[8]
Gene expression profiling provides an unbiased approach to identify dysregulated genes in one condition versus the other. Differential expression of genes between two conditions may reflect the underlying differences in biological pathways. In order to understand the difference between visceral tissue biology of healthy and unhealthy obese individuals, we have used microarray profiling to compare genome-wide expression differences between visceral adipose tissue biopsies obtained from obese diabetics, and those from age and body mass index (BMI) matched normal glucose tolerance subjects. The waist to hip (W:H) ratio between the two groups was not matched, with diabetics showing a higher ratio. Our study was thus focused on separating diabetes from obesity irrespective of fat distribution. All individuals subjects who participated in our study were from North India. Also, we selected only female subjects in order to avoid the influence of gender on gene expression.
MATERIALS AND METHODS
Study subjects
Five T2D patients and five age-matched controls with normal glucose tolerance and no family history of diabetes, undergoing cholecystectomy under general anesthesia, were recruited for this study. The inclusion criteria were females with BMI >30 kg/m2 and age >55 years. The exclusion criteria were subjects on metformin and pioglitazone, or having active infection, and malignancy. The study protocol was approved by the ethics committee of SMS Medical College, Jaipur, India. Written consent was obtained from all the participants.
Clinical and biochemical assessment
Apart from routine clinical assessment, BMI and W:H ratio were measured for all participants. The biochemical parameters measured included blood glucose, 2 h glucose tolerance test (GTT) with 75 g of glucose in control subjects, lipid profile, fasting insulin, and free fatty acid level. Biochemical investigation was done on Kopran AU400 autoanalyzer. Kits supplied by Randox were used for estimation of free fatty acid. DPC Immulite 2000 chemiluminescence analyzer was used for estimation of insulin.
Adipose tissue biopsy
Visceral adipose tissue biopsies were taken from omentum. The tissues were immediately stored in RNA later solution (Qiagen, USA).
Microarray hybridization
Total cellular RNA was isolated from adipose tissue using Ribopure (Ambion, USA). RNA was reverse transcribed using poly-dT primer, followed by second strand synthesis. Finally, after several rounds of amplification, digoxigenin (DIG)-labeled cRNA was produced using the Applied Biosystems (USA) Chemiluminescent RT-IVT labeling kit. Applied Biosystems Human Genome Survey Microarray V2.0 containing 32,878 probes representing 29,098 genes was used for hybridization. The labeled DIG-cRNA (10 μg per microarray) was injected into each microarray hybridization chamber. Following hybridization at 55°C for 16 h, the unbound material was washed from the microarrays. Features that retained bound DIG-labeled cRNA were detected using the Applied Biosystems Chemiluminescence Detection Kit in conjunction with Applied Biosystems 1700 Chemiluminescent Microarray Analyzer. The microarray data have been submitted in Gene Expression Omnibus (GEO; GSE16415).
Expression data analysis
The raw data files of the above GEO record (GSE16415) were preprocessed by extracting probe ID and signal value, with signal by noise value greater than 3 for all 10 samples (GSM412607, GSM412608, GSM412609, GSM412610, GSM412611, GSM412612, GSM412613, GSM412614, GSM412615, GSM412616). The common probe among all 10 samples was normalized by quantile normalization method using R programming (R 2.7.2). The normalized data was checked using boxplot in R. Significance Analysis of Microarray (SAM 3.02) was used to identify differentially expressed genes. In SAM analysis, the settings used included two classes unpaired response, T statistics and hundred permutations. Genes with 0% False Discovery Rate (FDR) were used for enrichment analysis using DAVID.[9,10] Kyoto Encyclopedia of Genes and Genomes (KEGG; http://www.genome.jp/kegg/"http://www.genome.jp/kegg/) was used for visualizing genes in pathways.
RESULTS
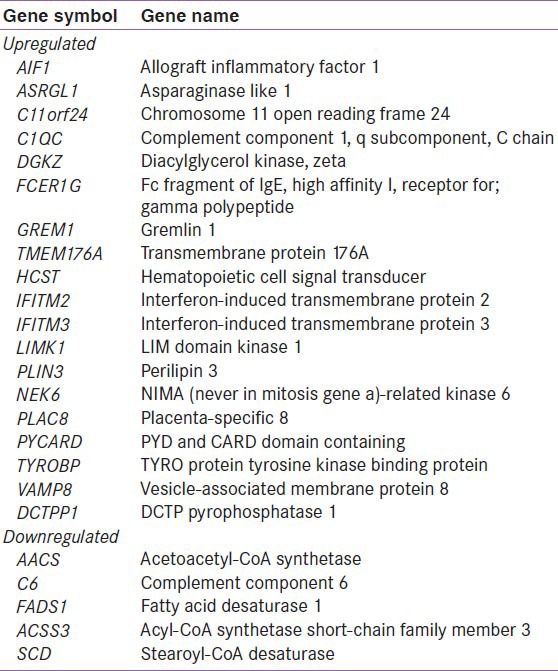
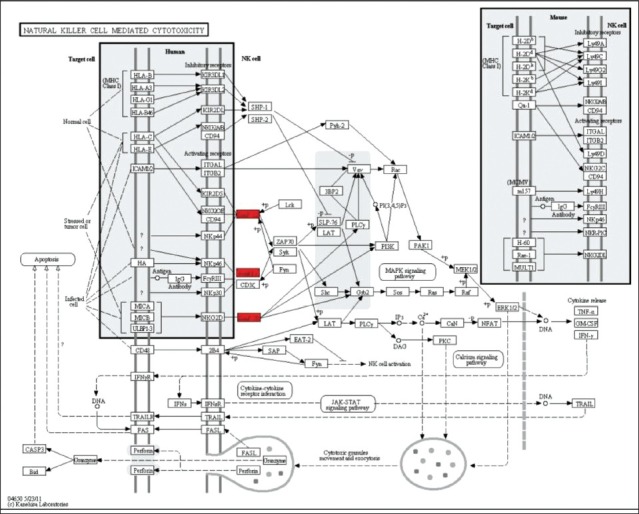
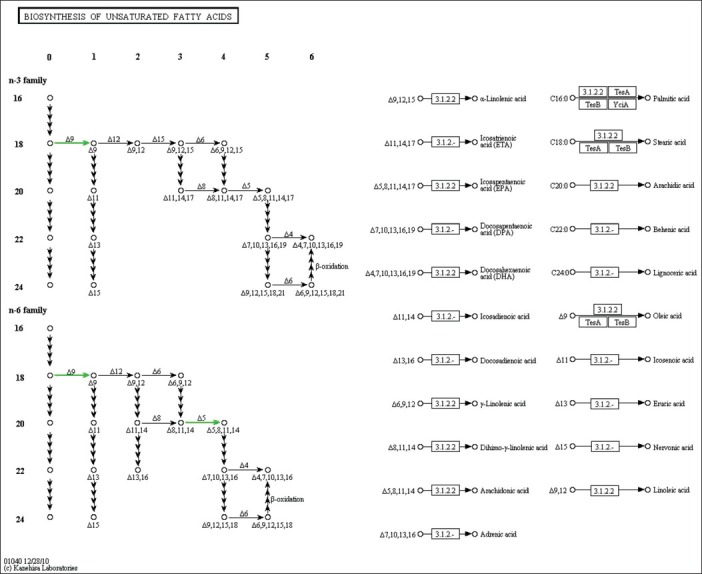
Subject characteristics are shown in Table 1. The subjects were well matched for BMI and age. Consistent with the study design, all measures of insulin response were significantly different between the diabetic and control groups. In the microarray analysis, visceral adipose from T2D obese patients exhibited 19 upregulated and 5 downregulated genes [Table 2]. The upregulated genes showed enrichment for the KEGG pathway of natural killer cell mediated cytotoxicity (P = 0.01) and for the gene ontology (GO) biological process immune response (P = 0.03). In the downregulated genes, the KEGG pathway of biosynthesis of unsaturated fatty acids (P = 0.01) was enriched. The GO processes enriched in this gene set included fatty acid metabolic process (P = 0.0006), fatty acid biosynthetic process (P = 0.01), response to organic cyclic substance (P = 0.02), response to nutrient (P = 0.03), carboxylic acid biosynthetic process (P = 0.03), organic acid biosynthetic process (P = 0.03), response to nutrient levels (P = 0.03), and response to extracellular stimulus (P = 0.04). The upregulated genes in natural killer cell mediated cytotoxicity pathway included FCER1G, HCST, and TYROBP [Figure 1]. The downregulated genes in biosynthesis of unsaturated fatty acids pathway included SCD and FADS1 [Figure 2].
Table 1.
General characteristics and biochemical parameters in participating subjects

Table 2.
List of differentially expressed genes

Figure 1.

Genes in natural killer cell mediated cytotoxicity pathway. Upregulation of FCER1G, HCST, and TYROBP is indicated in red color in KEGG pathway
Figure 2.

Genes in biosynthesis of unsaturated fatty acids pathway. Downregulation of SCD and FADS1 is shown in green color in KEGG pathway
DISCUSSION
The most significant finding of our genome-wide expression analysis of visceral adipose from BMI-matched normal and diabetic subjects is differential expression of genes over-representing two pathways. Whereas genes upregulated in diabetics enrich natural killer cell mediated cytotoxicity, the downregulated genes show enrichment of biosynthesis of unsaturated fatty acids. Given that BMI was matched whereas W:H ratio between the two groups was not matched, with diabetics showing a higher ratio, the above result essentially separates diabetes from obesity irrespective of fat distribution.
Adipose tissue inflammation is known to underlie the pathogenesis of obesity-related metabolic disorders including diabetes.[11,12,13] Besides adipocytes, adipose tissue comprises various types of immune cell types such as natural killer cells.[12,13] Infiltration of leukocytes, including natural killer cells, has been found to be particularly higher in visceral adipose tissue of obese individuals.[13] Recent findings implicate infiltrate natural killer cells in adipose tissue inflammation.[12,13,14] Our results showing enrichment of natural killer cell mediated cytotoxicity pathway in genes upregulated in diabetics are consistent with the above findings.
Fatty acids in human adipose tissue, including visceral adipose, are derived from both endogenous and dietary sources.[15,16,17] Whereas saturated fatty acids have been associated with increased cardiometabolic risk, various unsaturated fatty acids are considered to protect against it.[17] Decrease in adipose tissue levels of these unsaturated fatty acids has been suggested to underlie development of obesity-related diseases.[17] Our finding of downregulated genes enriched in biosynthesis of unsaturated fatty acids in diabetes is consistent with the existing evidence.
Given the known inhibitory effect of unsaturated fatty acids on inflammation and natural killer cell number or activity,[18,19,20,21,22] the present transcriptomic results showing upregulation of natural killer cell mediated cytotoxicity and downregulation of biosynthesis of unsaturated fatty acids in diabetes together seem intuitive. Cumulatively, our finding links diabetes with visceral inflammation resulting from decreased levels of unsaturated fatty acids in visceral tissue.
CONCLUSION
Genome level expression analysis of visceral adipose from healthy and diabetic obese links decreased biosynthesis of unsaturated fatty acids and increased natural killer cell mediated cytotoxicity with the latter. Visceral inflammation resulting from decreased levels of unsaturated fatty acids may underlie progression of diabetes in obese individuals.
Footnotes
Source of Support: Lupin India Ltd
Conflict of Interest: None declared
REFERENCES
- 1.Clemente-Postigo M, Queipo-Ortuño MI, Fernandez-Garcia D, Gomez-Huelgas R, Tinahones FJ, Cardona F. Adipose tissue gene expression of factors related to lipid processing in obesity. PLoS One. 2011;6:e24783. doi: 10.1371/journal.pone.0024783. [DOI] [PMC free article] [PubMed] [Google Scholar]
- 2.Reaven G. All obese individuals are not created equal: Insulin resistance is the major determinant of cardiovascular disease in overweight/obese individuals. Diab Vasc Dis Res. 2005;2:105–12. doi: 10.3132/dvdr.2005.017. [DOI] [PubMed] [Google Scholar]
- 3.Barbarroja N, López-Pedrera R, Mayas MD, García-Fuentes E, Garrido-Sánchez L, Macías-González M, et al. The obese healthy paradox: Is inflammation the answer? Biochem J. 2010;430:141–9. doi: 10.1042/BJ20100285. [DOI] [PubMed] [Google Scholar]
- 4.Unger RH. Minireview: Weapons of lean body mass destruction: The role of ectopic lipids in the metabolic syndrome. Endocrinology. 2003;144:5159–65. doi: 10.1210/en.2003-0870. [DOI] [PubMed] [Google Scholar]
- 5.MacLaren RE, Cui W, Lu H, Simard S, Cianflone K. Association of adipocyte genes with ASP expression: A microarray analysis of subcutaneous and omental adipose tissue in morbidly obese subjects. BMC Med Genomics. 2010;3:3. doi: 10.1186/1755-8794-3-3. [DOI] [PMC free article] [PubMed] [Google Scholar]
- 6.Karelis AD, St-Pierre DH, Conus F, Rabasa-Lhoret R, Poehlman ET. Metabolic and body composition factors in subgroups of obesity: What do we know? J Clin Endocrinol Metab. 2004;89:2569–75. doi: 10.1210/jc.2004-0165. [DOI] [PubMed] [Google Scholar]
- 7.Smith JD, Borel AL, Nazare JA, Haffner SM, Balkau B, Ross R, et al. Visceral adipose tissue indicates the severity of cardiometabolic risk in patients with and without type 2 diabetes: Results from the INSPIRE ME IAA study. J Clin Endocrinol Metab. 2012;97:1517–25. doi: 10.1210/jc.2011-2550. [DOI] [PubMed] [Google Scholar]
- 8.Di Chiara T, Argano C, Corrao S, Scaglione R, Licata G. Hypoadiponectinemia: A Link between Visceral Obesity and Metabolic Syndrome. J Nutr Metab. 2012;2012:175245. doi: 10.1155/2012/175245. [DOI] [PMC free article] [PubMed] [Google Scholar]
- 9.Huang da W, Sherman BT, Lempicki RA. Systematic and integrative analysis of large gene lists using DAVID bioinformatics sresources. Nat Protoc. 2009;4:44–57. doi: 10.1038/nprot.2008.211. [DOI] [PubMed] [Google Scholar]
- 10.Huang da W, Sherman BT, Lempicki RA. Bioinformatics enrichment tools: Paths toward the comprehensive functional analysis of large gene lists. Nucleic Acids Res. 2009;37:1–13. doi: 10.1093/nar/gkn923. [DOI] [PMC free article] [PubMed] [Google Scholar]
- 11.Ohmura K, Ishimori N, Ohmura Y, Tokuhara S, Nozawa A, Horii S, et al. Natural killer T cells are involved in adipose tissue sinflammation and glucose intolerance in diet-induced obese mice. Arterioscler Thromb Vasc Biol. 2010;3:193–9. doi: 10.1161/ATVBAHA.109.198614. [DOI] [PubMed] [Google Scholar]
- 12.O’Rourke RW, Metcalf MD, White AE, Madala A, Winters BR, Maizlin II, et al. Depot-specific differences in inflammatory mediators and a role for NK cells and IFN-gamma in inflammation in human adipose tissue. Int J Obes (Lond) 2009;33:978–90. doi: 10.1038/ijo.2009.133. [DOI] [PMC free article] [PubMed] [Google Scholar]
- 13.O’Rourke RW, White AE, Metcalf MD, Olivas AS, Mitra P, Larison WG, et al. Hypoxia-induced inflammatory cytokine secretion in human adipose tissue stromovascular cells. Diabetologia. 2011;54:1480–90. doi: 10.1007/s00125-011-2103-y. [DOI] [PMC free article] [PubMed] [Google Scholar]
- 14.Yang H, Youm YH, Vandanmagsar B, Ravussin A, Gimble JM, Greenway F, et al. Obesity increases the production of proinflammatory mediators from adipose tissue T cells and compromises TCR repertoire diversity: Implications for systemic inflammation and insulin resistance. J Immunol. 2010;185:1836–45. doi: 10.4049/jimmunol.1000021. [DOI] [PMC free article] [PubMed] [Google Scholar]
- 15.Garaulet M, Pérez-Llamas F, Pérez-Ayala M, Martínez P, de Medina FS, Tebar FJ, et al. Site-specific differences in the fatty acid composition of abdominal adipose tissue in an obese population from a Mediterranean area: Relation with dietary fatty acids, plasma lipid profile, serum insulin, and central obesity. Am J Clin Nutr. 2001;74:585–91. doi: 10.1093/ajcn/74.5.585. [DOI] [PubMed] [Google Scholar]
- 16.Soriguer Escofet FJ, Esteva de Antonio I, Tinahones FJ, Pareja A. Adipose tissue fatty acids and size and number of fat cells from birth to 9 years of age – A cross-sectional study in 96 boys. Metabolism. 1996;45:1395–401. doi: 10.1016/s0026-0495(96)90121-3. [DOI] [PubMed] [Google Scholar]
- 17.Garaulet M, Hernandez-Morante JJ, Tebar FJ, Zamora S. Relation between degree of obesity and site-specific adipose tissue fatty acid composition in a Mediterranean population. Nutrition. 2011;27:170–6. doi: 10.1016/j.nut.2010.01.004. [DOI] [PubMed] [Google Scholar]
- 18.Calder PC. The effects of fatty acids on lymphocyte functions. Braz J Med Biol Res. 1993;26:901–17. [PubMed] [Google Scholar]
- 19.Yaqoob P, Newsholme EA, Calder PC. Inhibition of natural killer cell activity by dietary lipids. Immunol Lett. 1994;41:241–7. doi: 10.1016/0165-2478(94)90140-6. [DOI] [PubMed] [Google Scholar]
- 20.Sasaki T, Kanke Y, Kudoh K, Nagahashi M, Toyokawa M, Matsuda M, et al. Dietary n-3 polyunsaturated fatty acid and status of immunocompetent cells involved in innate immunity in female rats. Ann Nutr Metab. 2000;44:38–42. doi: 10.1159/000012819. [DOI] [PubMed] [Google Scholar]
- 21.Thies F, Nebe-von-Caron G, Powell JR, Yaqoob P, Newsholme EA, Calder PC. Dietary supplementation with eicosapentaenoic acid, but not with other long-chain n-3 or n-6 polyunsaturated fatty acids, decreases natural killer cell activity in healthy subjects aged>55 y. Am J Clin Nutr. 2001;73:539–48. doi: 10.1093/ajcn/73.3.539. [DOI] [PubMed] [Google Scholar]
- 22.Mukaro VR, Costabile M, Murphy KJ, Hii CS, Howe PR, Ferrante A. Leukocyte numbers and function in subjects eating n-3 enriched foods: Selective depression of natural killer cell levels. Arthritis Res Ther. 2008;10:R57. doi: 10.1186/ar2426. [DOI] [PMC free article] [PubMed] [Google Scholar]


