

Abstract
Neutral and niche theories give contrasting explanations for the maintenance of tropical tree species diversity. Both have some empirical support, but methods to disentangle their effects have not yet been developed. We applied a statistical measure of spatial structure to data from 14 large tropical forest plots to test a prediction of niche theory that is incompatible with neutral theory: that species in heterogeneous environments should separate out in space according to their niche preferences. We chose plots across a range of topographic heterogeneity, and tested whether pairwise spatial associations among species were more variable in more heterogeneous sites. We found strong support for this prediction, based on a strong positive relationship between variance in the spatial structure of species pairs and topographic heterogeneity across sites. We interpret this pattern as evidence of pervasive niche differentiation, which increases in importance with increasing environmental heterogeneity.
Keywords: species coexistence, tropical forest, niche differentiation, neutral theory, spatial pattern, cross-pair overlap distribution
1. Introduction
The specialization of species to particular environmental conditions is one mechanism that potentially supports the maintenance of high tree species richness in tropical forests [1,2]. For single species or groups of species, evidence of niche differentiation is strong, and numerous studies have identified associations of tropical forest tree species to environmental variables such as elevation, soil chemistry and water content, exposure, humidity, temperature and light regimes [3–7]. However, the role of niche differentiation in maintaining overall levels of plant diversity remains unclear [8,9], as does the consistency of its effects across sites.
In contrast to niche differentiation, the neutral theory suggests that species richness is maintained as a balance between immigration and extinction through neutral and ongoing ‘drift’ of species [10,11], and is able to accurately predict community-scale patterns such as species–area relationships (SARs) and species abundance distributions (SADs) without recourse to any functional differences between species. As with other patterns, the relationship between SADs or SARs and underlying processes is not one-to-one, however, making direct inference of process from pattern impossible [12]. In particular, the footprints that neutral and niche processes leave on SADs and SARs, singly or in combination, may be indistinguishable [13,14].
In recent years, the use of summary statistics that include information on spatial structure has become more widespread in ecology [15]. These statistics provide a promising basis for discriminating between ecological processes, both in empirical [16,17] and in simulated settings [18]. The possibility of resolving the neutral–niche debate has driven the development and application of these statistics, but a resolution has not yet been achieved [19,20]. One reason is that limited dispersal—a process that may be neutral or non-neutral depending on whether it occurs identically across species—can produce forms of clustering and species turnover that correlate spuriously with environmental variation, implying niche differentiation where none in fact exists [21]. This problem is exacerbated by the fact that only a few species’ dispersal kernels have been estimated (but see [22]), and that niche effects, if present, would depend upon the magnitude and scale of environmental variation in ways that are hard to predict [23].
When both limited dispersal and niche differentiation occur together, disentangling their effects on species distributions is especially difficult. Attempts to do so generally assume that the effects operate at different scales, and select an arbitrary radius at which environmental variation is thought to replace dispersal limitation as the dominant spatial effect [24]. A variation on this technique is the identification of specific habitats or habitat types within which niche effects are assumed to be negligible, and non-random spatial structure therefore primarily a consequence of limited dispersal [23]. Studies that attempt to separate the effects of niche differentiation and dispersal limitation, however, have not produced a consistent assessment of the importance of either. Often, their conclusion is that niche differentiation may play a small and variable role, but that neutral dispersal can most closely describe the dynamics of rainforest communities [25–27].
One method of discounting the effects of dispersal limitation is to compare the spatial structure of forests in which environmental variability is relatively small against forests in which it is relatively large. In this case, dispersal limitation can be expected either to be consistent or to vary independently of environmental heterogeneity, so that differences between the forests’ spatial structure do not correlate with differences in their environments. Instead, systematic differences in spatial structure may be attributed to the degree of niche differentiation permitted by the underlying environment. This method requires multiple comparisons of very large, spatially explicit datasets on species distributions, with corresponding environmental data. The development of networks such as the Center for Tropical Forest Science (CTFS) plots [28] now makes spatial analyses of this kind more feasible, especially as the topographical data collected in these plots correlate strongly with several environmental variables on which niche differentiation might occur, such as water and nutrient availability [6–8].
In addition, the method requires statistics that are able to summarize the spatial structure of multispecies communities and that are sensitive to the signatures of niche differentiation. Very few studies of this kind have been conducted, although the few that are available give intriguing glimpses of the roles of niche differentiation and neutral dynamics in determining community structure, suggesting that both play important roles that may vary between species, sites and spatial scales [16,29]. It is therefore a priority for research to investigate the general scope of neutrality across multiple species and sites, to complement research focused on particular species and environmental variables.
Here, we perform the largest-scale test of the spatial predictions of neutral and niche theories yet undertaken, using data from 14 large forest plots within the CTFS network, in order to assess the theories’ relative abilities to explain cross-site patterns in community structure. We apply a new statistic—the cross-pair overlap distribution, or xPOD [18]—which summarizes the spatial overlap of all species pairs within a community. This statistic has been developed to distinguish between the spatial signatures of neutrality and of niche differentiation (among other mechanisms) in species-rich plant communities. Under neutrality, species are separated only by the combined effects of density-dependent mortality and dispersal-driven clumping, both of which must affect all species equally. All pairs of species thus have similar overlaps, and the xPOD has a relatively low variance. By contrast, if species have different niche preferences linked to spatial heterogeneity in the environment, they separate out in space according to the scale of this heterogeneity. As a result, there is more variation in the overlaps of pairs of species, and the xPOD has a relatively large variance that increases with the degree and grain of environmental variation (figure 1).
Figure 1.

The contribution of species pairs to the xPOD for Lienhuachih. (a,b) The locations of all individuals of two species that are clearly separated in space, and (e) have a log cross-pair correlation function below zero at all radii. (c,d) The locations of two further species that clearly overlap in space, both occurring along ridgelines. (f) These species have a log cross-pair correlation function above zero. As a result, the areas (Aij) under these functions are negative and positive, respectively (shaded). These two Aijs contribute as indicated to the full set of Aijs representing all possible species pairs on the Lienhuachih plot, which together give (g) the complete xPOD for Lienhuachih.
Where niche differentiation occurs, species pairs in environmentally heterogeneous habitats are expected to have a greater range of spatial overlaps than those in more homogeneous habitats, and to have a correspondingly greater xPOD variance. Under neutrality, no mechanism exists to produce such a systematic relationship between the environment and community because this relationship is an expression of the species-specific behaviours that neutrality precludes. We therefore test the hypothesis that the variance of the xPOD increases with environmental heterogeneity in tropical rainforest plots. This allows us to investigate the consistency, at community scale, of niche differentiation on all factors related to environmental heterogeneity across dissimilar sites. Our findings confirm the hypothesis, suggesting that neutral theory alone cannot account for tropical forest community structure, and that tropical tree species have the feature of increasing spatial niche differentiation with increasing environmental heterogeneity.
2. Material and methods
(a). Data
Data for all free-standing woody plants greater than or equal to 1 cm diameter at breast height (dbh, with breast height defined as 1.3 m from the ground) mapped to a precision of 0.1 m, and elevation surveyed on a 20 × 20 m grid, were obtained for 14 plots in the network coordinated by the CTFS [28]. The plots were Barro Colorado Island (BCI) in Panama, Dinghushan, Gutianshan and Xishuangbanna in China, Fushan and Lienhuachih in Taiwan, Lambir and Pasoh in Malaysia, Luquillo in Puerto Rico, Mo Singto in Thailand, Mudumalai in India, Palanan in the Philippines, Sinharaja in Sri Lanka and Yasuni in Ecuador (see the electronic supplementary material, table S1). Topography derived from elevation data was used to measure environmental variation (see below) because other data, relating for example to soil chemical and physical properties, are not available to us for all sites. Plots for this study were selected to sample a wide range of topographical characteristics within the tropical forest biome, but without further restrictions on geographical location, altitude or climate. We set a lower limit of 16 ha on plot size in order to maximize the number of sites available for study, while ensuring that a minimum of 100 species pairs per site met our diameter and species abundance thresholds to produce a clear cross-pair overlap distribution.
The 14 plots are between 16 and 52 ha in size, and have elevation ranges of between 25 m (Pasoh) and 269 m (Gutianshan). Plots also differ in terms of longitude, latitude, climate, disturbance regimes (recorded human disturbance is absent or very minor in all), species diversity and stem density, among other characteristics (see the electronic supplementary material, table S1). These substantial and important differences are likely to have significant impacts on the relative strengths of ecological processes occurring in the forests, including those that affect spatial patterns. However, our hypothesis is that the signal of niche differentiation in the relative locations of species in heterogeneous environments is universal, and so should vary in a broadly predictable way in comparisons of plots regardless of specific plot characteristics.
Within the plots, each plant was identified by its coordinates relative to the plot corners, diameter and species identity; where more than one stem was present, we used the largest stem. We also used elevation data measured at the corners of each 20 × 20 m subplot to derive the environmental metrics, as this was the finest resolution of the topographic survey data that was available consistently for all plots. In separate analyses, we applied minimum species abundance thresholds of 100 and 500 individuals, to ensure that the uninformative spatial signal of rare species (which, by their nature, tend to be highly separate in space from other species) did not dominate our results, but also that sufficient species were included to produce clear distributions. Minimum dbh thresholds of 1 cm, to include all recorded trees in the datasets, and a variable threshold to isolate the signal of adult trees were applied in separate analyses (the numbers of species and individuals included in analyses with each of these abundance and dbh thresholds are given in the electronic supplementary material, table S2). Following Bagchi et al. [30], adult trees were defined as those with a dbh greater than the 99th percentile dbh for that species raised to a power of 2/3. This is a biologically motivated and conservative threshold, thought to be successful in excluding non-reproductive juveniles from the adult class. The locations of adult trees were expected to be more informative about topographic niche preferences, being less dependent upon partially stochastic effects that determine seedling and sapling locations [31,32].
(b). Spatial statistic (cross-pair overlap distribution)
To summarize multispecies spatial patterns in different plots, we used the cross-pair overlap distribution (xPOD [18]), a statistic that is sensitive to non-random aggregation and separation of pairs of species. We give an example of the calculation of the xPOD in figure 1, and provide below an explanation of the ideas on which it is based.
The xPOD describes the spatial overlap of all species in a community as a histogram of scalar quantities Aij, each of which is the area under the log of the cross-pair correlation function for one pair of species, i, j [15]. The cross-pair correlation function gij(r) for the pair of species i, j describes the spatial relationship of i and j as a function of the distance r between pairs of individuals of i and j. The function takes a value of one (zero on the log scale) when i and j are distributed independently of one another at a distance r, and takes larger or smaller values when i and j are more or less aggregated than this [15].
The area under the cross-pair correlation function is computed as
| 1 |
the area under the function log(gij(r)) up to a maximum distance R (figure 1). Each area Aij therefore captures the dominant spatial relationship between species i and j up to a distance R. The xPOD was defined for use over a distance R of one-quarter of minimum plot dimension, following the recommendation of Baddeley & Turner [33]. In order to avoid violating this in the smallest plots while keeping the scale of analysis constant, we set a value of R of 80 m in all plots. An Aij value of zero implies that the two species are randomly distributed relative to one another, a positive value indicates that they overlap in space and a negative value indicates that they are separated in space. The xPOD is the frequency distribution of these Aijs over an assemblage of species, taking all combinations of species i and j (with i ≠ j); for instance, 100 species give a frequency distribution of 9900 Aijs. A frequency distribution with a small range indicates that all species have a similar degree of spatial overlap, whereas a distribution with a large range indicates that some species pairs overlap to a far greater or lesser extent than others. The xPOD is calculated so that edge effects do not occur (see the electronic supplementary material, text S1). In measuring the spatial overlap of species pairs, the xPOD is not affected by differences in overall density and diversity, although it becomes more informative as both increase, and is therefore used with abundance and diversity thresholds.
Like any other descriptor, the xPOD does not uniquely link patterns with processes. However, it has the advantage of reducing a potentially very complex multispecies spatial pattern to a simple and comparable frequency distribution. It is ideally suited to our current investigation because it has been shown to discriminate reliably between neutral and niche processes in a simulation study [18]. The principal difference between xPODs produced by simulated neutral and niche models was in the spread of values obtained for different species pairs, and so we summarize the xPODs of each forest plot in this study by their standard deviations. The use of this single value to characterize the spatial behaviour of species at each site allows a direct comparison with the environmental metrics of each site described in §2c.
(c). Environmental metrics and regression
We summarized environmental heterogeneity in each plot in terms of topography, which is the only environmental measure consistently available across all plots. It is also strongly correlated with variation in resources such as water availability and soil conditions, and a potentially important axis of niche differentiation in plant communities [8,34]. This means that measures of topography should capture much of the variation in important specific factors on which niche specialization occurs.
Both the total range and the spatial scale of topographic variation may affect patterns of overlap between species’ niches, with both increasing range and increasing scale (or decreasing ‘roughness’) expected to increase the spread of the xPOD through greater niche separation. We therefore used five metrics designed to capture aspects of these: the range and standard deviation of elevation; the surface-to-planimetric area ratio; the proportion of convex 20 × 20 m subplots; and the average slope between subplots (table 1). Range and roughness are not independent properties, but these metrics allow us to separate their effects as far as possible. These effects may operate directly through elevation, or indirectly through other environmental variables. Because of the possibility that regular diurnal variation in cloudiness influences irradiance regimes as a function of aspect, we also summarized differences in aspect between plots in terms of subplot aspects.
Table 1.
The names, identities and characteristics described by the environmental metrics calculated for each plot. Each measurement of elevation is taken as the centre-point of one ‘cell’, and metrics are calculated only for those cells with eight neighbours (i.e. neglecting those at the plot edge). z, elevation; zi, elevation of cell i; nc, total number of cells; nn, number of neighbours of each cell (=8); zdiff, difference in elevation between two (neighbouring) cells; sfdiff, surface distance between two cells.
| name | identity | characteristic |
|---|---|---|
| elevation range | max(z) − min(z) | range |
| elevation standard deviation | sd(z) | range; roughness |
| surface : planimetric area ratio | following method in [56] | range; roughness |
| proportion of convex cells | 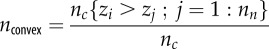 |
roughness |
| mean slope | 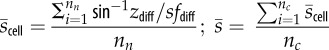 |
roughness |
We used linear regression to examine the relationships between each measure of environmental heterogeneity and the standard deviations of the xPODs across plots. To check for plot-size effects, we also derived environmental metrics and xPODs separately for each half of the four plots with an area of 50 ha or more (BCI, Lambir, Mudumalai and Pasoh), and included these in each regression as independent points. We also checked for any relationships between biogeographic factors and xPOD standard deviations using linear regression. No clear predictions about the form of these relationships have been established, and because it is also unclear how the effects might combine or interact, we performed a single regression for each.
3. Results
Figure 1 shows the steps from spatial patterns of trees to an xPOD, using information from the Lienhuachih plot in Taiwan. Figure S1 in the electronic supplementary material shows the xPODs and range of elevation over space for all plots in the analysis. There is clearly more variation in the xPODs as elevation range increases, with larger positive and, especially, negative values, respectively indicating spatial overlap and segregation of species pairs. This pattern was observed at all of the abundance and dbh thresholds we applied, but was found to be strongest at an abundance threshold of 100 individuals and a dbh threshold of 1 cm (see the electronic supplementary material, figure S2), which also maximized the number of species included in the analyses (see the electronic supplementary material, table S2). Figure 2 shows the relationships between xPOD standard deviation and elevation range, elevation standard deviation (both positive and significant at just over 1% level by linear regression) and the proportion of convex sub-plots (with an abundance threshold of 500 individuals, negative and also significant at just over 1% level). Other, non-significant relationships, between xPOD standard deviation and average slope (with a p-value of 0.06) and surface to planimetric area ratio, are shown in figure S3. All of these relationships were strengthened when we included the two halves of each of the largest (greater than or equal to 50 ha) plots as independent points in the regressions, but this was largely attributable to the increase in the number of data points as none were dissimilar enough to substantially constrain the model fit.
Figure 2.
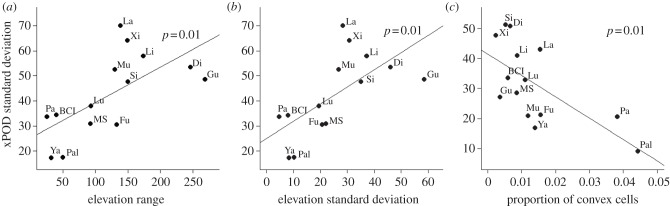
Significant relationships between cross-pair overlap distribution standard deviations and environmental metrics. Fitted regression lines and their associated p-values are shown in (a-c). The relationships in (a) and (b) are at a species abundance threshold of 100, while the relationship in (c) is at a threshold of 500. Plots are identified as follows: BCI, Barro Colorado Island; Di, Dinghushan; Fu, Fushan; Gu, Gutianshan; La, Lambir; Li, Lienhuachih; Lu, Luquillo; MS, Mo Singto; Mu, Mudumalai; Pa, Pasoh; Pal, Palanan; Si, Sinharaja; Xi, Xishuangbanna; Ya, Yasuni.
No significant relationships were found between the xPODs and climatological or biogeographic characteristics of the plots (see the electronic supplementary material, figure S4). These characteristics included mean elevation, dominant aspect, latitude, mean annual rainfall, maximum monthly average rainfall difference, maximum monthly temperature difference, number of species and stem density. These also had no significant relationships with the residuals of the significant models listed above. It is clear from this that the main effect on the xPODs came from environmental heterogeneity.
4. Discussion
This study was designed to test contrasting predictions of the neutral and niche theories about spatial structure in tropical rainforests. We have shown here that the niche theory's prediction that the spatial overlap of species should vary with physical environmental heterogeneity is supported, in a test involving 1 741 632 spatially mapped woody plants and 2077 species, in 14 plots located on two continents. This result is not predicted by neutral theory, which suggests that no systematic relationship between species overlap and environmental heterogeneity exists. We conclude that niche differentiation is widespread and that its spatial effects increase in strength as environmental heterogeneity increases.
Datasets used in this study span almost the entire geographical range of tropical forests, and vary greatly in their elevation, rainfall, seasonality and disturbance regimes, each of which is known or expected to have profound consequences for tree communities [35,36]. The clear relationship we found between spatial overlap of species as measured by the xPOD and environmental heterogeneity, despite the biogeographic and environmental differences, suggests that niche differentiation linked to topography is a pervasive property of tree species communities in tropical rainforests. It is important to note that these results do not imply a relationship between environmental heterogeneity and species richness, because the latter is subject to other strong influences related to the size of the regional species pool, climate, elevation, latitude and (non-neutral) evolutionary processes [37]. The results are consistent, however, with the hypothesis that topographic niche differentiation leads to greater variability in species’ spatial overlaps, thus helping to stabilize species coexistence, in more heterogeneous sites. While we cannot rule out the possibility that other factors associated with topographic heterogeneity are responsible for our findings, and that these may be neutral or non-neutral in nature, the lack of evidence for such factors leads us to identify niche differentiation as the most parsimonious explanation.
The standard deviation of xPODs was strongly positively related to the within-plot elevation range and standard deviation of elevation at both species abundance thresholds. Insignificant positive relationships were also found with average slope and the surface to planimetric area ratio, as was a negative relationship with the proportion of convex cells that became significant under an increased species abundance threshold. The relationship with within-plot elevation range is perhaps the most intuitive, apparently relating directly to the spatial distribution of species via their environmental niches. As the elevation ranges increased, species were more restricted to particular areas of the plots where their niche requirements were satisfied, producing both positive overlaps with the species that had similar requirements and negative overlaps (separation) with the species that had dissimilar requirements. It is important to note that all of the plots included here contain reasonably regular gradients between extremes of elevation, with none containing, for example, two relatively homogeneous areas separated by very steep ground (which might be expected to give a bimodal xPOD distribution). Given this, the relationship between spatial structure and elevation range is as expected under niche differentiation, with species separating out across an elevation gradient according to environmental characteristics and the species’ environmental preferences. This also conforms to previous findings of changes in tropical rainforest species composition along single altitudinal gradients at small scales [38] and large scales [39].
The remaining environmental properties are functions of both within-plot elevation range and roughness, with the exception of the proportion of convex cells, which is not sensitive to range. The positive relationships between xPOD standard deviation and elevation standard deviation and average slope confirm the effect of total elevation range, as both properties are maximized in the plots with the greatest total range. The negative relationship between xPOD standard deviation and the proportion of convex cells suggests that the ‘roughness’ of the environment is also, as expected, a determinant of spatial structure. In this case, the scale of physical variation appears to have determined the spatial extent of niche, and hence species overlap, with species in the roughest environments being more mixed than those on smooth ground because of the proximity of different niches. As such, these relationships together provide a consistent picture of strong niche differentiation along elevation gradients.
We are not suggesting that elevation is directly responsible for the spatial overlaps of species. A number of environmental variables are likely to be correlated with elevation, such as soil nutrient and water availability, and light regimes [34,40–44]. Each of these might vary closely with elevation, and so any or all could be responsible for the observed effects. Furthermore, their relationship with topography may not be constant across sites, suggesting that considerable scope exists for niche differentiation beyond that which we identify here [44]. As a result, the number of habitats (and hence potential diversity) is not necessarily maximized in the most topographically heterogeneous plots. In addition, the lack of an effect of aspect perhaps indicates that light regimes are either largely independent of aspect (being more related to aspect-independent disturbances and canopy gaps, for example) or that their influence is limited to certain sites. Nor does spatial structure on the plots correlate with described disturbance regimes, although these are hard to quantify (see the electronic supplementary material, table S1).
We predicted that the signals of niche differentiation would be stronger among adult trees, because the inherent stochasticity in gap formation, seed arrival and germination means that recruitment may be effectively neutral despite any niche differentiation at early life stages [31]. Although none of our analyses include seedlings (the minimum dbh threshold being 1 cm), we still expect the association of trees and environments that are favourable to them to increase as they grow [29,30,45]. Instead, the relationships we find are strongest when all trees belonging to species with at least 100 individuals are included, and not when our analysis is restricted to adult trees. This may be because environmental factors exert a similar influence on young trees as on adults, so that niche effects are established by the time a tree's diameter reaches 1 cm [46,47], or because limited dispersal around adult trees simply leads to a reinforcement of the existing, environmentally driven spatial pattern. It is also possible that the loss of information when a higher dbh threshold is used leads to more noise in the signals, which would explain the fact that relationships are less clear under higher abundance thresholds (see the electronic supplementary material, table S2). This would be exacerbated if rare species were more strongly specialized to particular niches [48].
Previously, mixed evidence has been found for niche differentiation in the plots that we have included here. Neutral speciation and dispersal processes have been regularly found to account for at least some observed spatial structure [17,29,49], and it has been suggested that niche differentiation can be found for a minority of species [25], or only at particular spatial scales [21]. Niche differentiation has been identified most clearly in forests with greater amounts of physical heterogeneity. For example, 80 per cent of species in the highly heterogeneous Gutianshan plot are associated with particular soil properties [49], and most species in Xishuangbanna have associations with several environmental factors that increase with plant age [32]. However, Kraft & Ackerly [50] found widespread niche differentiation in the environmentally homogeneous Yasuni plot at relatively small scales, and Valencia et al. [26] and Metz [47] also identified habitat associations here. Evidence of niche differentiation has been found among species at Pasoh [51], and associations with topographic habitats at Sinharaja [4,29], but little evidence has been found for them at Mudumalai [52].
It is difficult to draw broad conclusions from the above studies because they used different methods, considered different variables, proportions of the populations and areas of each plot, and looked for niche differentiation on different axes. Our approach, by contrast, integrated datasets from plots under different biogeographic conditions to examine the trend across all communities. This allowed us not only to test the compatibility of spatial patterns with the predictions of neutral theory at large scales, but also to assess how the strength of niche differentiation varied with community-scale environmental heterogeneity. Our results are consistent with the more restricted comparisons of several plots that have previously identified spatial signals of environmental structuring or deterministic coexistence mechanisms [29,43–45,53], suggesting that neutral theory alone cannot account for observed variation in spatial structure.
We also find that the signal of topographical niche differentiation increases in strength with environmental heterogeneity, being strongest in plots such as Lienhuachih and Dinghushan and weakest in Yasuni and Palanan. Additional processes, whether neutral or related to other effects (such as the Janzen–Connell effect, which our findings do not take account of), may be occurring in the plots, as may niche differentiation in ways that we cannot detect with current data (e.g. temporally, at smaller scales, or at early life stages) [46,54,55]. A parsimonious interpretation of our observation of changes in spatial structure with environmental heterogeneity over a wide sample of biogeographic conditions within the range of tropical forests is that the increasing variability in spatial overlaps with increasing heterogeneity stems from niche differentiation of the species. We can conclude that environmental heterogeneity is an important driver of spatial differentiation and may contribute to stabilizing species coexistence in tropical rainforests, especially in heterogeneous environments.
Acknowledgements
We are grateful for the assistance of Yu-Wen Pan, Sandeep Pulla, Hugo Romero-Saltos and anonymous referees who provided helpful comments on the manuscript. The census and topographic data used here may be accessed directly via individual plot Principal Investigators.
Funding statement
The CTFS plots were individually supported from a number of sources, details of which are given in the electronic supplementary material, text S2. C.B. was financially supported by a Microsoft PhD Scholarship.
References
- 1.Ashton PS. 1969. Speciation among tropical forest trees: some deductions in the light of recent evidence . Biol. J. Linn. Soc. 1, 155–196 10.1111/j.1095-8312.1969.tb01818.x (doi:10.1111/j.1095-8312.1969.tb01818.x) [DOI] [Google Scholar]
- 2.Chesson P. 2000. Mechanisms of maintenance of species diversity . Annu. Rev. Ecol. Syst. 31, 343–366 10.1146/annurev.ecolsys.31.1.343 (doi:10.1146/annurev.ecolsys.31.1.343) [DOI] [Google Scholar]
- 3.Kobe RK. 1999. Light gradient partitioning among tropical tree species through differential seedling mortality and growth . Ecology 80, 187–201 10.1890/0012-9658(1999)080[0187:LGPATT]2.0.CO;2 (doi:10.1890/0012-9658(1999)080[0187:LGPATT]2.0.CO;2) [DOI] [Google Scholar]
- 4.Gunatilleke CVS, Gunatilleke IAUN, Esufali S, Harms KE, Ashton PMS, Burslem DFRP, Ashton PS. 2006. Species–habitat associations in a Sri Lankan dipterocarp forest . J. Trop. Ecol. 22, 371. 10.1017/S0266467406003282 (doi:10.1017/S0266467406003282) [DOI] [Google Scholar]
- 5.Andersen KM, Turner BL, Dalling JW. 2010. Soil-based habitat partitioning in understorey palms in lower montane tropical forests . J. Biogeogr. 37, 278–292 10.1111/j.1365-2699.2009.02192.x (doi:10.1111/j.1365-2699.2009.02192.x) [DOI] [Google Scholar]
- 6.Jones MM, Szyska B, Kessler M. 2011. Microhabitat partitioning promotes plant diversity in a tropical montane forest . Glob. Ecol. Biogeogr. 20, 558–569 10.1111/j.1466-8238.2010.00627.x (doi:10.1111/j.1466-8238.2010.00627.x) [DOI] [Google Scholar]
- 7.Keppel G, Tuiwawa MV, Naikatini A, Rounds IA. 2011. Microhabitat specialization of tropical rain-forest canopy trees in the Sovi Basin, Viti Levu, Fiji Islands . J. Trop. Ecol. 27, 491. 10.1017/S0266467411000241 (doi:10.1017/S0266467411000241) [DOI] [Google Scholar]
- 8.Wright SJ. 2002. Plant diversity in tropical forests: a review of mechanisms of species coexistence . Oecologia 130, 1–14 [DOI] [PubMed] [Google Scholar]
- 9.Gravel D, Guichard F, Hochberg ME. 2011. Species coexistence in a variable world . Ecol. Lett. 14, 828–839 10.1111/j.1461-0248.2011.01643.x (doi:10.1111/j.1461-0248.2011.01643.x) [DOI] [PubMed] [Google Scholar]
- 10.Bell G. 2000. The distribution of abundance in neutral communities . Am. Nat. 155, 606–617 10.1086/303345 (doi:10.1086/303345) [DOI] [PubMed] [Google Scholar]
- 11.Hubbell SP. 2001. The unified neutral theory of biodiversity and biogeography, 1st edn, p. 375 Princeton, NJ: Princeton University Press [Google Scholar]
- 12.Chisholm RA, Pacala SW. 2010. Niche and neutral models predict asymptotically equivalent species abundance distributions in high-diversity ecological communities . Proc. Natl Acad. Sci. USA 107, 15 821–15 825 10.1073/pnas.1009387107 (doi:10.1073/pnas.1009387107) [DOI] [PMC free article] [PubMed] [Google Scholar]
- 13.Ruokolainen L, Ranta E, Kaitala V, Fowler MS. 2009. When can we distinguish between neutral and non-neutral processes in community dynamics under ecological drift? Ecol. Lett. 12, 909–919 10.1111/j.1461-0248.2009.01346.x (doi:10.1111/j.1461-0248.2009.01346.x) [DOI] [PubMed] [Google Scholar]
- 14.Du X, Zhou S, Etienne RS. 2011. Negative density dependence can offset the effect of species competitive asymmetry: a niche-based mechanism for neutral-like patterns . J. Theor. Biol. 278, 127–134 10.1016/j.jtbi.2011.03.003 (doi:10.1016/j.jtbi.2011.03.003) [DOI] [PubMed] [Google Scholar]
- 15.Law R, Illian JB, Burslem DFRP, Gratzer G, Gunatilleke CVS, Gunatilleke IAUN. 2009. Ecological information from spatial patterns of plants: insights from point process theory . J. Ecol. 97, 616–628 10.1111/j.1365-2745.2009.01510.x (doi:10.1111/j.1365-2745.2009.01510.x) [DOI] [Google Scholar]
- 16.Condit R, et al. 2002. Beta-diversity in tropical forest trees . Science 295, 666–669 10.1126/science.1066854 (doi:10.1126/science.1066854) [DOI] [PubMed] [Google Scholar]
- 17.Seidler TG, Plotkin JB. 2006. Seed dispersal and spatial pattern in tropical trees . PLoS Biol. 4, e344. 10.1371/journal.pbio.0040344 (doi:10.1371/journal.pbio.0040344) [DOI] [PMC free article] [PubMed] [Google Scholar]
- 18.Brown C, Law R, Illian JB, Burslem DFRP. 2011. Linking ecological processes with spatial and non-spatial patterns in plant communities . J. Ecol. 99, 1402–1414 10.1111/j.1365-2745.2011.01877.x (doi:10.1111/j.1365-2745.2011.01877.x) [DOI] [Google Scholar]
- 19.Leibold MA, McPeek MA. 2006. Coexistence of the niche and neutral perspectives in community ecology . Ecology 87, 1399–1410 10.1890/0012-9658(2006)87[1399:COTNAN]2.0.CO;2 (doi:10.1890/0012-9658(2006)87[1399:COTNAN]2.0.CO;2) [DOI] [PubMed] [Google Scholar]
- 20.Chase JM, Myers JA. 2011. Disentangling the importance of ecological niches from stochastic processes across scales . Phil. Trans. R. Soc. B 366, 2351–2363 10.1098/rstb.2011.0063 (doi:10.1098/rstb.2011.0063) [DOI] [PMC free article] [PubMed] [Google Scholar]
- 21.Bin Y, Wang Z, Wang Z, Ye W, Cao H, Lian J. 2010. The effects of dispersal limitation and topographic heterogeneity on beta diversity and phylobetadiversity in a subtropical forest . Plant Ecol. 209, 237–256 10.1007/s11258-009-9708-y (doi:10.1007/s11258-009-9708-y) [DOI] [Google Scholar]
- 22.Muller-Landau HC, Wright SJ, Calderón O, Condit R, Hubbell SP. 2008. Interspecific variation in primary seed dispersal in a tropical forest . J. Ecol. 96, 653–667 10.1111/j.1365-2745.2008.01399.x (doi:10.1111/j.1365-2745.2008.01399.x) [DOI] [Google Scholar]
- 23.Réjou-Méchain M, Hardy OJ. 2011. Properties of similarity indices under niche-based and dispersal-based processes in communities. Am. Nat. 177, 589–604 10.1086/659627 (doi:10.1086/659627) [DOI] [PubMed] [Google Scholar]
- 24.Wiegand T, Gunatilleke S, Gunatilleke S. 2007. Species associations in a heterogeneous Sri Lankan dipterocarp forest . Am. Nat. 170, E77–E95 10.1086/521240 (doi:10.1086/521240) [DOI] [PubMed] [Google Scholar]
- 25.Harms KE, Condit R, Hubbell SP, Foster RB. 2001. Habitat associations of trees and shrubs in a 50-ha neotropical forest plot . J. Ecol. 89, 947–959 10.1111/j.1365-2745.2001.00615.x (doi:10.1111/j.1365-2745.2001.00615.x) [DOI] [Google Scholar]
- 26.Valencia R, et al. 2004. Yasuni forest dynamics plot, Ecuador. In Tropical forest diversity and dynamism: findings from a large-scale plot network (eds Losos EC, Leigh EGJ.), pp. 609–620 Chicago, IL: University of Chicago Press [Google Scholar]
- 27.Vincent G, Molino JF, Marescot L, Barkaoui K, Sabatier D, Freycon V, Roelens JB. 2011. The relative importance of dispersal limitation and habitat preference in shaping spatial distribution of saplings in a tropical moist forest: a case study along a combination of hydromorphic and canopy disturbance gradients . Ann. For. Sci. 68, 357–370 10.1007/s13595-011-0024-z (doi:10.1007/s13595-011-0024-z) [DOI] [Google Scholar]
- 28.Losos EC, Leigh EGJ. 2004. Tropical forest diversity and dynamism: findings from a large-scale plot network. Chicago, IL: University of Chicago Press [Google Scholar]
- 29.Condit R, et al. 2000. Spatial patterns in the distribution of tropical tree species . Science 288, 1414–1418 10.1126/science.288.5470.1414 (doi:10.1126/science.288.5470.1414) [DOI] [PubMed] [Google Scholar]
- 30.Bagchi R, et al. 2011. Spatial patterns reveal negative density dependence and habitat associations in tropical trees . Ecology 92, 1723–1729 10.1890/11-0335.1 (doi:10.1890/11-0335.1) [DOI] [PubMed] [Google Scholar]
- 31.Brokaw N, Busing RT. 2000. Niche versus chance and tree diversity in forest gaps . Trends Ecol. Evol. 15, 183–188 10.1016/S0169-5347(00)01822-X (doi:10.1016/S0169-5347(00)01822-X) [DOI] [PubMed] [Google Scholar]
- 32.Hu Y, Sha L, Blanchet FG, Zhang J, Tang Y, Lan G, Cao M. 2011. Dominant species and dispersal limitation regulate tree species distributions in a 20-ha plot in Xishuangbanna, southwest China . Oikos 121, 952–960 10.1111/j.1600-0706.2011.19831.x (doi:10.1111/j.1600-0706.2011.19831.x) [DOI] [Google Scholar]
- 33.Baddeley A, Turner R. 2005. SPATSTAT: an R package for analyzing spatial point patterns . J. Stat. Softw. 12, 1–42 [Google Scholar]
- 34.Baker TR, Swaine MD, Burslem DFRP. 2003. Variation in tropical forest growth rates: combined effects of functional group composition and resource availability . Perspect. Plant Ecol. Evol. Syst. 6, 21–36 10.1078/1433-8319-00040 (doi:10.1078/1433-8319-00040) [DOI] [Google Scholar]
- 35.Davidar P, Rajagopal B, Mohandass D, Puyravaud J, Condit R, Wright SJ, Leigh EG. 2007. The effect of climatic gradients, topographic variation and species traits on the beta diversity of rain forest trees . Glob. Ecol. Biogeogr. 16, 510–518 10.1111/j.1466-8238.2007.00307.x (doi:10.1111/j.1466-8238.2007.00307.x) [DOI] [Google Scholar]
- 36.Wiens JJ. 2011. The niche, biogeography and species interactions . Phil. Trans. R. Soc. B 366, 2336–2350 10.1098/rstb.2011.0059 (doi:10.1098/rstb.2011.0059) [DOI] [PMC free article] [PubMed] [Google Scholar]
- 37.Ricklefs RE, Renner SS. 2012. Global correlations in tropical tree species richness and abundance reject neutrality . Science 335, 464–467 10.1126/science.1215182 (doi:10.1126/science.1215182) [DOI] [PubMed] [Google Scholar]
- 38.Lieberman M, Lieberman D, Hartshorn GS, Peralta R. 1985. Small-scale altitudinal variation in lowland wet tropical forest vegetation . J. Ecol. 73, 505–516 10.2307/2260490 (doi:10.2307/2260490) [DOI] [Google Scholar]
- 39.Vázquez GJA, Givnish TJ. 1998. Altitudinal gradients in tropical forest composition, structure, and diversity in the Sierra de Manantlán . J. Ecol. 86, 999–1020 10.1046/j.1365-2745.1998.00325.x (doi:10.1046/j.1365-2745.1998.00325.x) [DOI] [Google Scholar]
- 40.Becker P, Rabenold PE, Idol JR, Smith AP. 1988. Water potential gradients for gaps and slopes in a Panamanian tropical moist forest's dry season . J. Trop. Ecol. 4, 173–184 10.1017/S0266467400002674 (doi:10.1017/S0266467400002674) [DOI] [Google Scholar]
- 41.Ashton MPS. 1992. Some measurements of the microclimate within a Sri Lankan tropical rainforest . Agric. For. Meteorol. 59, 217–235 10.1016/0168-1923(92)90094-K (doi:10.1016/0168-1923(92)90094-K) [DOI] [Google Scholar]
- 42.Daws MI, Mullins CE, Burslem DFRP, Paton SR, Dalling JW. 2002. Topographic position affects the water regime in a semideciduous tropical forest in Panama . Plant Soil 238, 79–89 10.1023/A:1014289930621 (doi:10.1023/A:1014289930621) [DOI] [Google Scholar]
- 43.John R, et al. 2007. Soil nutrients influence spatial distributions of tropical tree species . Proc. Natl Acad. Sci. USA 104, 864–869 10.1073/pnas.0604666104 (doi:10.1073/pnas.0604666104) [DOI] [PMC free article] [PubMed] [Google Scholar]
- 44.Baldeck CA, et al. 2013. Soil resources and topography shape local tree community structure in tropical forests . Proc. R. Soc. B 280, 20122532. 10.1098/rspb.2012.2532 (doi:10.1098/rspb.2012.2532) [DOI] [PMC free article] [PubMed] [Google Scholar]
- 45.Wills C, et al. 2006. Nonrandom processes maintain diversity in tropical forests . Science 311, 527–531 10.1126/science.1117715 (doi:10.1126/science.1117715) [DOI] [PubMed] [Google Scholar]
- 46.Comita LS, Engelbrecht BMJ. 2009. Seasonal and spatial variation in water availability drive habitat associations in a tropical forest . Ecology 90, 2755–2765 10.1890/08-1482.1 (doi:10.1890/08-1482.1) [DOI] [PubMed] [Google Scholar]
- 47.Metz MR. 2012. Does habitat specialization by seedlings contribute to the high diversity of a lowland rain forest? J. Ecol. 100, 969–979 10.1111/j.1365-2745.2012.01972.x (doi:10.1111/j.1365-2745.2012.01972.x) [DOI] [Google Scholar]
- 48.Brown JH. 1984. On the relationship between abundance and distribution of species . Am. Nat. 124, 255–279 10.1086/284267 (doi:10.1086/284267) [DOI] [Google Scholar]
- 49.Zhang LW, Mi XC, Shao HB, Ma KP. 2011. Strong plant–soil associations in a heterogeneous subtropical broad-leaved forest . Plant Soil 347, 211–220 10.1007/s11104-011-0839-2 (doi:10.1007/s11104-011-0839-2) [DOI] [Google Scholar]
- 50.Kraft NJB, Ackerly DD. 2010. Functional trait and phylogenetic tests of community assembly across spatial scales in an Amazonian forest . Ecol. Monogr. 80, 401–422 10.1890/09-1672.1 (doi:10.1890/09-1672.1) [DOI] [Google Scholar]
- 51.Debski I, Burslem DFRP, Palmiotto PA, Lafrankie JV, Lee HS, Manokaran N. 2002. Habitat preferences of Aporosa in two Malaysian forests: implications for abundance and coexistence . Ecology 83, 2005–2018 10.1890/0012-9658(2002)083[2005:HPOAIT]2.0.CO;2 (doi:10.1890/0012-9658(2002)083[2005:HPOAIT]2.0.CO;2) [DOI] [Google Scholar]
- 52.John R, Sukumar R. 2004. Distance- and density-related effects in a tropical dry deciduous forest tree community at Mudumalai, southern India. In Tropical forest diversity and dynamism: findings from a large-scale plot network (eds Losos EC, Leigh EG.), pp. 363–383 Chicago, IL: University of Chicago Press [Google Scholar]
- 53.Uriarte M, et al. 2010. Trait similarity, shared ancestry and the structure of neighbourhood interactions in a subtropical wet forest: implications for community assembly . Ecol. Lett. 13, 1503–1514 10.1111/j.1461-0248.2010.01541.x (doi:10.1111/j.1461-0248.2010.01541.x) [DOI] [PubMed] [Google Scholar]
- 54.Kanagaraj R, Wiegand T, Comita LS, Huth A. 2011. Tropical tree species assemblages in topographical habitats change in time and with life stage . J. Ecol. 99, 1441–1452 10.1111/j.1365-2745.2011.01878.x (doi:10.1111/j.1365-2745.2011.01878.x) [DOI] [Google Scholar]
- 55.Lin L, Comita LS, Zheng Z, Cao M. 2012. Seasonal differentiation in density-dependent seedling survival in a tropical rainforest. J. Ecol. 100, 905–914 10.1111/j.1365-2745.2012.01964.x (doi:10.1111/j.1365-2745.2012.01964.x) [DOI] [Google Scholar]
- 56.Jenness JS. 2004. Calculating landscape surface area from digital elevation models . Wildl. Soc. Bull. 32, 829–839 10.2193/0091-7648(2004)032[0829:CLSAFD]2.0.CO;2 (doi:10.2193/0091-7648(2004)032[0829:CLSAFD]2.0.CO;2) [DOI] [Google Scholar]