

Abstract
Body size affects nearly all aspects of organismal biology, so it is important to understand the constraints and dynamics of body size evolution. Despite empirical work on the macroevolution and macroecology of minimum and maximum size, there is little general quantitative theory on rates and limits of body size evolution. We present a general theory that integrates individual productivity, the lifestyle component of the slow–fast life-history continuum, and the allometric scaling of generation time to predict a clade's evolutionary rate and asymptotic maximum body size, and the shape of macroevolutionary trajectories during diversifying phases of size evolution. We evaluate this theory using data on the evolution of clade maximum body sizes in mammals during the Cenozoic. As predicted, clade evolutionary rates and asymptotic maximum sizes are larger in more productive clades (e.g. baleen whales), which represent the fast end of the slow–fast lifestyle continuum, and smaller in less productive clades (e.g. primates). The allometric scaling exponent for generation time fundamentally alters the shape of evolutionary trajectories, so allometric effects should be accounted for in models of phenotypic evolution and interpretations of macroevolutionary body size patterns. This work highlights the intimate interplay between the macroecological and macroevolutionary dynamics underlying the generation and maintenance of morphological diversity.
Keywords: slow–fast life-history continuum, evolutionary rate, metabolic theory of ecology, maximum body size, macroecology, mammal macroevolution
1. Introduction
A central issue in ecology, evolutionary biology and palaeontology is understanding the constraints on phenotypic evolution [1]. How fast organisms evolve in response to selection provides insight into important eco-evolutionary patterns, ranging from patterns of recovery from mass extinction events to the potential for modern species to adapt to global climate change [2–5]. While there is a large body of theoretical literature on rates of genetic and molecular evolution, it is still unclear how morphological, physiological and ecological traits influence the rates and trajectories of evolution of clades. Here, we explore the evolutionary implications of two important components of organismal biology that should impact rates and trajectories of evolution: the rate of biomass production of an individual and its generation time.
Generation time is an important constraint on evolution, because it determines how quickly genes are passed from one generation to another, and thus constrains how fast a lineage can evolve in absolute time. A century can represent a million generations of potential evolutionary change to the typical bacterium, and about one generation to a tree or giant tortoise. It follows that the maximum absolute rate of phenotypic evolution probably varies widely across lineages and species. The dependence of evolutionary rate on generation time is well documented from comparative analyses of DNA sequences ([6–10], but see [11,12]) and supported by evolutionary theory [7,13,14]. This provides the justification for measuring the rate of evolution in units that account for the effect of generation time, such as in units of haldanes [15–20] or in number of generations [5].
An important determinant of generation time is an individual's mass-specific production rate, the quantity of biomass it produces per unit time, divided by its body mass. We refer to this as individual productivity. This trait is particularly important because it provides an integrative measure of the rate at which an organism acquires, assimilates, transforms and allocates resources to growth and reproduction [21]. Variation in traits such as individual productivity has been discussed in terms of a slow–fast life-history continuum [22–25]. ‘Slow’ and ‘fast’ refer to the speed at which organisms progress through their life histories, ranging from slow organisms that take years to reach first reproduction and reproduce only every few years, to fast organisms that complete their life cycle in weeks, days or even hours. Much of the variation among species in life-history traits can be attributed to body size by allometric scaling, but once these effects are accounted for, an order of magnitude of residual variation still remains (figure 1a). This residual variation has been ascribed to the ‘lifestyle’ component of the slow–fast life-history continuum—in other words, the slow–fast lifestyle continuum—where the lifestyle of an organism comprises the ecological, morphological and physiological traits that influence how resources are gathered from the environment and allocated to fitness components. Lifestyle is therefore an important biological contributor to this residual variation in individual productivity [26,27]. The quality and/or abundance of the resource an organism has evolved to consume can influence its rate of energy intake and allocation to reproduction. At opposite ends of this lifestyle spectrum in mammals are primates and whales, which have low and high individual productivities for their body sizes, respectively. While it is clear intuitively that generation time, lifestyle and individual productivity might influence phenotypic evolution; currently, there is no theoretical framework for how these components interact to affect evolutionary trajectories of important traits.
Figure 1.

Schematic of theory. (a) Mass-specific production rate B (diagonal lines) plotted against body mass for slow and fast lifestyle groups. The logarithm of the normalization coefficient B0 is given by the intercept with the y-axis. The dashed horizontal line represents the critical death rate referred to in predicting maximum body sizes. (b) Exponential trajectories of body mass in biological time (generations) for adaptive radiations involving a constant per-generation rate of evolution until an asymptotic maximum body size is reached. When the per-generation rate of evolution, α, is the same for the two groups, the trajectories of log body mass plotted against time in generations have the same initial slope. (c) These trajectories of log body mass are decelerating in chronological time because generation time increases with increasing size. The two curves represent the fast and slow lifestyles shown in (a) and (b), which have the same initial body mass but attain different maximum sizes. (d) By scaling the size axis as M1/4, trajectories of M1/4 plotted in chronological time are initially straight lines with slopes providing a measure of evolutionary rate, as given by equation (2.5). In chronological time, both the slope and maximum for fast, productive lifestyles are higher than those for slow, unproductive lifestyles.
Body size is an ideal phenotypic trait for theoretically modelling and empirically testing the effects of generation time, lifestyle and productivity. Almost all characteristics of an organism are related in some way to body size, so it is particularly important to understand the factors affecting its evolution. There is a sizeable literature on the evolution of body size, most of which focuses on a specific community, clade or geological epoch [5,28–35]. A much smaller body of work addresses the macroecology and macroevolution of minimum and maximum body size [36–42]. So far, however, a general quantitative theory on rates and ecological limits of body size evolution is lacking. As a result, two important questions regarding body size evolution are still unanswered: (i) what general factors determine the rate and trajectory of evolution of body size and (ii) why do clades differ in the maximum body size they attain? Here, we develop a general theory for the effects of the allometric scaling and lifestyle components of the slow–fast life-history continuum on the rate of evolution and asymptotic maximum body size of a clade. We then test our predictions using a dataset on the maximum body size of mammals as they radiated during the Cenozoic following the extinction of the non-avian dinosaurs at the Cretaceous–Palaeogene (K-Pg) mass extinction event.
2. Theory and results
(a). The rate and trajectory of body size evolution
(i). Theoretical development
Biological rates, B, such as mass-specific metabolic rate, birth rate and mass-specific production rate or productivity, typically scale with body mass, M, as
| 2.1 |
where B0 is a normalization coefficient that varies between lifestyles and taxonomic groups and is a predictable function of body temperature [43], and the allometric scaling exponent β is often approximately one-fourth in plants and animals (figure 1a; [44–46]). Like other biological rates, the rate of evolution should decrease with increasing size, scaling as ≈−¼ power of mass [6,7,47]. This is justified on a theoretical basis because the rate of incorporation of a mutation should scale inversely with generation time, G, which scales as
| 2.2 |
where k is a constant of proportionality [45,48,49]. The allometric scaling, phylogenetic and lifestyle components of variation can be quantified by fitting equation (2.1) or (2.2) to biological rate or generation time data plotted on logarithmic axes for different clades or groups of species sharing similar lifestyles (figure 1a). The slope β determines the size-dependence of biological rates or generation time [46]. The size-independent lifestyle effect is given by the intercept or normalization coefficient B0, with higher values of B0 reflecting lifestyles that allow for greater individual productivity, shorter generation times and faster reproductive rates—thereby quantifying a group's position along the lifestyle component of the slow–fast life-history continuum.
Evolutionary changes in body size on a per-generation basis can be expressed as (1/M)(dM/dtg) = α, where α is the per-generation rate constant and tg is time measured in generations. Changes with respect to chronological time, t, are obtained by dividing by generation time and substituting in the generation time allometry, i.e. (1/M)/(dM/dt) = (1/M)/((dM/dtg)((dtg/dt) = (1/M) (dM/dtg)((1/G) = (αB0/k)M−β))), which gives
| 2.3 |
Equation (2.3) shows that all else being equal and as long as β > 0, evolutionary changes in body size in chronological time occur more slowly in larger organisms.
Integrating equation (2.3) shows that the value of the allometric scaling exponent β has a profound effect on the shape of the evolutionary trajectory during diversifying radiations, assuming that the per-generation evolutionary rate (α) remains constant. If β were zero, mass would increase exponentially in chronological time. However, when β > 0, as typically occurs in animals and vascular plants, the increase is sub-exponential (figure 1b,c) and body mass depends on time as
| 2.4 |
where M0 is the initial body size. This equation also shows that the slope s of Mβ as a function of time provides a measure of evolutionary rate that accounts for the allometry of generation time (figure 1d). The slope s is
| 2.5 |
(ii). Predictions
Equations (2.4) and (2.5) make two testable predictions. (1) Equation (2.4) predicts that for evolutionary phases when body size is evolving at a constant rate per generation (figure 1b), Mβ with β ≈ ¼ should depend linearly on time in plants and animals (figure 1d). (2) Equation (2.5) predicts that more productive, faster lifestyles should be able to evolve at a faster rate in chronological time: the rate of evolution s is proportional to the mass-specific production normalization constant B0, which quantifies a group's position along the slow–fast lifestyle continuum.
(iii). Results
The theory we developed here should apply to clades during a diversifying phase of body size evolution. The radiation of placental mammals provides a natural experiment to evaluate our theory. After the K-Pg event that exterminated the non-avian dinosaurs, the major clades diversified in size both within and among clades. Starting from small ancestors, maximum body size of most clades exhibited a decelerating increase that ultimately levelled off (figure 1b; [5,34]). Recently, Evans et al. [5] showed that accounting for the body size effect on generation time reveals that the maximum size of each clade increased at an approximately constant rate per generation until ultimately reaching an asymptote, as in figure 1d.
We used the latest version of the database (Mammoth v. 1.1) analysed in Smith et al. [34] and Evans et al. [5] to test our two predictions (see the electronic supplementary material, appendix table S1). As predicted, after accounting for allometric effects using equation (2.4) with β = 1/4, clade maximum body mass (M1/4) increased approximately linearly with time in the eight clades of mammals with sufficient data (figure 2). In general, linear regressions provided good fits to the data, indicating that the rate of maximum size evolution is approximately invariant with time within each clade during these diversifying phases (all R2 > 0.74, data in appendix table S1). To test prediction 2, we plotted the rate of evolution as a function of the normalization coefficient for individual productivity (figure 3). Rates of evolution were estimated by the slopes of the fitted lines in figure 2 and modern-day normalization coefficients for individual productivity for the eight lineages were taken from Sibly & Brown ([27]; data in electronic supplementary material, appendix table S2; see appendix for details). As predicted, lineages with faster lifestyles had higher maximal rates of evolution (R2 = 0.62, p = 0.021).
Figure 2.
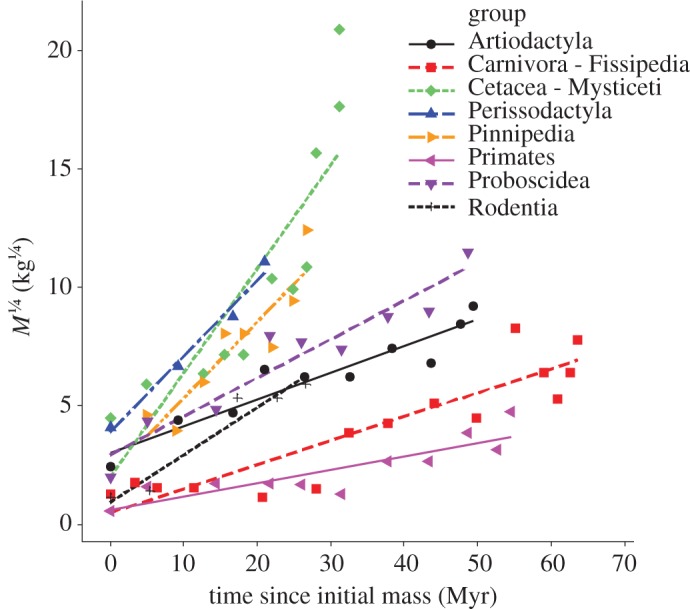
The increasing phase of the maximum body mass of mammal clades during the Cenozoic. The quarter-power scaled body mass (M1/4, in kg1/4) normalizes for generation time allometry so that a linear relationship indicates an invariant per-generation rate of evolution and the slope of the regression line provides a measure of the rate of evolution. The x-axis is the time since the initiation of a clade's increasing phase of size evolution. Note that the faster increasing clades tend to attain higher maximum body sizes, as predicted by equation (2.6). All R2 are greater than 0.74.
Figure 3.
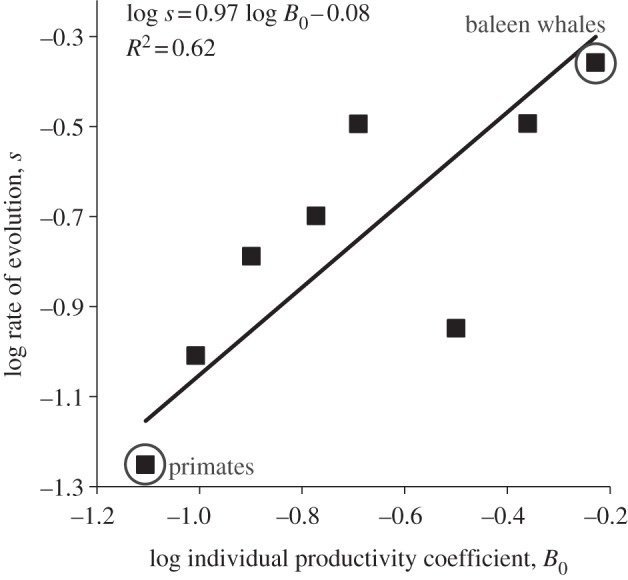
The effects of the individual productivity of a lifestyle, as quantified by a taxon's normalization coefficient B0, on the rate of size evolution s in mammalian clades. The data are shown in the electronic supplementary material, appendix table S2. Theory predicts a positive linear relationship (equation (2.5)) between a clade's evolutionary rate and its mass-specific production normalization coefficient, which quantifies a clade's position along the slow–fast lifestyle continuum. The data points for the primates and baleen whales are circled.
(b). Maximum size
(i). Theoretical development
As shown in figure 1a, species with slower lifestyles have lower individual productivities for their body size and thus lower population growth rates and reduced capacities to recover from environmental perturbations. Individual productivity also varies allometrically, decreasing as body size increases (figure 1a). Eventually, there is a theoretical maximal body size for each clade where productivity is so low it can only just offset mortality (figure 1a). We model this situation by assuming that persisting species must be sufficiently productive that they can replace losses occurring at some minimum death rate Dcrit when body mass is at its maximum, Mmax (see the electronic supplementary material, appendix for details). Production rate is given by equation (2.1), and setting this equal to Dcrit when M = Mmax gives 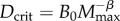 and so
| 2.6 |
(ii). Predictions
Equation (2.6) makes the direct testable prediction that the maximum size reached by a clade varies with individual productivity. More productive lifestyles are able to attain larger maximum sizes, or more quantitatively, maximum body size is positively correlated with log B0.
(iii). Results
We used the Mammoth v.1.1 data [5,34] to test our prediction. A precise correlation was not necessarily expected from these data because a clade may not exhibit its theoretical maximum body size. This may be due to incomplete sampling in the fossil record. It may also occur because when stochastic extinction removes the largest species in a clade, there will inevitably be a time lag before another species can evolve to reach the maximum possible size. Nevertheless, as shown in figure 4, our prediction was supported: maximum body masses of the eight extant clades of mammals were positively correlated with lifestyle speed as indexed by the normalization coefficient for productivity (R2 = 0.60, p = 0.024).
Figure 4.
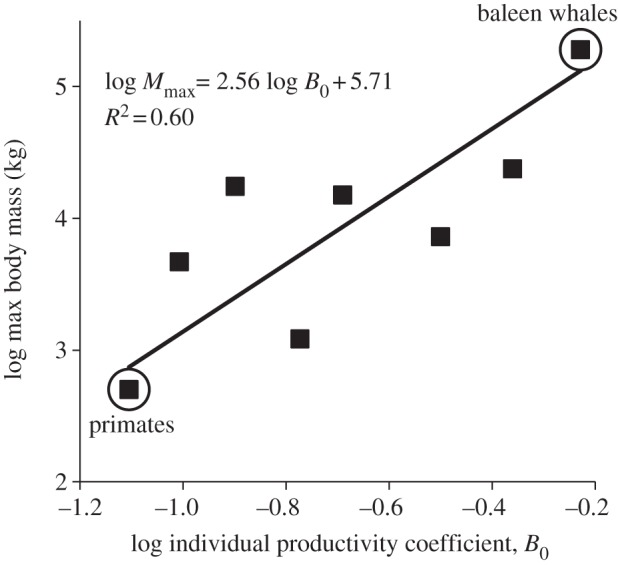
The effect of the slow–fast lifestyle continuum on the maximum body mass evolved within mammalian orders. Theory predicts a positive linear relationship (equation (2.6)) between an order's evolved log maximum body mass and its log mass-specific production normalization coefficient, which quantifies an order's position along the slow–fast lifestyle continuum. The data points for the primates and baleen whales are circled.
3. Discussion
Our theory clearly demonstrates the crucial role of allometry and individual productivity in determining the rate and trajectory of body size evolution and the maximum size animals achieve. When clades have similar rates of evolution per generation, they have similarly sloped linear trajectories of body mass evolution when plotted in biological time (figure 1b). However, as clades vary along the slow–fast lifestyle continuum, the body masses of those with lifestyles having higher mass-specific production coefficients (B0) increase faster than those of clades with less productive lifestyles when plotted in chronological time (figure 1c,d). Clades with faster lifestyles also reach higher maximum sizes, because their higher individual productivity allows them to sufficiently replace mortality losses even at larger body sizes. Therefore, the lifestyle component of the slow–fast life-history continuum affects both the rate of evolution in chronological time and maximum body mass.
The evolution of size in baleen whales and primates provides useful examples for how lifestyle can play into the evolutionary dynamics of body size. Of all the mammalian lineages, baleen whales have the highest mass-specific production coefficient and, as predicted, the highest chronological rate of evolution and largest maximum body mass. The high mass-specific production coefficient of baleen whales is probably a consequence of their ecological niches and lifestyle—feeding on abundant, reliable food sources in highly productive marine environments [27]. The evolution of a bulk-feeding lifestyle and baleen plates allowed the ingestion of entire schools of planktonic invertebrates or small fish, fuelling the whales' high-energy requirements and individual productivities [50,51]. Our theory illustrates how the adoption of this productive lifestyle allowed the clade to achieve high individual productivity for their body size and thus reach large sizes. An interesting question is whether before human hunting their lifestyle also resulted in lower critical death rates, which our theory predicts can also contribute to the evolution of extreme maximum size. In contrast with baleen whales, primates—well recognized for being at the slow end of the slow–fast lifestyle continuum [22,27]—have the lowest mass-specific production coefficient, lowest chronological rate of body size evolution, and lowest evolved maximum body size of the lineages examined.
While we have focused on the consequences of the slow–fast life-history continuum for body size evolution, the theory has implications for understanding other aspects of evolutionary history. Megafaunal extinctions, such as the Late Pleistocene extinction of large mammals, provide one example. Another example is extinction due to fishing of large fish with slow lifestyles [52]. In both cases, extinction of larger animals resulted from an increase in the death rate. Our theory provides simple predictions for how decreases in individual productivity or temporary increases in death rates should affect the maximum body mass that can persist. For example, if the death rate is raised in figure 1a, elevation of the horizontal dashed line reduces Mmax. Equation (2.6) suggests that a twofold increase in mortality rate would lead to a 16-fold reduction in maximum body mass. The theory complements more detailed models of megafaunal extinctions [53] and efforts to untangle the diverse causes of the Late Pleistocene extinction event, which likely largely resulted from increased mortality rates because of human hunting [54]. Our approach suggests that relatively small changes in mortality rates may have differentially strong impacts on large species and could result in size-biased extinctions, both in the past and as human impacts on biota increase in the future.
In addition to providing a context for understanding size-biased extinction events, our theory may have implications for understanding evolutionary rates and trajectories more generally. Palaeontologists have often expected size to have the potential to change exponentially in chronological time [42,55]. However, our theory suggests that the potential for exponential evolutionary change in size over chronological time only occurs if mass-specific biological rates and biological times such as generation time are invariant of size. When mass-specific biological rates scale positively, which has been observed in heterotrophic bacteria [46], steep super-exponential changes in body size are expected (see the electronic supplementary material, appendix for details). When mass-specific biological rates scale negatively with body size, the evolutionary trajectory of body size should change sub-exponentially in a power-law-like fashion, with rates of change decreasing with increasing size. Such a decelerating curve could be incorrectly interpreted as indicating decreasing per-generation rates of evolution, highlighting the importance of appropriately transforming body mass when examining in chronological time the size evolution of organisms. Thus, biological scaling exponents can fundamentally alter the shape of evolutionary trajectories of body size in diversifying lineages (see also [56]), and so allometric effects must be considered in interpretations of these macroevolutionary patterns.
Allometry and the slow–fast lifestyle continuum have important implications not only for understanding trajectories of past evolutionary dynamics, but also for how comparative methods are used to study body size evolution, macroecology and allometric scaling. In cases where a comparative study includes species that span multiple orders of magnitude of variation in body size, the accuracy of phylogenetic comparative methods and the derived interspecific allometric scaling exponents could likely be improved by accounting for the allometry of evolutionary rate. One approach is to use branch lengths derived from sequence data instead of absolute divergences times, since allometric scaling should have similar effects on rates of trait evolution and molecular sequence evolution. Another approach would be to use a Brownian motion model in which the change in body size per unit time scales with body mass as in equation (2.3) or in which Mβ is used instead of log M, as is common practice for comparative analyses, such as phylogenetic independent contrasts. Such a model would also provide an alternative prediction for how clade maximum body size changes as a function of chronological time under a random walk model of evolution. This model would contrast with the mathematical predictions developed here for the non-random changes in body size that might be expected for diversifying phases of evolution (as supported in mammals by Evans [5]).
Perhaps most importantly, by integrating the lifestyle of organisms with their evolutionary dynamics, the theory suggests a two-way interaction between ecology and evolution. Lifestyles and niches have consequences for evolutionary rates and the maximum sizes attained by different clades; conversely, however, ecological niches and lifestyle have also been shaped by the historical contingencies of evolutionary diversification. Overall, this work highlights the intimate interplay between ecological and evolutionary dynamics at broad scales that affects the macroevolution and macroecology of organisms from microbes to whales.
Acknowledgements
We thank Chris Venditti, P. David Polly and an anonymous reviewer for helpful feedback. This study was supported by National Science Foundation Grant Integrating Macroecological Pattern and Processes across Scales Research Coordination Network DEB 0541625 (to F.A.S., S.K.L. and S.K.M.E., principal investigators). Financial support to J. Okie was provided by University of New Mexico's Program in Interdisciplinary Biological and Biomedical Sciences, which is funded by the Howard Hughes Medical Institute under the National Institute of Biomedical Imaging and Bioengineering Interfaces Initiative; an Exploration Postdoctoral Fellowship from Arizona State University's School of Earth and Space Exploration; and a Postdoctoral Fellowship from the National Aeronautics and Space Administration Postdoctoral Program with the NASA Astrobiology Institute, which is administered by Oak Ridge Associated Universities. This paper is IMPPS RCN publication no. 19.
References
- 1.Uyeda JC, Hansen TF, Arnold SJ, Pienaar J. 2011. The million-year wait for macroevolutionary bursts. Proc. Natl Acad. Sci. USA 108, 15 908–15 913 10.1073/pnas.1014503108 (doi:10.1073/pnas.1014503108) [DOI] [PMC free article] [PubMed] [Google Scholar]
- 2.Smith FA, Betancourt JL. 2006. Predicting woodrat (Neotoma) responses to anthropogenic warming from studies of the palaeomidden record. J. Biogeogr. 33, 2061–2076 10.1111/j.1365-2699.2006.01631.x (doi:10.1111/j.1365-2699.2006.01631.x) [DOI] [Google Scholar]
- 3.Sinervo B, et al. 2010. Erosion of lizard diversity by climate change and altered thermal niches. Science 328, 894–899 10.1126/science.1184695 (doi:10.1126/science.1184695) [DOI] [PubMed] [Google Scholar]
- 4.Coulson T, MacNulty DR, Stahler DR, Wayne RK, Smith DW. 2011. Modeling effects of environmental change on wolf population dynamics, trait evolution, and life history. Science 334, 1275–1278 10.1126/science.1209441 (doi:10.1126/science.1209441) [DOI] [PubMed] [Google Scholar]
- 5.Evans AR, et al. 2012. The maximum rate of mammal evolution. Proc. Natl Acad. Sci. USA 109, 4187–4190 10.1073/pnas.1120774109 (doi:10.1073/pnas.1120774109) [DOI] [PMC free article] [PubMed] [Google Scholar]
- 6.Martin AP, Palumbi SR. 1993. Body size, metabolic rate, generation time, and the molecular clock. Proc. Natl Acad. Sci. USA 90, 4087–4091 10.1073/pnas.90.9.4087 (doi:10.1073/pnas.90.9.4087) [DOI] [PMC free article] [PubMed] [Google Scholar]
- 7.Gillooly JF, Allen AP, West GB, Brown JH. 2005. The rate of DNA evolution: effects of body size and temperature on the molecular clock. Proc. Natl Acad. Sci. USA 102, 140–145 10.1073/pnas.0407735101 (doi:10.1073/pnas.0407735101) [DOI] [PMC free article] [PubMed] [Google Scholar]
- 8.Nabholz B, Glémin S, Galtier N. 2008. Strong variations of mitochondrial mutation rate across mammals—the longevity hypothesis. Mol. Biol. Evol. 25, 120–130 10.1093/molbev/msm248 (doi:10.1093/molbev/msm248) [DOI] [PubMed] [Google Scholar]
- 9.Galtier N, Blier PU, Nabholz B. 2009. Inverse relationship between longevity and evolutionary rate of mitochondrial proteins in mammals and birds. Mitochondrion 9, 51–57 10.1016/j.mito.2008.11.006 (doi:10.1016/j.mito.2008.11.006) [DOI] [PubMed] [Google Scholar]
- 10.Bromham L, Bromham L. 2011. The genome as a life-history character: why rate of molecular evolution varies between mammal species. Phil. Trans. R. Soc. B 366, 2503–2513 10.1098/rstb.2011.0014 (doi:10.1098/rstb.2011.0014) [DOI] [PMC free article] [PubMed] [Google Scholar]
- 11.Kumar S, Subramanian S. 2002. Mutation rates in mammalian genomes. Proc. Natl Acad. Sci. USA 99, 803–808 10.1073/pnas.022629899 (doi:10.1073/pnas.022629899) [DOI] [PMC free article] [PubMed] [Google Scholar]
- 12.Ochman H, Wilson AC. 1987. Evolution in bacteria: evidence for a universal substitution rate in cellular genomes. J. Mol. Evol. 26, 74–86 10.1007/BF02111283 (doi:10.1007/BF02111283) [DOI] [PubMed] [Google Scholar]
- 13.Lynch M. 1990. The rate of morphological evolution in mammals from the standpoint of the neutral expectation. Am. Nat. 136, 727–741 10.1086/285128 (doi:10.1086/285128) [DOI] [Google Scholar]
- 14.Gingerich PD. 1993. Quantification and comparison of evolutionary rates. Am. J. Sci. 293, 453–478 10.2475/ajs.293.A.453 (doi:10.2475/ajs.293.A.453) [DOI] [Google Scholar]
- 15.Haldane JBS. 1949. Suggestions as to quantitative measurement of rates of evolution. Evolution 3, 51–56 10.2307/2405451 (doi:10.2307/2405451) [DOI] [PubMed] [Google Scholar]
- 16.Gingerich PD. 1983. Rates of evolution: effects of time and temporal scaling. Science 222, 159–161 10.1126/science.222.4620.159 (doi:10.1126/science.222.4620.159) [DOI] [PubMed] [Google Scholar]
- 17.Gingerich PD. 2001. Rates of evolution on the time scale of the evolutionary process. Genetica 112, 127–144 10.1023/A:1013311015886 (doi:10.1023/A:1013311015886) [DOI] [PubMed] [Google Scholar]
- 18.Gingerich PD. 2009. Rates of evolution. Annu. Rev. Ecol. Evol. Syst. 40, 657–675 10.1146/annurev.ecolsys.39.110707.173457 (doi:10.1146/annurev.ecolsys.39.110707.173457) [DOI] [Google Scholar]
- 19.Roopnarine PD. 2003. Analysis of rates of morphologic evolution. Annu. Rev. Ecol. Evol. Syst. 34, 605–632 10.1146/annurev.ecolsys.34.011802.132407 (doi:10.1146/annurev.ecolsys.34.011802.132407) [DOI] [Google Scholar]
- 20.Polly PD. 2001. Paleontology and the comparative method: ancestral node reconstructions versus observed node values. Am. Nat. 157, 596–609 10.1086/320622 (doi:10.1086/320622) [DOI] [PubMed] [Google Scholar]
- 21.Ernest SK, et al. 2003. Thermodynamic and metabolic effects on the scaling of production and population energy use. Ecol. Lett. 6, 990–995 10.1046/j.1461-0248.2003.00526.x (doi:10.1046/j.1461-0248.2003.00526.x) [DOI] [Google Scholar]
- 22.Read AF, Harvey PH. 1989. Life history differences among the eutherian radiations. J. Zool. 219, 329–353 10.1111/j.1469-7998.1989.tb02584.x (doi:10.1111/j.1469-7998.1989.tb02584.x) [DOI] [Google Scholar]
- 23.Promislow DEL, Harvey PH. 1990. Living fast and dying young: a comparative analysis of life-history variation among mammals. J. Zool. 220, 417–437 10.1111/j.1469-7998.1990.tb04316.x (doi:10.1111/j.1469-7998.1990.tb04316.x) [DOI] [Google Scholar]
- 24.Bielby J, Mace GM, Bininda-Emonds ORP, Cardillo M, Gittleman JL, Jones KE, Orme CDL, Purvis A. 2007. The fast–slow continuum in mammalian life history: an empirical reevaluation. Am. Nat. 169, 748–757 10.1086/516847 (doi:10.1086/516847) [DOI] [PubMed] [Google Scholar]
- 25.Dobson FS, Oli MK. 2007. Fast and slow life histories of mammals. Ecoscience 14, 292–297 10.2980/1195-6860(2007)14[292:FASLHO]2.0.CO;2 (doi:10.2980/1195-6860(2007)14[292:FASLHO]2.0.CO;2) [DOI] [Google Scholar]
- 26.Dobson FS. 2007. Effects of body size and lifestyle on evolution of mammal life histories. Commentary. Proc. Natl Acad. Sci. USA 104, 17 565–17 566 10.1073/pnas.0708868104 (doi:10.1073/pnas.0708868104) [DOI] [PMC free article] [PubMed] [Google Scholar]
- 27.Sibly RM, Brown JH. 2007. Effects of body size and lifestyle on evolution of mammal life histories. Proc. Natl Acad. Sci. USA 104, 17 707–17 712 10.1073/pnas.0707725104 (doi:10.1073/pnas.0707725104) [DOI] [PMC free article] [PubMed] [Google Scholar]
- 28.Lenski RE, Travisano M. 1994. Dynamics of adaptation and diversification: a 10,000-generation experiment with bacterial populations. Proc. Natl Acad. Sci. USA 91, 6808–6814 10.1073/pnas.91.15.6808 (doi:10.1073/pnas.91.15.6808) [DOI] [PMC free article] [PubMed] [Google Scholar]
- 29.Jablonski D. 1997. Body-size evolution in Cretaceous molluscs and the status of Cope's rule. Nature 385, 250–252 [Google Scholar]
- 30.Alroy J. 1998. Cope's rule and the dynamics of body mass evolution in North American fossil mammals. Science 280, 731–734 10.1126/science.280.5364.731 (doi:10.1126/science.280.5364.731) [DOI] [PubMed] [Google Scholar]
- 31.Clauset A, Erwin DH. 2008. The evolution and distribution of species body size. Science 321, 399–401 10.1126/science.1157534 (doi:10.1126/science.1157534) [DOI] [PubMed] [Google Scholar]
- 32.Litchman E, Klausmeier CA, Yoshiyama K. 2009. Contrasting size evolution in marine and freshwater diatoms. Proc. Natl Acad. Sci. USA 106, 2665–2670 10.1073/pnas.0810891106 (doi:10.1073/pnas.0810891106) [DOI] [PMC free article] [PubMed] [Google Scholar]
- 33.McNab BK. 2009. Resources and energetics determined dinosaur maximal size. Proc. Natl Acad. Sci. USA 106, 12 184–12 188 10.1073/pnas.0904000106 (doi:10.1073/pnas.0904000106) [DOI] [PMC free article] [PubMed] [Google Scholar]
- 34.Smith FA, et al. 2010. The evolution of maximum body size of terrestrial mammals. Science 330, 1216–1219 10.1126/science.1194830 (doi:10.1126/science.1194830) [DOI] [PubMed] [Google Scholar]
- 35.Sookias RB, Benson RB, Butler RJ. 2012. Biology, not environment, drives major patterns in maximum tetrapod body size through time. Biol. Lett. 8, 674–677 10.1098/rsbl.2012.0060 (doi:10.1098/rsbl.2012.0060) [DOI] [PMC free article] [PubMed] [Google Scholar]
- 36.Marquet PA, Taper ML. 1998. On size and area: patterns of mammalian body size extremes across landmasses. Evol. Ecol. 12, 127–139 10.1023/A:1006567227154 (doi:10.1023/A:1006567227154) [DOI] [Google Scholar]
- 37.Burness GP, Diamond J, Flannery T. 2001. Dinosaurs, dragons, and dwarfs: the evolution of maximal body size. Proc. Natl Acad. Sci. USA 98, 14 518–14 523 10.1073/pnas.251548698 (doi:10.1073/pnas.251548698) [DOI] [PMC free article] [PubMed] [Google Scholar]
- 38.Okie JG, Brown JH. 2009. Niches, body sizes, and the disassembly of mammal communities on the Sunda Shelf islands. Proc. Natl Acad. Sci. USA 106, 19 679–19 684 10.1073/pnas.0901654106 (doi:10.1073/pnas.0901654106) [DOI] [PMC free article] [PubMed] [Google Scholar]
- 39.Boyer AG, Jetz W. 2010. Biogeography of body size in Pacific island birds. Ecography 33, 369–379 10.1111/j.1600-0587.2010.06315.x (doi:10.1111/j.1600-0587.2010.06315.x) [DOI] [Google Scholar]
- 40.Millien V, Gonzalez A. 2011. The maximal body mass–area relationship in island mammals. J. Biogeogr. 38, 2278–2285 10.1111/j.1365-2699.2011.02561.x (doi:10.1111/j.1365-2699.2011.02561.x) [DOI] [Google Scholar]
- 41.Smith FA, Lyons SK. 2011. How big should a mammal be? A macroecological look at mammalian body size over space and time. Phil. Trans. R. Soc. B 366, 2364–2378 10.1098/rstb.2011.0067 (doi:10.1098/rstb.2011.0067) [DOI] [PMC free article] [PubMed] [Google Scholar]
- 42.Trammer J. 2005. Maximum body size in a radiating clade as a function of time. Evolution 59, 941–947 [PubMed] [Google Scholar]
- 43.Gillooly JF, Brown JH, West GB, Savage VM, Charnov EL. 2001. Effects of size and temperature on metabolic rate. Science 293, 2248–2251 10.1126/science.1061967 (doi:10.1126/science.1061967) [DOI] [PubMed] [Google Scholar]
- 44.Brown JH, Gillooly JF, Allen AP, Savage VM, West GB. 2004. Toward a metabolic theory of ecology. Ecology 85, 1771–1789 10.1890/03-9000 (doi:10.1890/03-9000) [DOI] [Google Scholar]
- 45.Savage VM, Gillooly JF, Brown JH, West GB, Charnov EL. 2004. Effects of body size and temperature on population growth. Am. Nat. 163, 429–441 10.1086/381872 (doi:10.1086/381872) [DOI] [PubMed] [Google Scholar]
- 46.DeLong JP, Okie JG, Moses ME, Sibly RM, Brown JH. 2010. Shifts in metabolic scaling, production, and efficiency across major evolutionary transitions of life. Proc. Natl Acad. Sci. USA 107, 12 941–12 945 10.1073/pnas.1007783107 (doi:10.1073/pnas.1007783107) [DOI] [PMC free article] [PubMed] [Google Scholar]
- 47.Allen AP, Gillooly JF, Savage VM, Brown JH. 2006. Kinetic effects of temperature on rates of genetic divergence and speciation. Proc. Natl Acad. Sci. USA 103, 9130–9135 10.1073/pnas.0603587103 (doi:10.1073/pnas.0603587103) [DOI] [PMC free article] [PubMed] [Google Scholar]
- 48.Peters RH. 1983. The ecological implications of body size. Cambridge, UK: Cambridge University Press [Google Scholar]
- 49.Sibly RM, Brown JH, Kodric-Brown A. (eds). 2012. Metabolic ecology: a scaling approach. Oxford, UK: Wiley-Blackwell [Google Scholar]
- 50.Deméré TA, McGowen MR, Berta A, Gatesy J. 2008. Morphological and molecular evidence for a stepwise evolutionary transition from teeth to baleen in mysticete whales. Syst. Biol. 57, 15–37 10.1080/10635150701884632 (doi:10.1080/10635150701884632) [DOI] [PubMed] [Google Scholar]
- 51.Friedman M. 2012. Parallel evolutionary trajectories underlie the origin of giant suspension-feeding whales and bony fishes. Proc. R. Soc. B 279, 944–951 10.1098/rspb.2011.1381 (doi:10.1098/rspb.2011.1381) [DOI] [PMC free article] [PubMed] [Google Scholar]
- 52.Jennings S, Reynolds JD, Mills SC. 1998. Life history correlates of responses to fisheries exploitation. Proc. R. Soc. Lond B 265, 333–339 10.1098/rspb.1998.0300 (doi:10.1098/rspb.1998.0300) [DOI] [Google Scholar]
- 53.Zuo W, Smith FA, Charnov EL. 2013. A life history approach to the late Pleistocene megafaunal extinction. Am. Nat . (In press.) [DOI] [PubMed] [Google Scholar]
- 54.Alroy J. 2001. A multispecies overkill simulation of the end-Pleistocene megafaunal mass extinction. Science 292, 1893–1896 10.1126/science.1059342 (doi:10.1126/science.1059342) [DOI] [PubMed] [Google Scholar]
- 55.Hayami I. 1978. Notes on the rates and patterns of size change in evolution. Paleobiology 4, 252–260 [Google Scholar]
- 56.Gittleman JL, Stephens PR. 2012. Rates of metabolism and evolution. In Metabolic ecology: a scaling approach (eds Sibly RM, Brown JH, Kodric-Brown A.), pp. 112 New York, NY: Wiley & Sons [Google Scholar]