

Abstract
Novel high-throughput sequencing methods outperform earlier approaches in terms of resolution and magnitude. They enable identification and relative quantification of community members and offer new insights into fungal community ecology. These methods are currently taking over as the primary tool to assess fungal communities of plant-associated endophytes, pathogens, and mycorrhizal symbionts, as well as free-living saprotrophs.
Taking advantage of the collective experience of six research groups, we here review the different stages involved in fungal community analysis, from field sampling via laboratory procedures to bioinformatics and data interpretation. We discuss potential pitfalls, alternatives, and solutions.
Highlighted topics are challenges involved in: obtaining representative DNA/RNA samples and replicates that encompass the targeted variation in community composition, selection of marker regions and primers, options for amplification and multiplexing, handling of sequencing errors, and taxonomic identification.
Without awareness of methodological biases, limitations of markers, and bioinformatics challenges, large-scale sequencing projects risk yielding artificial results and misleading conclusions.
Keywords: 454-pyrosequencing, bioinformatics, barcoding, environmental sequencing, internal transcribed spacer (ITS) region, PCR
Introduction
The increasing use of molecular markers to identify fungi and analyse fungal communities in a phylogenetic context has initiated a boom in fungal ecology and phylogenetics. Our understanding of the important roles of fungi in symbiotic and pathogenic interactions with plants, as well as in transformation of plant litter and nutrient cycling, is thereby rapidly increasing. In particular, high-throughput sequencing methods enable detailed, semiquantitative analysis of fungal communities in large sample sets and provide ecological information that extends far beyond that provided by previous methods in terms of detail and magnitude. The process from field samples to species abundance data involves a long series of steps, from sampling via laboratory handling to bioinformatics treatment (Fig. 1). At each step, there is a risk of losing and distorting information. Here we present an overview of the steps involved, highlight potential pitfalls, discuss alternatives, and propose solutions.
Fig. 1.
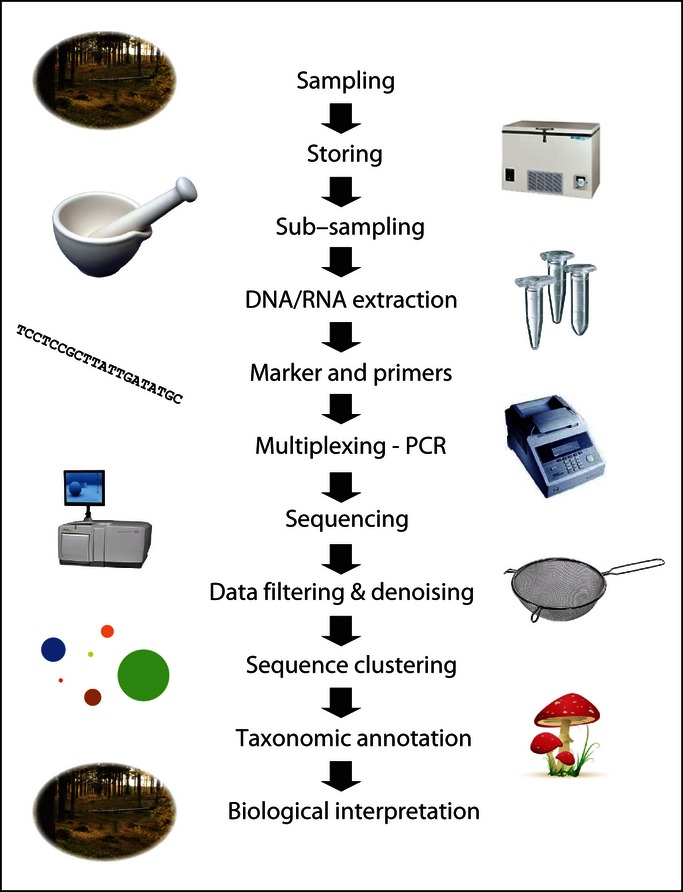
Overview of the steps involved in high-throughput sequencing of fungal communities.
Sampling
The collecting of field samples to cover the targeted variation and enable statistically robust conclusions at the desired scale of inference represents a major challenge, and optimal strategies concerning the number and spatial distribution of samples have been discussed extensively (Petersen et al., 2005; Prosser, 2010; Lennon, 2011). Collection of fungal samples calls for some additional consideration, because of the indeterminate growth of mycelia and the multitude of contrasting morphologies and trophic strategies that coexist and interact in fungal communities.
Individual mycelia may sometimes reach metres or much more in size (Smith et al., 1992; Douhan et al., 2011), and to avoid spatial autocorrelation as a result of repeated sampling of single individuals, it is important to employ a minimum distance between samples that exceeds the largest expected size of fungal mycelia. For example, Lilleskov et al. (2004) found that, by keeping a minimum distance of 3 m between samples, most of the within-stand patchiness in ectomycorrhizal community composition (which presumably reflected the distribution of individual mycelia) could be avoided. It is also important to be aware that fungi are often antagonistic to each other, with mutual exclusion amplifying spatial variation at the scale of individuals (Boddy, 2000).
In forest soils with well-stratified profiles and deep organic layers, fungal communities may be more variable along vertical gradients than horizontally (Dickie et al., 2002; Lindahl et al., 2007; Baldrian et al., 2012). Free-living saprotrophs depend on recently dead (i.e. < 10 yr ago) organic materials with high energy content, and are therefore restricted to colonize recently deposited litter components close to the surface. By contrast, root-associated biotrophs may forage for nutrients in the more processed organic matter underneath, which has largely lost its value as an energy source (Lindahl et al., 2007). Thus, when soil cores span this vertical gradient, the integrated community composition may largely depend on the relative contribution of litter and rhizosphere material to the sample. Strong vertical stratification may be accounted for by subdivision of soil cores into well-defined horizons, preferably delimited by the structure and degree of decomposition of the material rather than by depth.
Fungal communities often display temporal variation in composition (Courty et al., 2008; Pickles et al., 2010; Davey et al., 2012), which may be short term in response to local weather events or cyclic in relation to seasons and the phenology of host plants. To analyse seasonal variations with statistical precision, repeated sampling should preferably stretch over time periods of several successive years.
Handling of samples
Most markers in DNA-based community analysis are nuclear, and rapid multiplication of nuclei, for example in association with spore formation or rapid cell division of opportunists, may magnify the abundance of genetic markers without a corresponding major increase in biomass. Opportunistic growth is often induced by disturbances, implying that sampling may trigger rapid changes in DNA composition. For example, many soil fungi are intimately connected to plant roots, and disruption of root connections may induce death of root-associated species followed by rapid growth of mycelium-consuming opportunists (Lindahl et al., 2010). Sieving of soil samples leads to further release of readily usable substrates for opportunists. Thus, community development has to be arrested by freezing samples immediately upon collection, or at least slowed down by keeping samples cold until frozen at the earliest opportunity. Prolonged storage in the fridge should best be avoided, but freezing at −20°C should suffice to arrest community development and preserve DNA. Samples collected for RNA extraction have to be shock-frozen on dry ice or liquid nitrogen directly in the field, as RNA is prone to rapid degradation, and mRNA transcriptomes change in composition immediately upon disturbance. Samples intended for RNA extraction, as well as the extracted RNA, should be stored at −80°C, to ensure stable preservation. When direct freezing is not possible, chemical preservation may be an alternative (Grant et al., 2006). Preservation of samples by drying at room temperature is not a good option, because it involves incubation of moist samples at optimal temperatures for sporulation and rapid growth of opportunists. Freeze-drying enables long-term storage at room temperature, and may also aid later sample homogenization.
Homogenization and subsampling
With some exceptions (see Taberlet et al., 2012), protocols for nucleic acid extraction are based on small amounts (mg to g) of sample material. Field samples are often much larger, and careful dispersion of tissues and aggregates is required to obtain small but still representative subsamples. The most commonly used techniques are bead beating and crushing in liquid nitrogen. Subsampling and homogenization have to be adapted to each specific substrate and study, but a basic rule is that, when the size of the subsample decreases in relation to the entire sample, careful homogenization becomes more critical. In a high-throughput sequencing study of ectomycorrhizal root systems, Kauserud et al. (2012) split samples after the homogenization step and observed a high consistency in fungal community composition of the independently analysed replicates, but large differences between repeated extractions have also been found (B. D. Lindahl et al., unpublished). By including some technical replicates (i.e. split samples), the magnitude of stochastic effects and biases originating during subsampling, extraction, PCR, and sequencing may be assessed and put in relation to between-sample differences. If duplicate subsamples differ much in community composition, extraction protocols should be modified to allow larger sample sizes (e.g. in 50-ml tubes). When many samples are pooled, replication could even be implemented during sampling, so that two composite samples are collected and analysed from the same plot, providing information about stochastic variation associated with sampling. Should the sampling-associated noise threaten to overshadow more subtle treatment effects or ecological correlations, sampling effort would have to be increased.
After homogenization, new spatial structures may easily be created in the samples, for example by density fractionation at the slightest bumping. Ideally, subsampling should therefore be conducted by repeated subdivision rather than by a single ‘grab sampling’ (Petersen et al., 2005). When subsamples are small, community composition may be affected by stochastic sampling effects, as a result of the discrete nature of the sampled nuclei. This issue may be particularly problematic when screening for infectious propagules, such as resting spores, which may occur at low densities but still have a major ecological impact, for example as plant pathogens.
To ensure that fungal diversity is equally represented for all samples, DNA should be extracted from equivalent amounts of starting material. However, because densities may differ by orders of magnitude between different substrates, the distinction between volume- and weight-based quantification becomes important. For soil samples, determination of mass loss on ignition previous to extraction enables extraction from equal amounts of organic matter, which may be more relevant than total mass or volume.
Extraction and purification
There are a multitude of methods and ‘ready-to-use’ kits available for extraction and purification of nucleic acids from field samples of different kinds, but they all rely on the same basic processes: (1) mechanical disruption of tissues, (2) solubilization of cell membranes by detergents under high salt concentrations, in order to release nucleic acids into solution and prevent electrostatic binding to contaminants, (3) removal of solid residues, (4) selective binding of nucleic acids to a solid matrix, or selective precipitation of nucleic acids and pelleting by centrifugation, (5) washing off of contaminants, and (6) elution/solubilization of nucleic acids.
Extraction protocols should yield high and uniform amounts of DNA, while the concentration of PCR inhibitors is minimized, so that optimal PCR conditions may be achieved. To avoid biases during sample preparation, the same DNA extraction protocol should ideally be used for all samples (Tedersoo et al., 2010a), although the relative efficiency of extraction methods may differ greatly between tissues and soil types (Martin-Laurent et al., 2001). For challenging substrates, such as forest soils with high humus content, a ‘raw extract’ produced by cell disruption and DNA precipitation may have to be further purified by binding of DNA to a silica matrix. Some of the problems with purity may be overcome by reducing the amount of starting material for DNA extraction. Counterintuitively, dilution of templates may often increase PCR yield as a result of release of inhibition (Wilson, 1997).
Markers and primers
The ideal marker for fungal community studies should: have primer sites that are shared by all fungi, be of appropriate length for efficient amplification and sequencing, have high interspecific variation but low intraspecific variation, and be possible to align across all fungi. No known markers meet all these requirements. However, components of the nuclear ribosomal repeat unit (rDNA) are by far the most commonly used genetic markers for phylogenetic and taxonomic identification of microorganisms. The genes for the small subunit (SSU: 16S/18S) and large subunit (LSU: 23S/25S/28S) are juxtaposed and (in eukaryotes) separated by the internal transcribed spacer (ITS) region, which is transcribed but spliced away before assembly of the ribosomes. The ITS region is composed of two highly variable spacers, ITS1 and ITS2, and the intercalary 5.8S gene. This rDNA operon occurs in multiple copies in genomes, providing up to 100 times more DNA template from the same starting material than for single-copy genes (Herrera et al., 2009). The rDNA genes are highly conserved across large groups of organisms, making them ideal targets for general PCR primers that aim to amplify a wide range of taxa. However, amplified fragments must also contain enough variation to be informative at the phylogenetic level of interest. This is the main reason why the ITS region has been particularly attractive for mycologists. Because the ITS region does not code for ribosome components, it is highly variable; with a few exceptions (Gazis et al., 2011), even closely related species differ in sequence. At the same time, intraspecific variation is relatively low (Schoch et al., 2012). Intragenomic differences in ITS sequences have been detected in a few fungal taxa such as Laetiporus spp. (Lindner & Banik, 2011), but this does not seem to be a widespread phenomenon in Dikarya (D. L. Lindner et al., unpublished). Using primers located in the adjoining ribosome-encoding genes or in the intercalary 5.8S gene, the ITS region may be amplified from a wide range of fungi. The choice of genetic marker also has to take the availability of reference databases into account, with ITS sequences having by far the best representation for Dikarya (Begerow et al., 2010). Thus, the ITS region was recently proposed as the formal barcode for fungi (Schoch et al., 2012). Although useful for species separation, the ITS region is too variable to address the phylogeny of higher ranks, that is, at the level of families and orders. When aiming to estimate phylogenetic distances across major fungal groups, the LSU provides an attractive alternative, being more conserved than the ITS and possible to align across distantly related taxa, yet also providing some resolution at lower taxonomic ranks (Porter & Golding, 2012). The more conserved SSU and LSU are widely used for Glomeromycota. In this phylum, single individuals may contain several divergent rDNA sequences (Sanders & Croll, 2010), and we have little knowledge of how the sequences obtained from field samples are distributed within mycelia and species.
In prokaryotes, the small subunit (16S) has been the prime target for phylogenetics and community analysis. Therefore, it may seem natural to use the corresponding SSU gene for fungi. However, in fungi and other eukaryotes, the SSU is more conserved than in prokaryotes (see Fig. 1 in Hartmann et al., 2010). Unless the focus is restricted to the highest phylogenetic ranks, that is, phyla and orders, the SSU gene provides little phylogenetic information and species delimitation power for Dikarya (Schoch et al., 2012), and is therefore not recommended as a target for species-level analysis of fungal communities. In many previous studies where the SSU was used as the target marker, conclusions were drawn at the level of species, based on perfect matches with database references but ignoring the fact that identical sequences could be found in hundreds of other species across entire orders of fungi. Identical SSU sequences may be shared between saprotrophs, parasites, and mycorrhizal fungi, because these ecological strategies have evolved repeatedly in relatively small phylogenetic lineages (Hibbett et al., 2000; James et al., 2006; Tedersoo et al., 2010b).
Protein-encoding genes usually occur as single copies in genomes, which may be advantageous for quantitative comparison of taxon abundances but disadvantageous during amplification. As a consequence of the nonconserved third base, protein-encoding genes contain more variation in the form of substitutions compared with deletions and insertions, enabling alignment across phylogenetically distant groups in spite of high variation in sequence. Furthermore, coding genes often contain introns with sufficient power for discrimination among species. A disadvantage with many protein-coding genes is that they occur in gene families where within-genome gene duplications often have taken place within the same time-frame as speciation, making the identification of gene orthologues problematic (Lindahl & Taylor, 2004; Bödeker et al., 2009). In addition, because of the nonconserved third base, it is difficult to design primers that cover all possible sequence variants, even when highly conserved functional domains are targeted.
Extraction of total DNA from environmental substrates may include material from dormant or even dead organisms, as free DNA may be preserved adsorbed to soil particles (Taberlet et al., 2012). By contrast, RNA has a shorter biological half-life ranging from minutes to hours (Kebaara et al., 2006). Transcribed messenger RNA (mRNA) which carries coding information of functional genes may be analysed to relate activity to specific gene products and eco-physiological functions (Kellner et al., 2010). However, because the functional and taxonomic annotation of genes is still far from completed and relatively few species are represented by their entire genomes in databases, the ribosomal genes remain the primary target of fungal community identification. Ribosomal RNA (rRNA) is quantitatively abundant and easily extracted from environmental samples (Pennanen et al., 2004), but the low phylogenetic resolution of these coding regions limits their use for species identification. Processing of transcribed rRNA to form mature ribosomes in eukaryotes includes splicing of the ITS regions, which is known to take place within a few minutes after transcription (Koš & Tollervey, 2010). This short window of time offers a possibility to amplify taxonomically valuable ITS sequences from newly transcribed RNA, reflecting very recent metabolic activity – even more recent than that indicated by SSU rRNA (reviewed by Rajala et al., 2011). The transient nature of ITS transcripts in the RNA pool makes them an attractive target when studying responses of fungal communities to short-term environmental fluctuations.
A multitude of primers have been designed and successfully applied to amplify fungal rDNA and rRNA from the environment. Most of these primers were originally designed to target fungi specifically, but turned out to amplify the DNA of other eukaryote lineages as well (e.g. ITS1–ITS5; White et al., 1990). The ITS1F primer (Gardes & Bruns, 1993) discriminates well against plants and has been widely used in analyses of plant-associated fungal communities. Primers such as ITS4B (Gardes & Bruns, 1993) and LB-W (Tedersoo et al., 2008) were designed with the aim of specifically targeting ectomycorrhizal fungi belonging to Basidiomycota. Hitherto, most primers have been constructed with amplification of monospecific samples (e.g. mycorrhizal root tips or pathogen-infected tissues) in mind. Nonbiased amplification of complex communities is more challenging, and competition for primers means that even single mismatches between primer and template impede or strongly bias amplification (Ihrmark et al., 2012). With the possible exception of the primers LR3/TW13 and LR5/TW14, which target highly conserved sites within the LSU, all fungus-specific and ‘universal’ primers inadvertently discriminate against specific fungal taxa (Bellemain et al., 2010). Thus, the choice of primer has a significant impact on how fungal communities are translated into amplicon communities. When the goal is to retrieve as many different fungi as possible, we recommend the use of primer combinations and primers with degenerate positions (i.e. mixtures of many different primers; e.g. Ihrmark et al., 2012; Toju et al., 2012). If primers with low specificity are used, nonfungal sequences may be removed at a later stage of the analysis. It should be noted, however, that when degenerate primers are used with high cycle numbers, depletion of specific primers in the mixtures may bias amplification in favour of species that match other, less depleted primers (Polz & Cavanaugh, 1998).
The length of the amplified fragments is a critical parameter that has to be considered when primers are chosen. Longer fragments contain more information for phylogenetic analyses. However, when aiming for minimized amplification biases, amplified fragments should be kept short, as increasing length of the target amplicon has a significant negative effect on assessments of microbial richness and biases community composition (Huber et al., 2009; Engelbrektson et al., 2010). With longer stretches of conserved sequence in the amplicons, the incidence of chimeric sequences also increases (Fonseca et al., 2012). By using primer sites in the 5.8S gene, amplification may be restricted to either the ITS1 or the ITS2 region only. Ihrmark et al. (2012) used new primers in the 5.8S gene to amplify 250–400-bp fragments containing the ITS2 region and found that diversity and community composition were much better preserved than when the entire ITS region was amplified. Additional primers with a similar purpose were designed by Toju et al. (2012). ITS1 and ITS2 share many properties, and similar results can be obtained with the two markers (Mello et al., 2011; Bazzicalupo et al., 2013). However, ITS2 is generally less variable in length compared with ITS1 and lacks the problem of co-amplification of a 5′ SSU intron that is common in many ascomycetes. The ITS2 has also relatively conserved secondary structure among eukaryotes, which potentially enables higher level phylogenetic comparisons and the use of ITS2 as a universal barcode across eukaryotic kingdoms (Coleman, 2009; Koetschan et al., 2010). Furthermore, ITS2 is somewhat better represented than ITS1 in databases (Nilsson et al., 2009).
With respect to Glomeromycota and other non-Dikarya lineages, it is more problematic to recommend primers, as we still lack information on the diversity in many groups. For Glomeromycota, a combination of taxonomically inclusive primers for nested PCR, involving the partial SSU, ITS, and partial LSU, has been elaborated (Krüger et al., 2009). Alternatively, a variable region of the SSU is amplified with the primers NS31-AM1, and the variable D2 region of the LSU is amplified with the primer FLR3 (aka glo454) in combination with either FLR4 or NDL22 (aka TW13) (van Tuinen et al., 1998; Gollotte et al., 2004; Lee et al., 2008; Öpik et al., 2009; Lekberg et al., 2012). Recently, other primers or primer combinations have been suggested (Lee et al., 2008; Stockinger et al., 2010), which also target regions in the SSU and LSU. The SSU has also been successfully used as a marker for Chytridiomycota (Freeman et al., 2009).
Multiplexing
To make optimal use of high-throughput sequencing technologies, tagged amplicons from several samples may be mixed and sequenced in a single run. Sequences are then assigned to samples based on short sequence tags (i.e. molecular identifiers – MIDs), which are unique to each sample. In addition, most high-throughput sequencing methods require that amplicons are fitted with specific adaptor sequences. The adaptor sequences, as well as the tags, can be incorporated into the PCR primers, but they may also be added by ligation to the PCR products. Three options are available (Table 1).
Table 1.
Different options for the addition of sample tags and sequencing adapters to PCR products
| 1 | Primers | ADAPTOR - TAG - PRIMER | PRIMER - TAG - ADAPTOR | |
| PCR | ADAPTOR - TAG - PRIMER | ----------------- | PRIMER - TAG - ADAPTOR | |
| 2 | Primers | TAG - PRIMER | PRIMER - TAG | |
| PRC | TAG - PRIMER | ----------------- | PRIMER - TAG | |
| Ligation | ADAPTOR - TAG - PRIMER | ----------------- | PRIMER - TAG - ADAPTOR | |
| 3 | Primers | PRIMER | PRIMER | |
| PCR | PRIMER | ----------------- | PRIMER | |
| Ligation | ADAPTOR - TAG - PRIMER | ----------------- | PRIMER - TAG - ADAPTOR |
Both adaptors and sample tags are included in the PCR primers (Jumpponen & Jones, 2009). This method enables directional sequencing, which is beneficial if the fragments are too long to be sequenced throughout their entire length. However, in some labs such long primer constructs (> 45 bp) has proved to impair PCR efficiency and to cause problems with primer dimerization (Wallander et al., 2010). Such problems may be ameliorated by a nested PCR approach, where ordinary primers are used during most of the PCR and the extended primers are added during the last few cycles (Kauserud et al., 2012), but such complicated PCR schemes may increase the risk of contamination and distortion of relative abundances.
Sample tags are included in the PCR primer but adaptors are added to the PCR product by ligation (Ihrmark et al., 2012). This method reduces the length of primers to < 30 bp, and PCR may be conducted using standard programmes. With adaptors added by ligation, amplicons will be sequenced in random orientation. This may cause problems for long amplicons, where sequences from different ends may have no or only partial overlap. Nondirectional sequencing also implies that half of the sequences have to be reversed before further analysis. Furthermore, the 5′-end nucleotides of the tags may interfere with ligation, so that certain samples are favoured in the final mix (Ihrmark et al., 2012). This problem may be overcome by fitting all sample tags with the same 5′-end nucleotide or by adding more PCR product from certain samples.
Both adaptors and sample tags are ligated onto PCR products. Here, the same standard primers may be used for all samples, but PCR products from different samples have to be kept separated through ligation. When many samples are analysed, this method increases work-load and costs considerably.
Berry et al. (2011) found indications that tag-extended primers may introduce biases in community composition and advised that tagged primers are added during the last PCR cycles. However, in later tests of different tags on artificially assembled communities (Ihrmark et al., 2012), tag-related biases were marginal. It is, however, important that the two nucleotides at the 3′ end of the tag do not match with corresponding nucleotides in the target priming site, which would allow the tag to act as an extension of the primer, potentially causing positive amplification bias. Switching of sample tags after pooling of separately amplified PCR products may have an impact on sequencing results and lead to numerous false positives as a result of cross-contamination (Carlsen et al., 2012). To be able control for this phenomenon, amplicons may be tagged at both ends. In order to minimize the risk of misidentification of sequence tags, it is also important that all tags differ from each other by at least two nucleotides (Parameswaran et al., 2007; Faircloth & Glenn, 2012).
PCR
Preservation of genotype composition through DNA extraction and subsequent PCR amplification is a major challenge. The number of PCR cycles has to be minimized, as excessive cycles may result in preferential amplification of rare sequences as well as the creation and further propagation of chimeric sequences (Kanagawa, 2003; Haas et al., 2011). Particularly when degenerate primers are used, the PCR should preferably be interrupted while in the exponential phase (Polz & Cavanaugh, 1998). The cycle number may be reduced by optimizing extraction protocols and by choosing markers and primers that yield short amplicons and, thereby, increase PCR efficiency. Generally, one should aim for weak to medium-strong PCR products, as visualized on an electrophoresis gel.
Different polymerases tend to differ in fidelity, and choosing a high-fidelity polymerase will reduce the number of nucleotide incorporation errors produced during PCR amplification. For instance, Phusion® (New England BioLabs Inc., Ipswich, MA, USA) and Pfu Ultra™ (Agilent Technologies Inc., Santa-Clara, CA, USA) both have a 50× higher fidelity than taq (Li et al., 2006). With a taq error rate of 2.3 × 10⁻⁵, the proportion of amplicons with error for a 250-bp fragment amplified through 30 cycles of PCR will be 0.3% for Phusion® and Pfu Ultra™ and 16% for taq. However, the majority of these errors would be caused by a single bp difference only and could be accounted for during denoising and sequence clustering. Choosing a high-fidelity enzyme may also reduce the number of recombinant (chimeric) amplicons (Lahr & Katz, 2009).
Quantitative real time PCR (qPCR) is a valuable tool when optimizing extraction protocols and PCR conditions. In a qPCR cycler, the increasing product concentration may be followed for each individual reaction during the entire cycling programme. Thus, qPCR may be used to pre-screen samples, adjusting cycle numbers to ensure that the PCR is interrupted during the phase of exponential increase in product concentration. Extraction yield, template dilution, and PCR parameters can be optimized, and PCR inhibition may be assayed by spiking samples with standard template. Real-time PCR may also be used to quantify the amount of template, that is, the absolute number of extractable copies of marker genes per amount of extracted substrate (Baldrian et al., 2013). By choosing primers with different specificities, the total amount of fungal DNA or individual taxa may be quantified. However, several technical replicates are required, in order to gain precision in the estimates. It is also critical to control for PCR inhibition and template availability, preferably by spiking samples with standard reference DNA before extraction.
The need to employ the most stringent discipline during preparation of samples for community sequencing cannot be emphasized enough. Negative controls (blank extractions) should always be included in all PCR reactions (Tanner et al., 1998). However, when the number of PCR cycles is increased, PCR products will inevitably form, also in negative controls, unless all laboratory work is conducted under rigorously sterile conditions; a single spore that falls into a PCR tube is enough to yield a band on the gel. This is another reason to aim for high template concentrations and low cycle numbers, so that the effects of minute contaminations on overall community composition are minimized. There is also the possibility to include positive controls in the form of a simple, standard ‘mock community’ of known qualitative and quantitative composition (c.f. Ihrmark et al., 2012).
Purification, quantification, and pooling of PCR products
Before sequencing, PCR products from different samples are mixed in equimolar proportion, so that the DNA sequence output is evenly distributed across all samples. It may also be beneficial to pool several PCR reactions from each sample, in order to even out stochastic distortion of community composition during PCR (Polz & Cavanaugh, 1998; Ihrmark et al., 2012). Before pooling, PCR products have to be purified, to remove primers and short DNA fragments. If long composite primers are used, this step may require particular attention, especially when primer dimerization is a problem. In difficult cases, gel excision may be a solution, but this approach involves excessive laboratory work when sample numbers are large. When establishing the concentration of PCR products, methods based on fluorescent DNA-binding dyes have higher resolution than methods based on UV absorbance, particularly as many types of sample tubes may release UV-absorbing compounds from the plastic (Lewis et al., 2010). If PCR products are available in excess, specially designed normalization plates are available, which retain the same amount of DNA from each sample and discard the surplus. To ensure a high quality of the sample, that is, absence of primers and fragments of unwanted sizes, and firmly establish the final amounts of DNA, the combined size fractionation and concentration measurements offered by the Bioanalyzer technology (Agilent Technologies Inc.) are useful. When running the protocols for the first time, confirmatory Sanger sequencing of a few cloned amplicons is recommended before high-throughput sequencing, particularly if complex PCR schemes are employed.
Sequencing platforms
In 2005 the first high-throughput sequencing platform from 454 Life Sciences (Branford, CT, USA) was introduced to the market (Margulies et al., 2005), and c. 3 yr later the first fungal ecology studies were published based on this technology (Buee et al., 2009; Jumpponen & Jones, 2009; Öpik et al., 2009). The 454-sequencing technique is routinely used both for shotgun sequencing of genomic DNA/cDNA and in-depth sequencing of PCR amplicons. A typical run on the GS FLX+, using titanium chemistry, takes 1 d and yields 1–1.5 million reads with a length of c. 400–500 bases, which are ideal read lengths for covering either ITS1 or ITS2 (plus primers and tags). Longer read lengths, up to 1200 bases, have recently been generated. Ion Torrent (i.e. the Ion PGM Sequencer; Life Technologies, Carlsbad, CA, USA), which was introduced to the market in 2011, has similarities with the 454 technology but measures released protons (pH) directly rather than light. The major advantages of Ion Torrent are its short run-time (c. 2 h), high yields, and a competitive price compared with 454-sequencing. According to the manufacturer, the new Ion Proton Sequencer may generate 60–80 million 200-base reads (with the Proton I chip). The shorter read lengths have hitherto made Ion Torrent unsuitable for the analysis of the ITS region, but up to 400-bp sequences have recently been generated. Illumina sequencing (Illumina Inc., San Diego, CA, USA) is currently the most successful and most widely adopted next-generation sequencing platform, but has hitherto not been adopted for analysis of fungal communities because of limited read lengths. However, according to the manufacturer, paired-end sequences on the MiSeq platform now enable 2 × 250-base read lengths and a yield of c. 30 million reads. The sequencing platform SOLiD (Life Technologies) also results in a high number (up to 4.8 billion) of short reads. As a consequence of their reduced costs and tremendous yields, both Ion Torrent and Illumina MiSeq will obviously challenge the Roche 454 technology. So-called ‘third-generation sequencing platforms’ are based on single-molecule and real-time sequencing, with the first platform, PacBio RS, introduced in 2011 by Pacific Biosciences (Menlo Park, CA, USA). Read lengths may be up to several kb but the sequence quality and output are still too low for diversity analyses based on amplified markers. However, by sequencing the template several times (circular consensus sequencing), reads of high quality may be produced. Other upcoming techniques that will probably have a substantial impact on the field are based on registering the DNA (or RNA) as it goes through nanopores placed in artificial membranes. For comprehensive reviews of current and future sequencing technologies, see Glenn (2011) and Shokralla et al. (2012). Further up-to-date news on this rapidly developing topic may be found at http://seqanswers.com.
Bioinformatics analysis
As PCR errors become visible when sequences are based on single molecules of PCR product, and high-throughput methods also generate frequent errors during the sequencing procedure, data sets derived by high-throughput sequencing must be subjected to extensive quality control measures (Kunin et al., 2010). The same data set analysed using only read-score-based filtering versus more advanced filtering methods may differ around five-fold in the number of derived operative taxonomic units (OTUs; Quince et al., 2009). ITS sequences seem to be particularly prone to 454-sequencing errors, presumably because of the high incidence of homopolymers, that is, repetitions of a single nucleotide, which are a major source of error in 454-sequencing (Balzer et al., 2011).
The read-score-based base-pair pruning applied by the sequencing factory is at best a poor replacement for sequence quality management programs such as ampliconnoise (Quince et al., 2011), the Denoiser implemented in qiime (Reeder & Knight, 2010), dada (Rosen et al., 2012) and acacia (Bragg et al., 2012), which are all tailored for high-throughput sequencing data. ampliconnoise also supports detection of sequence chimeras, whose presence otherwise would inflate diversity estimates significantly (Fonseca et al., 2012). 454-sequencing data sets may contain a nontrivial number of sequences that represent primer dimers, seemingly random sequence data, or gene segments other than the one targeted (Balzer et al., 2011). It may happen, as in the study by Wallander et al. (2010), that as much as 95% of 454-sequencing reads have to be excluded because of quality-related issues, but 20–40% is a more common figure. Whether or not a sequence represents the ITS region can be established using ITSx (http://microbiology.se/software/itsx/), which uses hidden Markov models and the hmmer package (Eddy, 2011) to detect the flanking SSU, 5.8S and LSU genes. The ITS1 and ITS2 as well as the full ITS region can then be extracted automatically from the sequence data set depending on which genes were detected. A similar tool for the SSU was released by Bengtsson et al. (2011). Diversity estimates also depend on the amount of sequences derived from samples, and one way to reduce bias associated with different numbers of reads in the different samples is to randomly subsample all samples down to the size of the smallest sample (Gihring et al., 2012).
Establishment of sequence similarities requires alignment of sequences. When global alignments are possible, as is the case for less variable markers, such as the LSU and SSU, data may be entered into commonly used pipelines developed for general microbial ecology, such as mothur (Schloss et al., 2009). Global alignment also enables analysis of the phylogenetic distance between communities, using tools such as UniFrac (Hamady et al., 2010), in which the difference between communities depends not only on which members are included, but also on how closely related they are. However, for the ITS region, methods based on global alignments are impractical, because of high variability in sequence and length, and clustering of ITS sequences usually has to depend on pairwise alignments. Pairwise alignments require major computational capacities, and several available bioinformatics pipelines specially developed for processing of fungal ITS data sets derived by 454-sequencing, including clotu (Kumar et al., 2011), scata (http://scata.mykopat.slu.se), and plutof (Abarenkov et al., 2010a), run as web-based tools on high-capacity computer clusters.
During clustering, sequences sharing a predefined level of similarity are assembled into OTUs. Complete-linkage clustering (furthest neighbour) yields OTUs that can be thought of as circular; with a 97% similarity threshold, all sequences within a cluster will be at most 3% different from each other. With single-linkage clustering (nearest neighbour), a 97% similarity threshold means that it is enough that a sequence is at most 3% different from any other sequence in the OTU to be included in that OTU, and OTUs tend to be amoeboid rather than circular (Fig. 2). blastclust (http://ftp://ftp.ncbi.nih.gov/blast/) is an example of a single-linkage clustering program, and clotu, scata, plutof, and mothur all feature single-linkage clustering. Complete-linkage algorithms (e.g. uclust; Edgar, 2010) are sensitive to the choice of seed sequences, which typically relies on sequence frequencies or length. This is not a concern for single-linkage clustering, which is deterministic, that is, the same OTUs are arrived at irrespective of seed sequence. The ‘greedy clustering’ of single-linkage methods, where clusters expand until there are no similar sequences left to enter, makes them efficient in the handling of sequencing errors (Huse et al., 2010), and single-linkage clustering may to some extent replace more computationally intensive quality management programs. However, single-linkage clustering requires that OTUs are phylogenetically well separated from their neighbours, or there is a major risk that they merge into large clusters (a ‘snowballing effect’). Furthermore, it is important to consider that local alignments over subsections of sequences usually lead to higher pairwise similarities than global alignments, and local alignments with a low match-length threshold may yield overly large clusters.
Fig. 2.
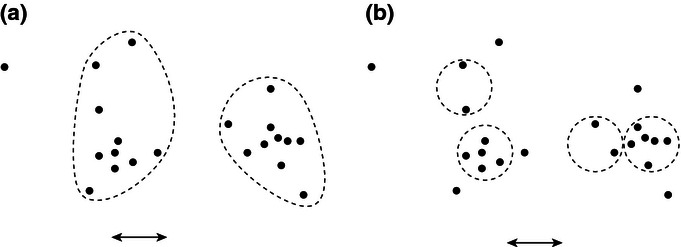
Illustration of (a) single-linkage clustering and (b) complete-linkage clustering of the same objects in a two-dimensional space. Arrows indicate the clustering threshold distance. With the same clustering threshold distance, single-linkage clustering yields fewer clusters and fewer singletons.
An alternative to pairwise comparisons, which may be attractive when computational capacity is limited, is to compare sample sequences to a set of identified reference sequences, for example, with mafft (Katoh & Frith, 2012) or qiime (Caporaso et al., 2010; https://github.com/qiime/its-reference-otus). This method is best suited for inventories of well-described taxa, but has obvious limitations when exploring less charted parts of the fungal kingdom.
An increasing number of clustering programs apply other similarity measures than absolute distances, relying on, for example, the grammatical structure of the sequence data (notably gramcluster by Russell et al. (2010), crop by Hao et al. (2011), and crunchclust by Hartmann et al. (2012)).
crunchclust, clotu, and scata are notable in offering a pyrosequencing homopolymer collapse option, where OTUs cannot be delimited based on differences in homopolymer regions alone. Furthermore, both clotu and scata allow easy checking for noncompatible tag combinations when tags are fitted at both ends of amplicons. Sequence clustering produces the best results when sequences of comparable coverage are employed, and the user should consider running tools, such as ITSx (http://microbiology.se/software/itsx/) or v-xtractor (Hartmann et al., 2010; Kerekes et al., 2013) for SSU and LSU, to ensure that the query sequences are at least roughly comparable in terms of coverage of the target region.
To assign taxonomic affiliations to the sequences obtained is a major challenge, and projects should be planned both with ample time for data analysis in mind and in such a way that bioinformatics and taxonomic expertise is accounted for among the project members. Following the sequence clustering step, the derived OTUs are typically examined for taxonomic affiliation through BLAST-based similarity searches in the INSD or UNITE (Abarenkov et al., 2010b) databases or, for LSU sequences, through a Bayesian classifier (Liu et al., 2012). We recommend the use of the most common sequence in each OTU as a basis for taxonomic examination (less favoured options include the longest sequence in each OTU or the consensus sequence). The INSD sequence corpus is in part compromised by the presence of incorrectly annotated, chimeric, or otherwise substandard entries, and the user is well advised to use the UNITE (ITS; Abarenkov et al., 2010b; Tedersoo et al., 2011), SILVA (SSU; Pruesse et al., 2007) or MaarjAM (SSU; Glomeromycota; Öpik et al., 2010) databases instead. UNITE maintains a downloadable copy of the fungal ITS sequences in INSD (http://unite.ut.ee/repository.php), and this copy is subject to third-party annotation and other quality management measures. More than 75 000 INSD sequences have been annotated, including the exclusion of c. 1000 chimeric entries and the taxonomic annotation and re-annotation of 13 500 entries, and for local similarity searches, this data set is much to be preferred over a raw dump of the INSD.
Complications associated with the taxonomic affiliation of sequences based on BLAST searches are discussed in Christen (2008) and Kang et al. (2010). Although dependent on settings, BLAST searches tend to favour long sequence, and the presence of conserved sequence segments in the query sequence, and anyone analysing high-throughput derived ITS sequences may want to prune any large parts of the SSU, LSU, and possibly also the 5.8S from their ITS sequences before doing similarity searches. It should be recognized that proper sequence-based identification involves delimitation of taxa and requires understanding of fundamental phylogenetics as well as a basic taxonomic overview of the fungal kingdom (Nilsson et al., 2008). There are countless examples of how blind reliance on best BLAST hits for identification may lead in totally wrong directions. The construction of a ‘rough’ phylogenetic tree, based on a crude alignment and neighbour joining of sample and reference sequences, may aid understanding of the material in a phylo-taxonomic context. For a schematic overview of the phylogenetic composition and diversity across samples, BLAST results can be imported and viewed in the program megan (Huson et al., 2011). Based on the consistency of the top BLAST matches, the sequences will be mapped at different levels in a predefined taxonomy (e.g. the GenBank taxonomy). The scata pipeline approaches OTU identification in a different way, with database references and sample sequences clustered together. The reference sequences included in each OTU are listed in the data output, allowing assignment of taxonomic identities.
Another alternative to BLAST for taxonomic assignment is provided by the naïve Bayesian classifier method (Liu et al., 2012) implemented in the ribosomal database project (Wang et al., 2007). Starting from a large training set of well-annotated reference sequences, the Bayesian classifier attempts to assign query sequence to the various taxonomic levels offered by the reference sequences. It computes a bootstrap value for each assignment, thus providing a rough measure of confidence of the assignment at each level. Its accuracy is comparable to, or somewhat better than, that of BLAST, and it is substantially faster than the latter. A potential downside of the LSU classifier is the limited number (and taxonomic scope) of the public fungal LSU sequences. However, given the more conserved nature of the LSU compared with the ITS region, LSU sequences from previously unsequenced lineages are typically still assignable to higher taxonomic ranks such as order or class, which is not always the case with ITS sequences.
Finally, it is important that data are stored in a publicly accessible way, and that the bioinformatics handling of data is properly accounted for in publications (Nilsson et al., 2011). An extensive list of bioinformatics resources can be found in Bik et al. (2012).
Data interpretation
In spite of denoising and the use of ‘greedy’ clustering algorithms, high-throughput data sets usually contain a large number of singletons (unique sequences present only once in the data set) that deviate to varying degrees from the original template. As such erroneous singletons inflate diversity, a common practice has been to remove them before downstream statistical analyses (Tedersoo et al., 2010a), but of course many singletons may represent authentic, rare taxa (Kauserud et al., 2012). The abundance of artificial singletons in high-throughput data sets makes estimates of total sample diversity by endpoint extrapolation of rarefaction curves risky. As the incidence of erroneous singletons increases with sequencing effort, species accumulation curves tend to increase infinitely (Quince et al., 2009). This implies that the relevance of diversity estimators, such as Jackknife and Chao indices, which rely on the abundance of singletons and doubletons relative to more common OTUs, may be questioned for high-throughput sequencing data (Dickie, 2010). It remains uncertain to what extent this problem can be ameliorated by proper bioinformatics procedures.
The reliability of OTUs with a low number of sequences may also be questioned, and a conservative approach has been to remove all clusters with less than, for example, five reads. However, the appropriate cut-off level for removing ‘low-frequency clusters’ depends on the total number of sequences per sample and the clustering parameter settings. If the primary aim of studies is to investigate community–environment relationships or effects of experimental treatments rather than estimating alpha diversity or screening for rare taxa, it has been found that pruning of rare OTUs has a marginal effect on subsequent multivariate statistical analyses (Gobet et al., 2010). By contrast, particular attention has to be paid to the validity of rare OTUs when data are analysed based on presence/absence. As false positives may occur as a result of tag switching (Carlsen et al., 2012), and even the slightest cross-contamination may have a major impact, we recommend pruning of OTUs with low numbers of sequences. Such pruning should preferably be carried out on a per-sample basis, as an OTU that is common in one sample may occur as a low-abundant contaminant in other samples.
To what degree high-throughput sequencing data can be used quantitatively is much debated (Amend et al., 2010; Baldrian et al., 2013). When interpreting community analyses based on molecular markers, it is important to remember that abundance of genetic markers in extracts does not reflect biomass in the samples. Amplification of an artificial community assembled from PCR products showed that community structure may be fairly well conserved through PCR and 454-sequencing, provided that the amplicons are short and primers match with all species in the community (Ihrmark et al., 2012). By contrast, the quantitative composition of an artificially assembled spore community was not well reflected by 454-sequencing in the study of Amend et al. (2010), suggesting that diverging numbers of rDNA repeats in different species in combination with differences in extractability may lead to severe quantitative biases. Furthermore, accurate quantification of genomes in a sample does not suffice to describe taxonomic biomass distribution; species with long, filamentous cells are likely to be underrepresented, whereas fungi with yeast-like growth and/or small cells may be overrepresented, because of their high nucleus to biomass ratio.
Concluding remarks
New high-throughput methods outperform earlier approaches in terms of resolution and magnitude and offer unprecedented insights into fungal community ecology. However, without awareness of methodological biases, limitations of markers or bioinformatics challenges, large-scale sequencing risks yielding artificial results and misleading conclusions. Thus, early claims of astonishingly high species richness in 454-sequenced amplicons were exaggerated, because of problems in distinguishing technical artefacts from true diversity. Although more sophisticated bioinformatics tools are now available, high-throughput assessment of species richness remains a major technical challenge. Furthermore, considering that even a species represented by a single spore would be recorded in a sufficiently deeply sequenced sample, the biological relevance of such assessments may be questioned. Absolute analyses of species presence and diversity are also sensitive to contaminations during sampling, laboratory processing and sequencing. We argue that the major benefit of high-throughput methods rather lies in the capacity to provide information about the main fungal colonizers in large numbers of samples, to a progressively decreasing cost in terms of money and laboratory labour. In the near future, automated processing of samples may increase the scope and statistical power of ecological studies even further. In addition, novel sequencing techniques continually increase data output, which in combination with rapidly expanding databases of entire genomes enables a development away from molecular markers and PCR amplification towards direct analysis of meta-genomes and meta-transcriptomes of complex fungal communities (Kuske & Lindahl, 2013).
Acknowledgments
This article was written within the framework of the collaboration networks ‘Fungi in Boreal Forest Soils’, funded by Nord-Forsk, and ‘NEFOM’, funded by the European Forest Institute. Additional funding from the Swedish Research Council FORMAS to B.D.L. and R.H.N. is acknowledged. The authors are grateful to Martin Bidartondo and three anonymous reviewers for advice and comments.
References
- Abarenkov K, Nilsson RH, Larsson K-H, Alexander IJ, Eberhardt U, Erland S, Hoiland K, Kjøller R, Larsson E, Pennanen T, et al. The UNITE database for molecular identification of fungi – recent updates and future perspectives. New Phytologist. 2010b;186:281–285. doi: 10.1111/j.1469-8137.2009.03160.x. [DOI] [PubMed] [Google Scholar]
- Abarenkov K, Tedersoo L, Nilsson RH, Vellak K, Saar I, Veldre V, Parmasto E, Prous M, Aan A, Ots M, et al. PlutoF – a web based workbench for ecological and taxonomic research, with an online implementation for fungal ITS sequences. Evolutionary Bioinformatics. 2010a;6:189–196. [Google Scholar]
- Amend AS, Seifert KA, Bruns TD. Quantifying microbial communities with 454 pyrosequencing: does read abundance count? Molecular Ecology. 2010;19:5555–5565. doi: 10.1111/j.1365-294X.2010.04898.x. [DOI] [PubMed] [Google Scholar]
- Baldrian P, Kolarik M, Stursova M, Kopecky J, Valaskova V, Vetrovsky T, Zifcakova L, Snajdr J, Ridl J, Vlcek C, et al. Active and total microbial communities in forest soil are largely different and highly stratified during decomposition. The ISME Journal. 2012;6:248–258. doi: 10.1038/ismej.2011.95. [DOI] [PMC free article] [PubMed] [Google Scholar]
- Baldrian P, Větrovský T, Cajthaml T, Dobiášová P, Petránková M, Šnajdr J, Eichlerová I. Estimation of fungal biomass in forest litter and soil. Fungal Ecology. 2013;6:1–11. [Google Scholar]
- Balzer S, Malde K, Jonassen I. Systematic exploration of error sources in pyrosequencing flowgram data. Bioinformatics. 2011;27:i304–i309. doi: 10.1093/bioinformatics/btr251. [DOI] [PMC free article] [PubMed] [Google Scholar]
- Bazzicalupo AL, Bálint M, Schmitt I. Comparison of ITS1 and ITS2 rDNA in 454 sequencing of hyperdiverse fungal communities. Fungal Ecology. 2013;6:102–109. [Google Scholar]
- Begerow D, Nilsson H, Unterseher M, Maier W. Current state and perspectives of fungal DNA barcoding and rapid identification procedures. Applied Microbiology and Biotechnology. 2010;87:99–108. doi: 10.1007/s00253-010-2585-4. [DOI] [PubMed] [Google Scholar]
- Bellemain E, Carlsen T, Brochmann C, Coissac E, Taberlet P, Kauserud H. ITS as an environmental DNA barcode for fungi: an in silico approach reveals potential PCR biases. BMC Microbiology. 2010;10:189. doi: 10.1186/1471-2180-10-189. [DOI] [PMC free article] [PubMed] [Google Scholar]
- Bengtsson J, Eriksson KM, Hartmann M, Wang Z, Shenoy BD, Grelet GA, Abarenkov K, Petri A, Rosenblad MA, Nilsson RH. Metaxa: a software tool for automated detection and discrimination among ribosomal small subunit (12S/16S/18S) sequences of archaea, bacteria, eukaryotes, mitochondria, and chloroplasts in metagenomes and environmental sequencing datasets. Antonie van Leeuwenhoek. 2011;100:471–475. doi: 10.1007/s10482-011-9598-6. [DOI] [PubMed] [Google Scholar]
- Berry D, Ben-Mahfoudh K, Wagner M, Loy A. Barcoded primers used in multiplex amplicon pyrosequencing bias amplification. Applied and Environmental Microbiology. 2011;77:7846–7849. doi: 10.1128/AEM.05220-11. [DOI] [PMC free article] [PubMed] [Google Scholar]
- Bik HM, Porazinska DL, Creer S, Caporaso JG, Knight R, Thomas WK. Sequencing our way towards understanding global eukaryotic biodiversity. Trends in Ecology and Evolution. 2012;27:233–243. doi: 10.1016/j.tree.2011.11.010. [DOI] [PMC free article] [PubMed] [Google Scholar]
- Boddy L. Interspecific combative interactions between wood-decaying basidiomycetes. FEMS Microbiology Ecology. 2000;31:185–194. doi: 10.1111/j.1574-6941.2000.tb00683.x. [DOI] [PubMed] [Google Scholar]
- Bödeker ITM, Nygren CMR, Taylor AFS, Olson Å, Lindahl BD. ClassII peroxidase encoding genes are present in a wide phylogenetic range of ectomycorrhizal fungi. The ISME Journal. 2009;3:1387–1395. doi: 10.1038/ismej.2009.77. [DOI] [PubMed] [Google Scholar]
- Bragg L, Stone G, Imelfort M, Hugenholtz P, Tyson GW. Fast, accurate error-correction of amplicon pyrosequences using Acacia. Nature Methods. 2012;9:425–426. doi: 10.1038/nmeth.1990. [DOI] [PubMed] [Google Scholar]
- Buee M, Reich M, Murat C, Morin E, Nilsson RH, Uroz S, Martin F. 454 pyrosequencing analyses of forest soils reveal an unexpectedly high fungal diversity. New Phytologist. 2009;184:449–456. doi: 10.1111/j.1469-8137.2009.03003.x. [DOI] [PubMed] [Google Scholar]
- Caporaso JG, Kuczynski J, Stombaugh J, Bittinger K, Bushman FD, Costello EK, Fierer N, Peña AG, Goodrich JK, Gordon JI, et al. QIIME allows analysis of high-throughput community sequencing data. Nature Methods. 2010;7:335–336. doi: 10.1038/nmeth.f.303. [DOI] [PMC free article] [PubMed] [Google Scholar]
- Carlsen T, Bjørnsgaard-Aas A, Lindner D, Vrålstad T, Schumacher T, Kauserud H. Don't make a mista(g)ke: is tag switching an overlooked source of error in amplicon pyrosequencing studies? Fungal Ecology. 2012;5:747–749. [Google Scholar]
- Christen R. Global sequencing: a review of current molecular data and new methods available to assess microbial diversity. Microbes and Environments. 2008;23:253–268. doi: 10.1264/jsme2.me08525. [DOI] [PubMed] [Google Scholar]
- Coleman AW. Is there a molecular key to the level of “biological species” in eukaryotes? A DNA guide. Molecular Phylogenetics and Evolution. 2009;50:197–203. doi: 10.1016/j.ympev.2008.10.008. [DOI] [PubMed] [Google Scholar]
- Courty P-E, Franc A, Garbaye J. Temporal changes in the ectomycorrhizal community in two soil horizons of a temperate oak forest. Applied and Environmental Microbiology. 2008;74:5792–5801. doi: 10.1128/AEM.01592-08. [DOI] [PMC free article] [PubMed] [Google Scholar]
- Davey ML, Heegaard E, Halvorsen R, Ohlson M, Kauserud H. Seasonal trends in the biomass and structure of bryophyte-associated fungal communities explored by 454 pyrosequencing. New Phytologist. 2012;195:844–856. doi: 10.1111/j.1469-8137.2012.04215.x. [DOI] [PubMed] [Google Scholar]
- Dickie IA. Insidious effects of sequencing errors on perceived diversity in molecular surveys. New Phytologist. 2010;188:916–918. doi: 10.1111/j.1469-8137.2010.03473.x. [DOI] [PubMed] [Google Scholar]
- Dickie IA, Xu B, Koide RT. Vertical niche differentiation of ectomycorrhizal hyphae in soil as shown by T-RFLP analysis. New Phytologist. 2002;156:527–535. doi: 10.1046/j.1469-8137.2002.00535.x. [DOI] [PubMed] [Google Scholar]
- Douhan GW, Vincenot L, Gryta H, Selosse MA. Population genetics of ectomycorrhizal fungi: from current knowledge to emerging directions. Fungal Biology. 2011;115:569–597. doi: 10.1016/j.funbio.2011.03.005. [DOI] [PubMed] [Google Scholar]
- Eddy SR. Accelerated Profile HMM Searches. PLoS Computational Biology. 2011;7:e1002195. doi: 10.1371/journal.pcbi.1002195. [DOI] [PMC free article] [PubMed] [Google Scholar]
- Edgar RC. Search and clustering orders of magnitude faster than BLAST. Bioinformatics. 2010;26:2460–2461. doi: 10.1093/bioinformatics/btq461. [DOI] [PubMed] [Google Scholar]
- Engelbrektson A, Kunin V, Wrighton KC, Zvenigorodsky N, Chen F, Ochman H, Hugenholtz P. Experimental factors affecting PCR-based estimates of microbial species richness and evenness. The ISME Journal. 2010;4:642–647. doi: 10.1038/ismej.2009.153. [DOI] [PubMed] [Google Scholar]
- Faircloth BC, Glenn TC. Not all sequence tags are created equal: designing and validating sequence identification tags robust to indels. PLoS ONE. 2012;7:e42543. doi: 10.1371/journal.pone.0042543. [DOI] [PMC free article] [PubMed] [Google Scholar]
- Fonseca VG, Nichols B, Lallias D, Quince C, Carvalho GR, Power DM, Creer S. Sample richness and genetic diversity as drivers of chimera formation in nSSU metagenetic analyses. Nucleic Acids Research. 2012;40:e66. doi: 10.1093/nar/gks002. [DOI] [PMC free article] [PubMed] [Google Scholar]
- Freeman KR, Martin AP, Karki D, Lynch RC, Mitter MS, Meyer AF, Longcore JE, Simmons DR, Schmidt SK. Evidence that chytrids dominate fungal communities in high-elevation soils. Proceedings of the National Academy of Sciences, USA. 2009;106:18315–18320. doi: 10.1073/pnas.0907303106. [DOI] [PMC free article] [PubMed] [Google Scholar]
- Gardes M, Bruns TD. ITS primers with enhanced specificity for basidiomycetes – application to the identification of mycorrhizae and rusts. Molecular Ecology. 1993;2:113–118. doi: 10.1111/j.1365-294x.1993.tb00005.x. [DOI] [PubMed] [Google Scholar]
- Gazis R, Rehner S, Chaverri P. Species delimitation in fungal endophyte diversity studies and its implications in ecological and biogeographic inferences. Molecular Ecology. 2011;20:3001–3013. doi: 10.1111/j.1365-294X.2011.05110.x. [DOI] [PubMed] [Google Scholar]
- Gihring TM, Green SJ, Schadt CW. Massively parallel rRNA gene sequencing exacerbates the potential for biased community diversity comparisons due to variable library sizes. Environmental Microbiology. 2012;14:285–290. doi: 10.1111/j.1462-2920.2011.02550.x. [DOI] [PubMed] [Google Scholar]
- Glenn TC. Field guide to next-generation DNA sequencers. Molecular Ecology Resources. 2011;11:759–769. doi: 10.1111/j.1755-0998.2011.03024.x. [DOI] [PubMed] [Google Scholar]
- Gobet A, Quince C, Ramette A. Multivariate Cutoff Level Analysis (MultiCoLA) of large community data sets. Nucleic Acids Research. 2010;38:e155. doi: 10.1093/nar/gkq545. [DOI] [PMC free article] [PubMed] [Google Scholar]
- Gollotte A, van Tuinen D, Atkinson D. Diversity of arbuscular mycorrhizal fungi colonising roots of the grass species Agrostis capillaris and Lolium perenne in a field experiment. Mycorrhiza. 2004;14:111–117. doi: 10.1007/s00572-003-0244-7. [DOI] [PubMed] [Google Scholar]
- Grant S, Grant WD, Cowan DA, Jones BE, Ma YH, Ventosa A, Heaphy S. Identification of eukaryotic open reading frames in metagenomic cDNA libraries made from environmental samples. Applied and Environmental Microbiology. 2006;72:135–143. doi: 10.1128/AEM.72.1.135-143.2006. [DOI] [PMC free article] [PubMed] [Google Scholar]
- Haas BJ, Gevers D, Earl AM, Feldgarden M, Ward DV, Giannoukos G, Ciulla D, Tabbaa D, Highlander SK, Södergren E, et al. Chimeric 16S rRNA sequence formation and detection in Sanger and 454-pyrosequenced PCR amplicons. Genome Research. 2011;21:494–504. doi: 10.1101/gr.112730.110. [DOI] [PMC free article] [PubMed] [Google Scholar]
- Hamady M, Lozupone C, Knight R. Fast UniFrac: facilitating high-throughput phylogenetic analyses of microbial communities including analysis of pyrosequencing and PhyloChip data. The ISME Journal. 2010;4:17–27. doi: 10.1038/ismej.2009.97. [DOI] [PMC free article] [PubMed] [Google Scholar]
- Hao X, Jiang R, Chen T. Clustering 16S rRNA for OTU prediction: a method of unsupervised Bayesian clustering. Bioinformatics. 2011;27:611–618. doi: 10.1093/bioinformatics/btq725. [DOI] [PMC free article] [PubMed] [Google Scholar]
- Hartmann M, Howes CG, Abarenkov K, Mohn WW, Nilsson RH. V-Xtractor: an open-source, high-throughput software tool to identify and extract hypervariable regions of small subunit (16 S/18 S) ribosomal RNA gene sequences. Journal of Microbiological Methods. 2010;83:250–253. doi: 10.1016/j.mimet.2010.08.008. [DOI] [PubMed] [Google Scholar]
- Hartmann M, Howes CG, Vaninsberghe D, Yu H, Bachar D, Christen R, Nilsson RH, Hallam SJ, Mohn WW. Significant and persistent impact of timber harvesting on soil microbial communities in northern coniferous forests. The ISME Journal. 2012;6:2199–2218. doi: 10.1038/ismej.2012.84. [DOI] [PMC free article] [PubMed] [Google Scholar]
- Herrera ML, Vallor AC, Gelfond JA, Patterson TF, Wickes BL. Strain-dependent variation in 18S ribosomal DNA copy numbers in Aspergillus fumigatus. Journal of Clinical Microbiology. 2009;47:1325–1332. doi: 10.1128/JCM.02073-08. [DOI] [PMC free article] [PubMed] [Google Scholar]
- Hibbett DS, Gilbert LB, Donoghue MJ. Evolutionary instability of ectomycorrhizal symbioses in basidiomycetes. Nature. 2000;407:506–508. doi: 10.1038/35035065. [DOI] [PubMed] [Google Scholar]
- Huber JA, Morrison HG, Huse SM, Neal PR, Sogin ML, Welch DBM. Effect of PCR amplicon size on assessments of clone library microbial diversity and community structure. Environmental Microbiology. 2009;11:1292–1302. doi: 10.1111/j.1462-2920.2008.01857.x. [DOI] [PMC free article] [PubMed] [Google Scholar]
- Huse SM, Welch DM, Morrison HG, Sogin ML. Ironing out the wrinkles in the rare biosphere through improved OTU clustering. Environmental Microbiology. 2010;12:1889–1898. doi: 10.1111/j.1462-2920.2010.02193.x. [DOI] [PMC free article] [PubMed] [Google Scholar]
- Huson DH, Mitra S, Weber N, Ruscheweyh H, Schuster SC. Integrative analysis of environmental sequences using MEGAN4. Genome Research. 2011;21:1552–1560. doi: 10.1101/gr.120618.111. [DOI] [PMC free article] [PubMed] [Google Scholar]
- Ihrmark K, Bödeker ITM, Cruz-Martinez K, Friberg H, Kubartova A, Schenck J, Strid Y, Stenlid J, Brandström-Durling M, Clemmensen KE, et al. New primers to amplify the fungal ITS2 region – evaluation by 454-sequencing of artificial and natural communities. FEMS Microbiology Ecology. 2012;82:666–677. doi: 10.1111/j.1574-6941.2012.01437.x. [DOI] [PubMed] [Google Scholar]
- James TY, Kauff F, Schoch CL, Matheny PB, Hofstetter V, Cox CJ, Celio G, Gueidan C, Fraker E, Miadlikowska J, et al. Reconstructing the early evolution of Fungi using a six-gene phylogeny. Nature. 2006;443:818–822. doi: 10.1038/nature05110. [DOI] [PubMed] [Google Scholar]
- Jumpponen A, Jones KL. Massively parallel 454 sequencing indicates hyperdiverse fungal communities in temperate quercus macrocarpa phyllosphere. New Phytologist. 2009;184:438–448. doi: 10.1111/j.1469-8137.2009.02990.x. [DOI] [PubMed] [Google Scholar]
- Kanagawa T. Bias and artifacts in multitemplate polymerase chain reactions (PCR) Journal of Bioscience and Bioengineering. 2003;96:317–323. doi: 10.1016/S1389-1723(03)90130-7. [DOI] [PubMed] [Google Scholar]
- Kang S, Mansfield MA, Park B, Geiser DM, Ivors KL, Coffey MD, Grunwald NJ, Martin FN, Levesque CA, Blair JE. The promise and pitfalls of sequence-based identification of plant-pathogenic fungi and oomycetes. Phytopathology. 2010;100:732–737. doi: 10.1094/PHYTO-100-8-0732. [DOI] [PubMed] [Google Scholar]
- Katoh K, Frith MC. Adding unaligned sequences into an existing alignment using MAFFT and LAST. Bioinformatics. 2012;28:3144–3146. doi: 10.1093/bioinformatics/bts578. [DOI] [PMC free article] [PubMed] [Google Scholar]
- Kauserud H, Kumar S, Brysting AK, Nordén J, Carlsen T. High consistency between replicate 454 pyrosequencing analyses of ectomycorrhizal plant root samples. Mycorrhiza. 2012;22:309–315. doi: 10.1007/s00572-011-0403-1. [DOI] [PubMed] [Google Scholar]
- Kebaara BW, Nielsen LE, Nickerson KW, Atkin AL. Determination of mRNA half-lives in Candida albicans using thiolutin as a transcription inhibitor. Genome. 2006;49:894–899. doi: 10.1139/g06-046. [DOI] [PubMed] [Google Scholar]
- Kellner H, Zak DR, Vandenbol M. Fungi unearthed: transcripts encoding lignocellulolytic and chitinolytic enzymes in forest soil. PLoS ONE. 2010;5:e10971. doi: 10.1371/journal.pone.0010971. [DOI] [PMC free article] [PubMed] [Google Scholar]
- Kerekes J, Kaspari M, Stevenson B, Nilsson RH, Hartmann M, Amend A, Bruns TD. Nutrient enrichment increased species richness of leaf litter fungal assemblages in a tropical forest. Molecular Ecology. 2013 doi: 10.1111/mec.12259. doi: 10.1111/mec.12259. [DOI] [PubMed] [Google Scholar]
- Koetschan C, Förster F, Keller A, Schleicher T, Ruderisch B, Schwarz R, Müller T, Wolf M, Schultz J. The ITS2 Database III - sequences and structures for phylogeny. Nucleic Acids Research. 2010;38:D275–D279. doi: 10.1093/nar/gkp966. [DOI] [PMC free article] [PubMed] [Google Scholar]
- Koš M, Tollervey D. Yeast pre-rRNA processing and modification occur cotranscriptionally. Molecular Cell. 2010;37:745–746. doi: 10.1016/j.molcel.2010.02.024. [DOI] [PMC free article] [PubMed] [Google Scholar]
- Krüger M, Stockinger H, Krüger C, Schüssler A. DNA-based species level detection of Glomeromycota: one PCR primer set for all arbuscular mycorrhizal fungi. New Phytologist. 2009;183:212–223. doi: 10.1111/j.1469-8137.2009.02835.x. [DOI] [PubMed] [Google Scholar]
- Kumar S, Carlsen T, Mevik B-H, Enger P, Blaalid R, Shalchian-Tabrizi K, Kauserud H. CLOTU: an online pipeline for processing and clustering of 454 amplicon reads into OTUs followed by taxonomic annotation. BMC Bioinformatics. 2011;12:182. doi: 10.1186/1471-2105-12-182. [DOI] [PMC free article] [PubMed] [Google Scholar]
- Kunin V, Engelbrektson A, Ochman H, Hugenholtz P. Wrinkles in the rare biosphere: pyrosequencing errors can lead to artificial inflation of diversity estimates. Environmental Microbiology. 2010;12:118–123. doi: 10.1111/j.1462-2920.2009.02051.x. [DOI] [PubMed] [Google Scholar]
- Kuske CR, Lindahl BD. Metagenomics for study of fungal ecology. In: Martin F, editor. Ecological genomics of the fungi. Hoboken, NJ, USA: Wiley-Blackwell; 2013. [Google Scholar]
- Lahr DJG, Katz LA. Reducing the impact of PCR-mediated recombina-tion in molecular evolution and environmental studies using a new-generation high-fidelity DNA polymerase. BioTechniques. 2009;47:857–863. doi: 10.2144/000113219. [DOI] [PubMed] [Google Scholar]
- Lee J, Lee S, Young JPW. Improved PCR primers for the detection and identification of arbuscular mycorrhizal fungi. FEMS Microbiology Ecology. 2008;65:339–349. doi: 10.1111/j.1574-6941.2008.00531.x. [DOI] [PubMed] [Google Scholar]
- Lekberg Y, Schnoor T, Kjøller R, Gibbons SM, Hansen LH, Al-Soud WA, Sørensen SJ, Rosendahl S. 454-sequencing reveals stochastic local reassembly and high disturbance tolerance within arbuscular mycorrhizal fungal communities. Journal of Ecology. 2012;100:151–160. [Google Scholar]
- Lennon JT. Replication, lies and lesser-known truths regarding experimental design in environmental microbiology. Environmental Microbiology. 2011;13:1383–1386. doi: 10.1111/j.1462-2920.2011.02445.x. [DOI] [PubMed] [Google Scholar]
- Lewis LK, Robson MH, Vecherkina Y, Ji C, Beall GW. Interference with spectrophotometric analysis of nucleic acids and proteins by leaching of chemicals from plastic tubes. BioTechniques. 2010;48:297–302. doi: 10.2144/000113387. [DOI] [PubMed] [Google Scholar]
- Li M, Diehl F, Dressman D, Vogelstein B, Kinzler KW. BEAMing up for detection and quantification of rare sequence variants. Nature Methods. 2006;3:95–97. doi: 10.1038/nmeth850. [DOI] [PubMed] [Google Scholar]
- Lilleskov EA, Bruns TD, Horton TR, Taylor DL, Grogan P. Detection of forest stand-level spatial structure in ectomycorrhizal fungal communities. FEMS Microbiology Ecology. 2004;49:319–332. doi: 10.1016/j.femsec.2004.04.004. [DOI] [PubMed] [Google Scholar]
- Lindahl BD, de Boer W, Finlay RD. Disruption of root carbon transport into forest humus stimulates fungal opportunists at the expense of mycorrhizal fungi. The ISME Journal. 2010;4:872–881. doi: 10.1038/ismej.2010.19. [DOI] [PubMed] [Google Scholar]
- Lindahl BD, Ihrmark K, Boberg J, Trumbore SE, Högberg P, Stenlid J, Finlay RD. Spatial separation of litter decomposition and mycorrhizal nitrogen uptake in a boreal forest. New Phytologist. 2007;173:611–620. doi: 10.1111/j.1469-8137.2006.01936.x. [DOI] [PubMed] [Google Scholar]
- Lindahl BD, Taylor AFS. N-acetylhexosaminidase coding genes in ectomycorrhizal basidiomycetes. New Phytologist. 2004;164:193–199. doi: 10.1111/j.1469-8137.2004.01147.x. [DOI] [PubMed] [Google Scholar]
- Lindner DL, Banik MT. Intragenomic variation in the ITS rDNA region obscures phylogenetic relationships and inflates estimates of operational taxonomic units in genus Laetiporus. Mycologia. 2011;103:731–740. doi: 10.3852/10-331. [DOI] [PubMed] [Google Scholar]
- Liu KL, Porras-Alfaro A, Kuske CR, Eichorst SA, Xie G. Accurate, rapid taxonomic classification of fungal large-subunit rRNA genes. Applied and Environmental Microbiology. 2012;78:1523–1533. doi: 10.1128/AEM.06826-11. [DOI] [PMC free article] [PubMed] [Google Scholar]
- Margulies M, Egholm M, Altman WE, Attiya S, Bader JS, Bemben LA, Berka J, Braverman MS, Chen YJ, Chen ZT, et al. Genome sequencing in microfabricated high-density picolitre reactors. Nature. 2005;437:376–380. doi: 10.1038/nature03959. [DOI] [PMC free article] [PubMed] [Google Scholar]
- Martin-Laurent F, Philippot L, Hallet S, Chaussod R, Germon JC, Soulas G, Catroux G. DNA extraction from soils: old bias for new microbial diversity analysis methods. Applied and Environmental Microbiology. 2001;67:2354–2359. doi: 10.1128/AEM.67.5.2354-2359.2001. [DOI] [PMC free article] [PubMed] [Google Scholar]
- Mello A, Napoli C, Murat C, Morin E, Marceddu G, Bonfante P. ITS-1 versus ITS-2 pyrosequencing: a comparison of fungal populations in truffle grounds. Mycologia. 2011;103:1184–1193. doi: 10.3852/11-027. [DOI] [PubMed] [Google Scholar]
- Nilsson RH, Kristiansson E, Ryberg M, Hallenberg N, Larsson K-H. Intraspecific ITS variability in the kingdom fungi as expressed in the international sequence databases and its implications for molecular species identification. Evolutionary Bioinformatics. 2008;4:193–201. doi: 10.4137/ebo.s653. [DOI] [PMC free article] [PubMed] [Google Scholar]
- Nilsson RH, Ryberg M, Abarenkov K, Sjökvist E, Kristiansson E. The ITS region as a target for characterization of fungal communities using emerging sequencing technologies. FEMS Microbiology Letters. 2009;296:97–101. doi: 10.1111/j.1574-6968.2009.01618.x. [DOI] [PubMed] [Google Scholar]
- Nilsson RH, Tedersoo L, Lindahl BD, Kjøller R, Carlsen T, Quince C, Abarenkov K, Pennanen T, Stenlid J, Bruns T, et al. Towards standardization of the description and publication of next-generation sequencing datasets of fungal communities. New Phytologist. 2011;191:314–318. doi: 10.1111/j.1469-8137.2011.03755.x. [DOI] [PubMed] [Google Scholar]
- Öpik M, Metsis M, Daniell TJ, Zobel M, Moora M. Large-scale parallel 454 sequencing reveals host ecological group specificity of arbuscular mycorrhizal fungi in a boreonemoral forest. New Phytologist. 2009;184:424–437. doi: 10.1111/j.1469-8137.2009.02920.x. [DOI] [PubMed] [Google Scholar]
- Öpik M, Vanatoa A, Vanatoa E, Moora M, Davison J, Kalwij JM, Reier U, Zobel M. The online database MaarjAM reveals global and ecosystemic distribution patterns in arbuscular mycorrhizal fungi (Glomeromycota) New Phytologist. 2010;188:223–241. doi: 10.1111/j.1469-8137.2010.03334.x. [DOI] [PubMed] [Google Scholar]
- Parameswaran P, Jalili R, Tao L, Shokralla S, Gharizadeh B, Ronaghi M, Fire AZ. A pyrosequencing-tailored nucleotide barcode design unveils opportunities for large-scale sample multiplexing. Nucleic Acids Research. 2007;35:e130. doi: 10.1093/nar/gkm760. [DOI] [PMC free article] [PubMed] [Google Scholar]
- Pennanen T, Caul S, Daniell TJ, Griffiths BS, Ritz K, Wheatley RE. Community-level responses of metabolically-active soil microorganisms to the quantity and quality of substrate inputs. Soil Biology & Biochemistry. 2004;36:841–848. [Google Scholar]
- Petersen L, Minkkinen P, Esbensen KH. Representative sampling for reliable data analysis: theory of Sampling. Chemometrics and Intelligent Laboratory Systems. 2005;77:261–277. [Google Scholar]
- Pickles BJ, Genney DR, Potts JM, Lennon JJ, Anderson IC, Alexander IJ. Spatial and temporal ecology of Scots pine ectomycorrhizas. New Phytologist. 2010;186:755–768. doi: 10.1111/j.1469-8137.2010.03204.x. [DOI] [PubMed] [Google Scholar]
- Polz MF, Cavanaugh CM. Bias in template-to-product ratios in multitemplate PCR. Applied and Environmental Microbiology. 1998;64:3724–3730. doi: 10.1128/aem.64.10.3724-3730.1998. [DOI] [PMC free article] [PubMed] [Google Scholar]
- Porter TM, Golding GB. Factors that affect large subunit ribosomal DNA amplicon sequencing studies of fungal communities: classification method, primer choice, and error. PLoS ONE. 2012;7:e35749. doi: 10.1371/journal.pone.0035749. [DOI] [PMC free article] [PubMed] [Google Scholar]
- Prosser JI. Replicate or lie. Environmental Microbiology. 2010;12:1806–1810. doi: 10.1111/j.1462-2920.2010.02201.x. [DOI] [PubMed] [Google Scholar]
- Pruesse E, Quast C, Knittel K, Fuchs B, Ludwig W, Peplies J, Glöckner FO. SILVA: a comprehensive online resource for quality checked and aligned ribosomal RNA sequence data compatible with ARB. Nucleic Acids Research. 2007;35:7188–7196. doi: 10.1093/nar/gkm864. [DOI] [PMC free article] [PubMed] [Google Scholar]
- Quince C, Lanzen A, Curtis TP, Davenport RJ, Hall N, Head IM, Read LF, Sloan WT. Accurate determination of microbial diversity from 454 pyrosequencing data. Nature Methods. 2009;6:639–641. doi: 10.1038/nmeth.1361. [DOI] [PubMed] [Google Scholar]
- Quince C, Lanzen A, Turnbaugh PJ. Removing noise from pyrosequenced amplicons. BMC Bioinformatics. 2011;12:38. doi: 10.1186/1471-2105-12-38. [DOI] [PMC free article] [PubMed] [Google Scholar]
- Rajala T, Peltoniemi M, Hantula J, Mäkipää R, Pennanen T. RNA reveals a succession of active fungi during the decay of Norway spruce logs. Fungal Ecology. 2011;4:437–444. [Google Scholar]
- Reeder J, Knight R. Rapid denoising of pyrosequencing amplicon data: exploiting the rank-abundance distribution. Nature Methods. 2010;7:668–669. doi: 10.1038/nmeth0910-668b. [DOI] [PMC free article] [PubMed] [Google Scholar]
- Rosen MJ, Callahan BJ, Fisher DS, Holmes SP. Denoising PCR-amplified metagenome data. BMC Bioinformatics. 2012;13:283. doi: 10.1186/1471-2105-13-283. [DOI] [PMC free article] [PubMed] [Google Scholar]
- Russell DJ, Way SF, Benson AK, Sayood K. A grammar-based distance metric enables fast and accurate clustering of large sets of 16S sequences. BMC Bioinformatics. 2010;11:601. doi: 10.1186/1471-2105-11-601. [DOI] [PMC free article] [PubMed] [Google Scholar]
- Sanders IR, Croll D. Arbuscular mycorrhiza: the challenge to understand the genetics of the fungal partner. Annual Review of Genetics. 2010;44:271–292. doi: 10.1146/annurev-genet-102108-134239. [DOI] [PubMed] [Google Scholar]
- Schloss PD, Westcott SL, Ryabin T, Hall JR, Hartmann M, Hollister EB, Lesniewski RA, Oakley BB, Parks DH, Robinson CJ, et al. Introducing mothur: open-source, platform-independent, community-supported software for describing and comparing microbial communities. Applied and Environmental Microbiology. 2009;75:7537–7541. doi: 10.1128/AEM.01541-09. [DOI] [PMC free article] [PubMed] [Google Scholar]
- Schoch CL, Seifert KA, Huhndorf S, Robert V, Spouge JL, Levesque CA, Chen W. Nuclear ribosomal internal transcribed spacer (ITS) region as a universal DNA barcode marker for Fungi. Proceedings of the National Academy of Sciences, USA. 2012;109:6241–6246. doi: 10.1073/pnas.1117018109. [DOI] [PMC free article] [PubMed] [Google Scholar]
- Shokralla S, Spall JL, Gibson JF, Hajibabaei M. Next-generation sequencing technologies for environmental DNA research. Molecular Ecology. 2012;21:1794–1805. doi: 10.1111/j.1365-294X.2012.05538.x. [DOI] [PubMed] [Google Scholar]
- Smith ML, Bruhn JN, Anderson JB. The fungus Armillaria bulbosa is among the largest and oldest living organisms. Nature. 1992;356:428–431. [Google Scholar]
- Stockinger H, Kruger M, Schussler A. DNA barcoding of arbuscular mycorrhizal fungi. New Phytologist. 2010;187:461–474. doi: 10.1111/j.1469-8137.2010.03262.x. [DOI] [PubMed] [Google Scholar]
- Taberlet P, Prud'homme SM, Campione E, Roy J, Miquel C, Shehzad W, Gielly L, Rioux D, Choler P, Clément J-C, et al. Soil sampling and isolation of extracellular DNA from large amount of starting material suitable for metabarcoding studies. Molecular Ecology. 2012;21:1816–1820. doi: 10.1111/j.1365-294X.2011.05317.x. [DOI] [PubMed] [Google Scholar]
- Tanner MA, Goebel BM, Dojka MA, Pace NR. Specific ribosomal DNA sequences from diverse environmental settings correlate with experimental contaminants. Applied and Environmental Microbiology. 1998;64:3110–3113. doi: 10.1128/aem.64.8.3110-3113.1998. [DOI] [PMC free article] [PubMed] [Google Scholar]
- Tedersoo L, Abarenkov K, Nilsson RH, Schussler A, Grelet GA, Kohout P, Oja J, Bonito GM, Veldre V, Jairus T, et al. Tidying up international nucleotide sequence databases: ecological, geographical, and sequence quality annotation of ITS sequences of mycorrhizal fungi. PLoS ONE. 2011;6:e24940. doi: 10.1371/journal.pone.0024940. [DOI] [PMC free article] [PubMed] [Google Scholar]
- Tedersoo L, Jairus T, Horton BM, Abarenkov K, Suvi T, Saar I, Kõljalg U. Strong host preference of ectomycorrhizal fungi in a Tasmanian wet sclerophyll forest as revealed by DNA barcoding and taxon-specific primers. New Phytologist. 2008;180:479–490. doi: 10.1111/j.1469-8137.2008.02561.x. [DOI] [PubMed] [Google Scholar]
- Tedersoo L, May TW, Smith ME. Ectomycorrhizal lifestyle in fungi: global diversity, distribution, and evolution of phylogenetic lineages. Mycorrhiza. 2010b;20:217–263. doi: 10.1007/s00572-009-0274-x. [DOI] [PubMed] [Google Scholar]
- Tedersoo L, Nilsson RH, Abarenkov K, Jairus T, Sadam A, Saar I, Bahram M, Bechem E, Chuyong G, Kõljalg U. 454 pyrosequencing and Sanger sequencing of tropical mycorrhizal fungi provide similar results but reveal substantial methodological biases. New Phytologist. 2010a;188:291–301. doi: 10.1111/j.1469-8137.2010.03373.x. [DOI] [PubMed] [Google Scholar]
- Toju H, Tanabe AS, Yamamoto S, Sato H. High-coverage ITS primers for the DNA-based identification of ascomycetes and basidiomycetes in environmental samples. PLoS ONE. 2012;7:e40863. doi: 10.1371/journal.pone.0040863. [DOI] [PMC free article] [PubMed] [Google Scholar]
- van Tuinen D, Jacquot E, Zhao B, Gollotte A, Gianinazzi-Pearson V. Charecterization of root colonization profiles by a microcosm community of arbuscular mycorrhizal fungi using 25S rDNA-targeted nested PCR. Molecular Ecology. 1998;7:879–887. doi: 10.1046/j.1365-294x.1998.00410.x. [DOI] [PubMed] [Google Scholar]
- Wallander H, Johansson U, Sterkenburg E, Brandström-Durling M, Lindahl BD. Production of ectomycorrhizal mycelium peaks during canopy closure in Norway spruce forests. New Phytologist. 2010;187:1124–1134. doi: 10.1111/j.1469-8137.2010.03324.x. [DOI] [PubMed] [Google Scholar]
- Wang Q, Garrity GM, Tiedje JM, Cole JR. Naive Bayesian classifier for rapid assignment of rRNA sequences into the new bacterial taxonomy. Applied and Environmental Microbiology. 2007;73:5261–5267. doi: 10.1128/AEM.00062-07. [DOI] [PMC free article] [PubMed] [Google Scholar]
- White TJ, Bruns T, Lee S, Taylor J. Amplification and direct sequencing of fungal ribosomal RNA genes for phylogenetics. In: Innis MA, Gelfland DH, Sninsky JJ, White TJ, editors. PCR protocols: a guide to methods and applications. San Diego, CA, USA: Academic Press; 1990. pp. 315–322. [Google Scholar]
- Wilson IG. Inhibition and facilitation of nucleic acid amplification. Applied and Environmental Microbiology. 1997;63:3741–3751. doi: 10.1128/aem.63.10.3741-3751.1997. [DOI] [PMC free article] [PubMed] [Google Scholar]