

Abstract
In this communication, we report that ionizable, tertiary amine-based block copolymers can be used as pH-responsive contrast agents for magnetic resonance imaging (MRI) through the chemical exchange saturation transfer (CEST) mechanism. The CEST signal is essentially “off” when the polymers form micelles near physiological pH but is activated to the “on” state when the micelle dissociates in an acidic environment.
Balaban and coworkers first reported a new class of contrast agents for magnetic resonance imaging (MRI) based on a chemical exchange saturation transfer (CEST) mechanism.1, 2 In biological systems, many endogenous CEST agents exist either as small biomolecules or macromolecules with exchangeable -NH or -OH protons.3–6 Exogenous CEST agents can also be designed to respond to a variety of physiological signals such as pH, temperature, enzyme activity or metabolite levels.7–13 This new technology offers a multitude of new venues for in vivo molecular imaging using standard MRI scanners.
In our previous studies, we reported that a series of tertiary amine-based block copolymers, such as poly(ethylene glycol)-b-poly[2-(diisopropylamino) ethyl methacrylate] (PEG-b-PDPA), that form micelles at pH 7.4 and dissociate over a sharp pH range below 6.3. The micelles dissociate into unimers in acidic environments due to the switch of the amine block of PDPA from hydrophobic to hydrophilic/charged state that parallels protonation of tertiary amine groups (Scheme 1).14, 15 The pH response is sharp (ΔpH < 0.25 pH units) and tunable (the transition pH, pHt, is adjustable by changing the side chains of tertiary amines). Since the major difference between the micelle and unimer states is the protonation of tertiary amines (where resulting ammonium groups have exchangeable protons), we anticipated that these copolymers may also serve as activatable MRI contrast agents via a CEST mechanism. Conceivably, the CEST signal would be silent near physiological pH (i.e. the micellar form does not contain exchangeable protons) but would be turned “on” in acidic environments after the micelles dissociate into protonated unimers having exchangeable protons.
Scheme 1.

The micelle/unimer equilibrium in the block copolymer, PEG114-b-PDPA116 is exquisitely sensitive to pH.
To investigate the feasibility of this approach, PEG114-b-PDPA116 copolymer (114 and 116 refer to the numbers of repeating units in PEG and PDPA segments, respectively) was synthesized and used as a model system (Scheme 1 and Figure S1 in the Supporting Information). Two major aspects were considered: (1) PEG-b-PDPA copolymers had been intensively characterized in previous studies as ultra pH-responsive fluorescent probes;15 and (2) the pKa of PEG-b-PDPA is ca. one pH unit below physiological pH so that it will have large enough differences to be silent in blood yet potentially show a CEST signal only from acidic tissues. Experimentally, the pKa of PEG114-b-PDPA116 as determined by a pH titration (Figure S2 in the Supporting Information) was 6.27. This pKa is 0.4 pH unit lower than that reported for a similar copolymer with a shorter PDPAn segment (n = 80) and additional fluorescent dyes (tetramethyl rhodamine).15 In addition, the critical micelle concentration (CMC) (Figure S3) was found to be 0.15 μg/ml for PEG114-b-PDPA116, about 6-fold lower than that of PEG114-b-PDPA80 (CMC = 0.9 μg/ml).15
Figure 1a shows the pH dependence of the hydrodynamic diameter (Dh, nm) of PEG-b-PDPA as measured by the dynamic light scattering (DLS). Clearly, the micelle transition pHt occurs at ca. 5.9, about 0.4 pH units lower than that of a similar block copolymer with a shorter PDPAn segment (n = 80).15 To evaluate the protonation status, the Zeta potential of PEG-b-PDPA was also measured as a function of pH (Fig. 1b). At high pH values where the amines are de-protonated and micelles dominate, the small negative Zeta potential reflects small amounts of OH− and Cl− anions introduced during sample preparation. As the pH is lowered, protonation (H+) of the tertiary amines occurs and the PDPA segments acquire positive charge. It is worth noting that the charge crossover point (the point of zero charge) is approximately pH 7.2, about one pH unit above the pKa of the amine. In contrast, the Zeta potential increases much more dramatically as the pH approaches pHt at ~5.9. This indicates that the protonation of the block copolymer is dramatically increased during the transition from micelles to unimers.
Fig. 1.

(a) The hydrodynamic diameter (Dh, nm) and (b) Zeta potential (mV) of PEG-b-PDPA as a function of pH.
To examine the CEST feasibility of PEG-b-PDPA, the polymer was prepared into micelles at a polymer concentration of 0.5 mM following published procedures.14 The stock solution was dispersed in a 0.1 M buffer consisting of 2-(N-morpholino) ethanesulfonic acid (MES) and/or 3-morpholinopropane-1-sulfonic acid (MOPS) to achieve a stable pH value. The sample was ultracentrifuged using centifuge filtration tubes with a 3 kD molecular weight cutoff (MWCO) filter. Samples of buffer alone were tested and found to have no CEST signal (Figure S4 in the Supporting Information). Figure 2a illustrates typical CEST spectra for PEG-b-PDPA solution at pH 5.0 and 7.5, respectively. Each data point in a CEST spectrum reflects the intensity of solvent water signal in the 1H NMR spectrum after applying a 5 s RF saturation pulse at power level of 9.4 μT at 160 different saturation frequency offsets over the range ±20 ppm.1, 2 The negative peak at 0 ppm in these spectra reflects direct saturation of the solvent water resonance (Note: the chemical shift of bulk water was manually set to 0 ppm to better visualize the CEST peak). At pH 7.5, there is no evidence for the exchanging species that could produce CEST. At pH 5.0, however, the CEST spectrum shows quite a different lineshape, namely, an additional exchange peak appears as a shoulder at ca. 2–5 ppm downfield of water. This can be assigned to CEST from the exchangeable protons on the tertiary ammonium groups. Assuming that all protonated tertiary amines have an identical proton exchange rate and chemical shift, this CEST spectrum should fit well to a simple 2-pool chemical exchange model involving proton exchange between R3N-H+ and H2O protons. The solid line in Fig. 2a shows the fit of the CEST data at pH 5.0 to the Bloch equations for a 2-pool model.16 The ammonium proton lifetime (τex) in PEG-b-PDPA at pH 5.0 was ~890 μs using this fitting procedure. In addition, the corresponding monomeric analogs, N,N-diisopropylethylamine and N,N-diisopropylaminoethanol, were found to have similar CEST features (Figure S5). These data support the assignment of the CEST peak appearing near 2–5 ppm to the exchangeable amine proton in the polymeric form of PEG-b-PDPA.
Fig. 2.

(a) Representative CEST spectra of PEG-b-PDPA at pH 5.0 and 7.5, respectively; (b) a plot of MTRasymversus the saturation frequency offset at pH range between 5.0 and 7.5; (c) a plot of MTRasym (±3.8ppm) versus pH and (d) a plot of MTRasymversus PEG-b-PDPA copolymer concentration at a fixed pH of 5.8. All data were acquired on a B0 = 9.4 T NMR spectrometer (400 MHz for 1H).
The CEST effect can be better visualized in a plot of the assymetric intensity difference between the MRI signal with presaturation on the frequency of exchanging protons (on-freq) versus the MRI signal with presaturation at an equivalent frequency on the opposite side of water (off-freq),13i.e., MTRasym = [(Ms/M0)on freq - (Ms/M0)off freq], as shown in Fig. 2b. For clarity, only those MTRasym spectra over the pH range 5.0 to 7.5 were shown. All CEST spectra and the corresponding MTRasym spectra were recorded in Figure S6. For PEG-b-PDPA, the exchanging protons are activated over a rather broad range of pH values, reaching a maximum at pH ~5. Shown in Fig. 2c is a plot of the MTRasymvs. pH for this system. There are three distinct phases in this plot: (1) the 1st phase above pH 6.5 corresponds to non-protonated micelle state where CEST is “off”; (2) the 2nd phase between pH 5 – 6.5 shows a variable CEST “on” region where the sample is partially converted from micelles to unimers and begins to protonate; and (3) the 3rd phase below pH ~5 where proton exchange gradually becomes too slow to meet the exchange requirement for CEST. Such a bell-shaped dependence of CEST versus pH values was previously observed in a paramagnetic CEST system.17 In the 1st and 2nd phases, the CEST effects present a typical switch from the totally “off” (pH > 6.5) to gradually “on” (pH < 6.5). By comparing the data shown in Fig. 1b and Fig. 2c, one could conclude that the CEST effects should be proportional to the protonation percentages of the tertiary amino groups. These NMR spectroscopic data do reveal the feasibility that PEG-b-PDPA might be able to serve as MRI CEST agent over a physiological relevant pH range.
The sensitivity of detection for a contrast agent is an important parameter. Shown in Fig. 2d is a plot of MTRasymvs. the polymer concentration at pH 5.8 (Note: This data set was acquired using a shorter saturation duration time of 3 s.). This shows that ~0.1 mM polymer is required to produce ~3% CEST signal. This sensitivity is similar in order of magnitude to other small molecular CEST agents1, 2 or polymeric CEST agents on a per-monomer basis.18
To further demonstrate the feasibility of using CEST to image pH by MRI, a phantom was prepared consisting of seven plastic tubes filled with 0.5 mM PEG-b-PDPA solutions at different pH values (Fig. 3d). A 3 s saturation pulse (B1 = 8.2 μT) was applied at the different frequency offsets, varying from +10 ppm to −10 ppm with a decreased step of 0.2 ppm. Shown in Fig. 3a and 3b are the raw images at saturation frequency offsets of +3.8 ppm and −3.8 ppm, respectively. The CEST image (Fig. 3c) was obtained via an image subtraction in pixel wise (Fig. 3a – Fig. 3b). Shown in Fig. 3e is a quantified plot of MTRasym (±3.8 ppm) as a function of pH. The trend has very similar pattern to that of the spectroscopic data shown in Fig. 2c but the absolute values were different because the image intensities are related to many factors such as the MRI hardware settings, the imaging pulse sequences, etc.
Fig. 3.
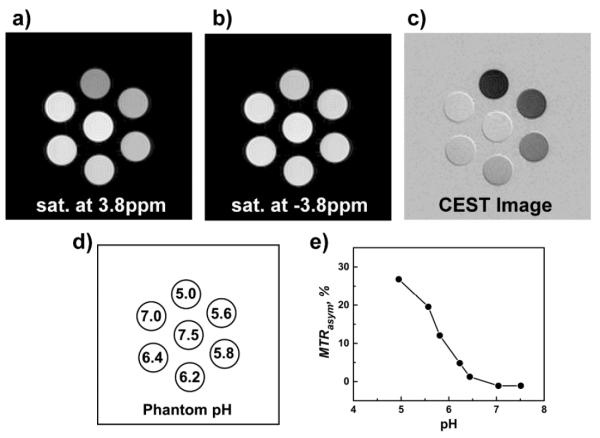
9.4 T MRI images (a–c) of a phantom consisting of seven plastic tubes containing 0.5 mM PEG-b-PDPA solutions in the presence of 0.1 M MES/MOPS buffers at different pH values (d). The images were obtained sequentially by applying a 3 s pre-saturation pulse at either +3.8 ppm or −3.8 ppm at a power level of 8.2 μT, respectively. The CEST image (c) was obtained by image subtraction. The quantified MTRasym between the images (c) and (b) were plotted in (e), which were further normalized to zero for the background.
In summary, we have shown that ionizable polymer-based CEST probes may be used as pH-responsive MRI CEST agents. This system is unique in that CEST is essentially “off” at normal physiological pH and only switched “on” in an acidic environment. This pH-activatable micelle platform may find useful applications for in vivo MRI molecular imaging of acidosis-related metabolic diseases as well as for monitoring the pH-responsive drug delivery using pH-responsive micelles as nanocarriers.
Supplementary Material
Acknowledgements
This research was supported by grants from the National Institutes of Health to JG (CA129011 and EB013149) and ADS (CA-115531 and EB-004582).
Footnotes
Electronic Supplementary Information (ESI) available: polymer synthesis, micelle preparation, pH titration, CMC additional DLS and NMR data. See DOI: 10.1039/b000000x/
Notes and references
- 1.Ward KM, Aletras AH, Balaban RS. Journal of Magnetic Resonance. 2000;143:79–87. doi: 10.1006/jmre.1999.1956. [DOI] [PubMed] [Google Scholar]
- 2.Ward KM, Balaban RS. Magnetic Resonance in Medicine. 2000;44:799–802. doi: 10.1002/1522-2594(200011)44:5<799::aid-mrm18>3.0.co;2-s. [DOI] [PubMed] [Google Scholar]
- 3.Zhou JY, Payen JF, Wilson DA, Traystman RJ, van Zijl PCM. Nature Medicine. 2003;9:1085–1090. doi: 10.1038/nm907. [DOI] [PubMed] [Google Scholar]
- 4.Zhou J, van Zijl PCM. Progress in Nuclear Magnetic Resonance Spectroscopy. 2006;48:109–136. [Google Scholar]
- 5.Gilad AA, McMahon MT, Walczak P, Winnard PT, Raman V, van Laarhoven HWM, Skoglund CM, Bulte JWM, van Zijl PCM. Nat Biotech. 2007;25:217–219. doi: 10.1038/nbt1277. [DOI] [PubMed] [Google Scholar]
- 6.Cai K, Haris M, Singh A, Kogan F, Greenberg JH, Hariharan H, Detre JA, Reddy R. Nat Med. 2012;18:302–306. doi: 10.1038/nm.2615. [DOI] [PMC free article] [PubMed] [Google Scholar]
- 7.Zhang S, Merritt M, Woessner DE, Lenkinski RE, Sherry AD. Accounts of chemical research. 2003;36:783–790. doi: 10.1021/ar020228m. [DOI] [PubMed] [Google Scholar]
- 8.Aime S, Crich S, Gianolio E, Giovenzana G, Tei L, Terreno E. Coordination Chemistry Reviews. 2006;250:1562–1579. [Google Scholar]
- 9.Woods M, Woessner DE, Sherry AD. Chemical Society Reviews. 2006;35:500–511. doi: 10.1039/b509907m. [DOI] [PMC free article] [PubMed] [Google Scholar]
- 10.Aime S, Castelli DD, Crich SG, Gianolio E, Terreno E. Accounts of chemical research. 2009;42:822–831. doi: 10.1021/ar800192p. [DOI] [PubMed] [Google Scholar]
- 11.Ali MM, Liu G, Shah T, Flask CA, Pagel MD. Accounts Of Chemical Research. 2009;42:915–924. doi: 10.1021/ar8002738. [DOI] [PMC free article] [PubMed] [Google Scholar]
- 12.De Leon-Rodriguez LM, Lubag AJM, Malloy CR, Martinez GV, Gillies RJ, Sherry AD. Accounts of chemical research. 2009;42:948–957. doi: 10.1021/ar800237f. [DOI] [PMC free article] [PubMed] [Google Scholar]
- 13.van Zijl PCM, Yadav NN. Magnetic Resonance in Medicine. 2011;65:927–948. doi: 10.1002/mrm.22761. [DOI] [PMC free article] [PubMed] [Google Scholar]
- 14.Zhou K, Wang Y, Huang X, Luby-Phelps K, Sumer BD, Gao J. Angewandte Chemie International Edition. 2011;50:6109–6114. doi: 10.1002/anie.201100884. [DOI] [PMC free article] [PubMed] [Google Scholar]
- 15.Zhou K, Liu H, Zhang S, Huang X, Wang Y, Huang G, Sumer BD, Gao J. J. Am. Chem. Soc. 2012;134:7803–7811. doi: 10.1021/ja300176w. [DOI] [PMC free article] [PubMed] [Google Scholar]
- 16.Woessner DE, Zhang S, Merritt ME, Sherry AD. Magnetic Resonance in Medicine. 2005;53:790–799. doi: 10.1002/mrm.20408. [DOI] [PubMed] [Google Scholar]
- 17.Zhang S, Sherry AD. International Society for Magnetic Resoance in Medicine 10th Scientific Meeting & Exhibition; Honolulu, Hawaii: the United States; 2002. p. 2590. [Google Scholar]
- 18.Goffeney N, Bulte JWM, Duyn J, Bryant LH, van Zijl PCM. J. Am. Chem. Soc. 2001;123:8628–8629. doi: 10.1021/ja0158455. [DOI] [PubMed] [Google Scholar]
Associated Data
This section collects any data citations, data availability statements, or supplementary materials included in this article.