Abstract
Successful high-intensity focused ultrasound (HIFU) thermal tissue ablation relies on accurate information of the tissue temperature and tissue status. Often temperature measurements are used to predict and monitor the ablation process. In this study, we conducted HIFU ablation experiments with ex vivo porcine myocardium tissue specimens to identify changes in temperature associated with tissue coagulation and bubble/cavity formation. Using infrared (IR) thermography and synchronized bright-field imaging with HIFU applied near the tissue surface, parameters derived from the spatiotemporal evolution of temperature were correlated with HIFU-induced lesion formation and overheating, of which the latter typically results in cavity generation and/or tissue dehydration. Emissivity of porcine myocardium was first measured to be 0.857 ± 0.006 (n = 3). HIFU outcomes were classified into non-ablative, normal lesion, and overheated lesion. A marked increase in the rate of temperature change during HIFU application was observed with lesion formation. A criterion using the maximum normalized second time derivative of temperature change provided 99.1% accuracy for lesion identification with a 0.05 s−1 threshold. Asymmetric temperature distribution on the tissue surface was observed to correlate with overheating and/or bubble generation. A criterion using the maximum displacement of the spatial location of the peak temperature provided 90.9% accuracy to identify overheated lesion with a 0.16 mm threshold. Spatiotemporal evolution of temperature obtained using IR imaging allowed determination of the cumulative equivalent minutes at 43 °C (CEM43) for lesion formation to be 170 min. Similar temperature characteristics indicative of lesion formation and overheating were identified for subsurface HIFU ablation. These results suggest that parameters derived from temperature changes during HIFU application are associated with irreversible changes in tissue and may provide useful information for monitoring HIFU treatment.
Keywords: HIFU ablation, temperature, tissue coagulation, lesion monitoring, bubble formation, tissue characterization, thermal dose, infrared thermography, emissivity
1. Introduction
High-intensity focused ultrasound (HIFU) is a promising modality for non-invasive, targeted thermal tissue ablation [1, 2]. HIFU induces tissue coagulation (thermal lesion) by localized heating from thermoviscous absorption of ultrasound energy; hence accurate information of the tissue status (e.g., native, coagulated, or with cavities) during HIFU application in the targeted region is important for providing feedback to ensure the desired HIFU outcome.
Lesion formation via tissue coagulation depends on the thermal dose, which is determined by the cumulative effect of thermal energy deposited in the tissue, based on the activation energy required for protein denaturation in tissue [3, 4]. The cumulative equivalent minutes at 43 °C (CEM43) metric, which is the equivalent time duration (in minutes) calculated from temperature time history to cause tissue damage if the temperature were kept at 43 °C [5-7], has been used widely for assessment of thermal dose needed for tissue coagulation. A critical CEM43 of 240 min has been used extensively to predict tissue coagulation in kidney, liver, and muscle [8, 9], although CEM43 varies across species as well as tissue types [7]. The true threshold is often difficult to obtain due to the difficulty in determining the temporal temperature profile during lesion formation.
Thus in addition to methods that can directly determine the tissue status, methods capable of accurately measuring tissue temperature during HIFU application can be useful for monitoring and guiding HIFU ablation. Typically, the tissue temperature evolves as a function of time and spatial location as described by the bioheat equation [10-12]. The temperature measurements are used to estimate tissue coagulation, if a deterministic relationship has been established for such correlation.
Thermocouples can be used to measure temperature at discrete locations where they are inserted [13, 14], but they disrupt HIFU field and often are not feasible for in vivo use. Also viscous heating and thermal conduction by thermocouples themselves during HIFU application may introduce error in measurements [15-17]. Ultrasound imaging and magnetic resonance imaging (MRI) have been used to provide non-invasive temperature measurements for HIFU applications [18-21], although this approach is subject to artifacts [22, 23], and is limited by insufficient acquisition speed [17] and the high cost of MRI.
During HIFU application, lesion formation results in changes of the thermal, mechanical, and acoustical properties of the tissue. These changes, along with other events induced by HIFU heating, can alter the course of temperature evolution. In particular, degassing, boiling, vaporization, and cavitation in tissue [24, 25] often occur due to excessive heating, rapid temperature increase, and high level of acoustic pressures. In some cases, the combined effect of high acoustic pressure and rapid heating may generate unwanted macroscopic cavities or tissue fragmentation. These events, which result in destruction of local tissue integrity and changes of material properties, not only cause inefficient ablation of distal tissue segments [26] and altered lesion location, shape, and size from the original treatment plan, but also render the prediction of tissue status from temperature measurement difficult.
Infrared (IR) thermography, although limited to surface measurements, can obtain accurate measurements of temperature changes as a function of space and time directly without contact. The advantages also include easy implementation, high temporal (up to 100 Hz) and spatial resolution (down to 100 μm). IR imaging is useful for diagnosis and treatment monitoring, as demonstrated by medical applications such as oncology (breast cancer, skin diseases), skin burns, vascular disorders, surgery, tissue viability, and mass screening [27-29]. Laparoscopic IR systems have also been developed and used in assessing tissue necrosis during radiofrequency ablation [27] and tested on porcine models to provide additional anatomic and physical details from the differences in temperature between adjacent structures and organs [29, 30].
The goal of this study is to derive parameters from spatiotemporal changes of IR-measured temperature and determine whether they are correlated with relevant events during HIFU application (e.g., lesion formation, cavity formation), in order to provide useful markers for HIFU ablation monitoring.
We conducted experiments using ex vivo cardiac tissue, for the purpose of ultimately improving HIFU ablation of cardiac arrhythmia [31, 32]. We used IR imaging to measure tissue surface temperature during HIFU ablation. We first conducted experiments with the HIFU focus placed close to and slightly below the tissue surface where lesion formation and other events can be observed on the surface. In this way, changes in temperature-derived parameters related to lesion formation, overheating and bubble formation during HIFU application could be identified to permit corroboration of tissue changes with temperature measurements by IR imaging. This registered observation also allows computation of the thermal dose and determination of the critical CEM43 for myocardium tissue. We also extended our experimental studies to subsurface HIFU ablation to identify the characteristic temperature behaviors in this context.
2. Materials and methods
2.1 Tissue specimens and emissivity measurement
Ex vivo porcine myocardium tissue specimens obtained from a local abattoir were used in this study. For calibration of IR imaging, a flat surface of the tissue specimen was imaged with the IR camera perpendicular to the surface. Emissivity for myocardium was measured using the black tape method [33] where the Scotch Super 33+ Vinyl Electrical Tape (3M Company, St. Paul, MN, USA) with a known emissivity of 0.95 was used. The emissivity of coagulated myocardium was also measured after coagulation in a microwave oven, where different levels of dehydration were generated by applying various durations of microwave exposure.
2.2 Experimental setup and IR imaging
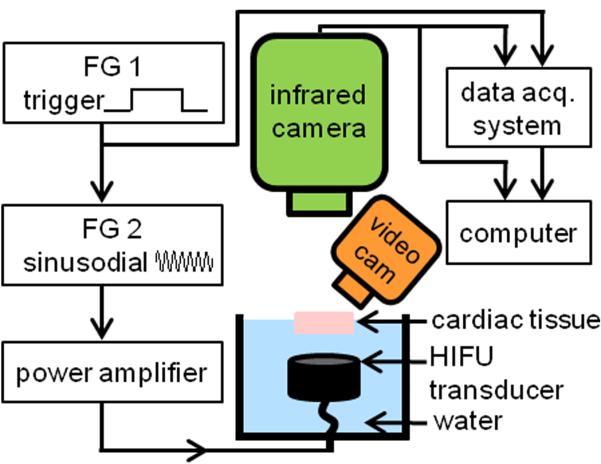
We used an IR camera (Silver 5600, FLIR Systems, Boston, MA, USA) sensitive to the mid-IR wavelength range (3 – 5 μm), with a temperature measurement accuracy of ± 1 °C and a resolution of 0.01 °C (Fig. 1). IR imaging was performed using two integration (exposure) times for measurements ranging from 15 °C to 120 °C, and conversion from IR radiance to temperature was performed using the manufacturer’s calibration and non-uniformity corrections.
Figure 1.
Schematic diagram of the experimental setup.
To generate HIFU exposures with adjustable amplitude and duration, the HIFU system used two function generators (33220A, Agilent, Santa Clara, CA, USA), a power amplifier (325LA, ENI, Rochester, NY, USA), and a focused transducer (3.98 MHz center frequency, F = 1, Blatek, Inc., State College, PA, USA). The HIFU transducer was calibrated using a hydrophone (HNR-0500, Onda, Sunnyvale, CA, USA) and its – 6 dB focal width and focal length were measured as 0.9 mm and 4.6 mm, respectively. Experiments were performed with the transducer submerged in water facing up towards a tissue specimen with its top surface above the water level to allow IR temperature measurements at a 50 Hz frame rate. (The tissue needed to be submerged on the underside to allow HIFU propagation in the specimen.) A plastic holder with an acoustically transparent bottom (Tegaderm, 3M, St. Paul, MN, USA) was used to hold the specimen and to prevent water from permeating into the tissue during HIFU exposures.
The IR camera was positioned perpendicular to the tissue surface, while an angled video camera at 24 Hz frame rate (D5000, Nikon, Melville, NY, USA) was used for bright-field imaging to monitor the tissue surface and identify lesion, cavity formation, and water extraction or tissue dehydration due to HIFU application. An indented ruler visible in both bright-field and IR images was placed on the edges of the tissue specimen for alignment. HIFU exposures and IR imaging acquisition were synchronized by a data acquisition system (OMB-DAQ-3000, Omega Engineering, Stamford, CT, USA). Bright-field imaging was synchronized by capturing a green LED light signal which turned on when IR imaging started. All image analysis and computations were performed using MATLAB (R2010a, Mathworks, Natick, MA, USA) offline.
2.3 HIFU ablation
Ablation was conducted using continuous wave HIFU exposures (1060 and 1500 W/cm2 focal intensity) with various exposure durations. To only induce temperature increase within the tissue without generating tissue coagulation as a control, non-ablative (125 and 283 W/cm2) continuous wave HIFU exposures were used. The HIFU parameters were chosen based on previous experiments to ensure the desired outcome (i.e., with or without generating lesion). IR imaging and bright-field imaging were performed before, during, and after HIFU application. Gross images of the tissue cross-section were taken after HIFU application and outcomes were classified into three categories: 1. non-ablative: no lesion was formed, 2. normal lesion: lesion formed without signs of cavitation or excessive heating, and 3. overheated lesion: lesion with cavity and/or discolorization within the lesion core that may be associated with changes beyond coagulation, such as dehydration and/or charring/carbonization. Only cases which could be clearly classified were included in this study.
2.4 Bright-field imaging
To determine the evolution of the lesion on the tissue surface, bright-field images were analyzed by first converting the true color RGB images into grayscale images using the rgb2gray.m function in MATLAB. After image conversion, a converted pre-HIFU reference frame was subtracted from all frames in the video sequence to generate “processed bright-field images.”
To ensure that tissue discoloration is an indication of coagulation, in our preliminary experiments, we stained tissue specimens with HIFU lesions using Masson’s Trichrome and the lesion boundaries matched well between the bright-field image and histology. However, histology stain was not used in this study to correlate with temperature-derived parameters due to its limitation to post-treatment assessment and distortion of tissue geometry during sectioning.
2.5 Time derivatives of temperature change
To characterize lesion and bubble formation, the first and second order time derivatives of temperature were calculated from the experimental data using
| (1) |
| (2) |
where T(x, y, t) is the surface temperature of the tissue at a given spatial location (x, y) and time t, and Δt is the duration between IR frames. A second order low-pass Butterworth filter with – 3dB cutoff frequency of 2.5 Hz was applied to the temporal temperature data prior to taking the first derivative, and another one with – 3dB cutoff frequency of 5 Hz was applied to the first time derivative before taking the second time derivative. Because the initial rate of temperature change during HIFU is directly proportional to HIFU intensity [15], the normalized derivative
| (3) |
was also computed to better allow for comparison between different exposure intensities and different spatial locations. Its corresponding normalized second derivative was computed from Eq. (3) by
| (4) |
2.6 Thermal damage
The temperature data were used to evaluate the thermal damage based on CEM43 using [34]
| (5) |
where is the average temperature during time Δt, tf is the final time, R = 0.25 below 43 °C, and R = 0.5 above 43 °C. To determine the critical CEM43 for myocardium, one sequence of IR images and bright-field images where lesion formation was observed at the surface during HIFU ablation (1060 W/cm2, 10 s, focused at 3 mm beneath surface) was analyzed. For the purposes of computing CEM43, the lesion must be formed only by thermal effects. As such, experimental data were selected to have no observable generation of bubbles or cavities on the tissue surface.
The processed bright-field images were first resized to have the same resolution as the IR images using bicubic interpolation (imresize.m function in MATLAB). Then the lesion boundaries were manually segmented on the processed bright-field images based on the gray-scale intensities at five different time points (t = 6, 7, 8, 9, 10 s) when the surface lesion grew large enough to have distinguishable lesion boundaries. The true lesion binary masks were formed with the areas inside the boundaries identified as lesions and outside as non-lesions. The CEM43 images at the corresponding time frames were computed using Eq. (5).
2.7 Receiver-operating characteristic (ROC) curves
To determine the thresholds for lesion and bubble formation based on the data derived from the temperature measurements (e.g., ) and the critical CEM43 for lesion formation, classifications based on ROC curves were used.
For any given CEM43 image, a time threshold τ can be applied to classify each pixel as lesion (CEM43 > τ) or non-lesion (CEM43 < τ) and thereby form a “predicted lesion” binary matrix at each τ. By comparing the “predicted lesion” binary matrix with the “true lesion” binary mask from the processed bright-field images, the number of pixels that were true positive (TP), false positive (FP), true negative (TN), and false negative (FN) were calculated at each τ. (A pixel was considered to be TP if it was predicted to be lesion and actually was lesion, FP if it was predicted to be lesion but was not lesion, TN if it was predicted not to be lesion and was not lesion, and FN if it was predicted not to be lesion and was lesion.) An overall empirical ROC curve can be drawn by plotting the true positive fraction (TPF = TPtotal / Ptotal) versus the false positive fraction (FPF = FPtotal / Ntotal) where the number of pixels were summed from the five frames, i.e., . The area under curve (AUC) was computed to evaluate the performance of the classifier τ. The accuracy at each threshold is calculated as (TPtotal + TNtotal) / (Ptotal + Ntotal), and the critical CEM43 was determined by finding the τ value which resulted in the maximum accuracy. The thresholds for lesion and bubble formation based on the data derived from temperature measurements were determined following a similar procedure. Due to the imbalanced number of datasets for ablative and non-ablative experiments, the non-ablative datasets were over-sampled using the synthetic minority over-sampling technique (SMOTE [35]) prior to performing ROC analysis in the determination of the lesion formation threshold.
3. Results and discussion
3.1 Emissivity of porcine myocardium tissue
The emissivity of porcine myocardium tissue specimens used in our study was measured to be 0.857 ± 0.006 (n = 3), in agreement with the reported epicardium emissivity (0.84 – 0.89) measured using a monochromator [36]. The emissivity of microwaved myocardium was measured to be 0.82 – 0.84, with the lower value corresponding to the more dehydrated specimens. These results are consistent with a previous study where dehydration in skin leads to decreased emissivity [37]. In this study, emissivity was set to 0.86 for IR imaging of all experiments.
3.2 Characteristic features of spatiotemporal evolution of temperature during HIFU ablation
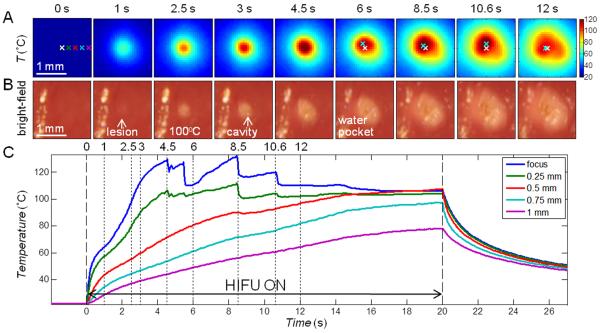
In these experiments (total n = 28), the HIFU focus was placed slightly below the tissue surface (0 – 3 mm) such that lesions induced by HIFU readily extended to the surface and were observable by bright-field imaging. Figure 2 shows a typical example of synchronized IR images (Fig. 2A) and bright-field images (Fig. 2B) of the tissue surface during an ablative HIFU exposure (1060 W/cm2, 20 s). Temperatures as a function of time at different locations are shown in Fig. 2C.
Figure 2.
IR measurement of temperature with ablative HIFU exposure (1060 W/cm2, 20 s) with focus placed at the surface. (A) IR images showing the surface temperature T (°C). The spatial peak temperature (cyan cross) is indicated in the images after t = 6 s, deviating from the original center focus (white cross). (B) Bright-field images of the tissue surface showing lesion and cavity formation. The bright stripe on the left of each image is due to the presence of some water. (C) Time evolution of T at the focus, 0.25, 0.5, 0.75, and 1 mm to the right of the focus (indicated on the first IR image in (A)).
Several characteristics were identified in the spatiotemporal evolution of the surface temperature during HIFU ablation. First, at and near the HIFU focal location, the temperatures increased rapidly initially (< 0.5 s after HIFU application at t = 0 s), while the rate of temperature increase (slope or ∂T/∂t) quickly dropped from the maximum value, as expected from prediction of linear bioheat equation with a constant heat source. However, at about t = 0.8 – 1 s, the temperature slope increased again, indicating faster rise of temperature. This sudden enhanced increase of temperature corresponded to lesion formation as identified by the bright-field images (Fig. 2B). Second, as heating continued, a small cavity formed near the focus (t = 3 s) and the temperature (Fig. 2C) correspondingly showed irregular variations. Third, a small pocket of water came out of the tissue and accumulated near the lesion/cavity area (t = 6 s), accompanied by a flattening of the temperature profile, deviating from the expected increase of temperature predicted by the bioheat equation [10-12]. The temperature stayed almost constant near 100 °C until the end of the HIFU (t = 20 s), after which the temperature decreased. Temperatures at locations farther away from the focus without lesion formation increased during HIFU exposure and decreased smoothly after HIFU exposure as expected.
3.2.1 Temperature changes during HIFU lesion formation
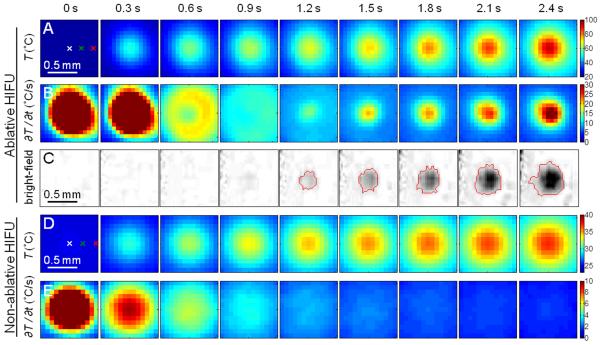
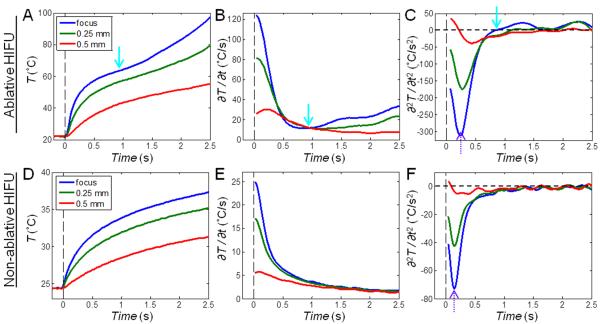
Correlation of lesion formation with the sudden increase in ∂T/∂t shown in Fig. 2 is further illustrated by a closer examination of the temperature change in the first 2.4 s (Figs. 3A – C and 4A – C). In particular, the time point of the reversal of ∂T/∂t (Fig. 4B, solid arrow) can be easily identified by the zero-crossing of ∂2T/∂t2 (Fig. 4C, solid arrow). In contrast, in a tissue exposed to HIFU intensity of 283 W/cm2 (5 s duration) without lesion generation (Figs. 3D – E and 4D – F), ∂T/∂t continued to decrease from its initial maximum in the course of temperature evolution (Fig. 4E) without zero-crossing (Fig. 4F). The zero-crossing of ∂2T/∂t2 was observed to correspond to surface lesion formation in most experiments. To compare between exposures of different intensities (in different experiments and at different spatial locations) based on these observations, we developed a criterion for lesion identification from the maximum value of the normalized second time derivative
| (6) |
where t* is the time of minimum (e.g., as indicated by the dotted arrows in Figs. 4C and 4F) at the start of HIFU exposure (0 – 1 s) at each (x, y) location within 0.3 mm (smaller than half the focal width) from the HIFU focus, and tend is the end time of HIFU exposure. To avoid errors from noise when taking derivatives from small temperature changes, only with ∂T/∂t > 2 °C/s were considered. Figure 5 shows the histogram of for all ablative (including HIFU outcomes of normal and overheated lesions, n = 22, 549 locations, where each location is represented by one pixel in the IR images) and non-ablative (n = 6, 222 locations) experiments. This classifier was determined to have an ROC AUC of 0.999 and with a threshold of = 0.05 s−1 max providing 99.1 % accuracy for lesion identification. The threshold is close to zero as expected, corresponding to an occurrence of zero-crossing when lesion forms.
Figure 3.
(A – C) Ablative HIFU exposure with focus placed at the surface: Zoomed-in images of the first 2.4 s in Fig. 2 showing (A) IR images of the surface temperature T (°C), (B) images of the rate of temperature change ∂T/∂t (°C/s), and (C) processed bright-field images of the tissue surface showing lesion formation. The red line indicates the lesion boundary. (D – E) Non-ablative HIFU exposure with focus placed at the surface: The first 2.4 s during a non-ablative HIFU exposure (283 W/cm2, 5 s duration) showing (D) IR images of T (°C) and (E) images of ∂T/∂t (°C/s).
Figure 4.
Time evolution of temperature T (°C), the rate of temperature change ∂T/∂t (°C/s), and the second derivative of temperature change ∂2T/∂t2 (°C/s2) corresponding to Fig. 3. The points at the focus and 0.25 mm and 0.5 mm to the right of the focus are shown (indicated on the first IR image in Figs. 3A and 3D). (A – C) Ablative HIFU exposure: Extra heating is indicated by the solid cyan arrows at 0.8 – 1 s when lesion starts to form. (D – F) Non-ablative HIFU exposure: ∂T/∂t continues to decrease without any reversal. The dotted purple arrows indicate the time point when ∂2T/∂t2 reaches its minimum value.
Figure 5.

Determination of the criterion for surface lesion formation: Histogram of the maximum normalized second derivative of temperature change for non-ablative and ablative HIFU ablations. The dashed line indicates a threshold of = 0.05 s−1 max which provided the highest accuracy for lesion identification.
The increase in ∂T/∂t, or the zero-crossing of , can be explained by the increase in acoustic attenuation coefficient in the coagulated tissue compared to normal tissue [38, 39], resulting in enhanced absorption of ultrasound energy and HIFU heating. The faster rate of temperature increase will be even more significant if the temperature was corrected to account for the changes in emissivity due to lesion formation (see Sec. 3.1). This increase in heating rate has been observed in previous studies using thermocouples [13]. As the attenuation and absorption are affected by temperature and thermal dose CEM43 [40], the increase in the heating rate is most significant when a high thermal dose is deposited in a short period of time.
3.2.2 Overheating: cavity formation and water extraction
During HIFU exposures (intensity > 1000 W/cm2), small cavities often appeared after lesion formation, as shown by the bright-field images (e.g., Fig. 2B, t = 3 s). As a result, the temperature near the focus became unsteady (Fig. 2C, t > 3 s), due to the loss of tissue integrity. Eventually, the spatial temperature distribution around the lesion became irregular and asymmetric (Fig. 2A, t > 6 s), accompanied by the appearance of water near the lesion/cavity area which seemed to be released/extracted from tissue bulk itself (the tissue specimen was water-sealed from below).
Cavity formation can be attributed to thermally-mediated gas pockets and cavitation associated with high acoustic pressures. In most cases with apparent cavity formation, an asymmetric temperature distribution was observed. To describe the asymmetric temperature distribution, we denoted the displacement of the spatial location of the peak temperature (e.g., Fig. 2A, cyan cross) from the initial center (e.g., Fig. 2A, white cross) at time t as d(t). Figure 6 shows a box plot of the maximum displacement dmax during the entire time course of the HIFU exposure, where dmax = max[d(t)] over t = 0 < t < tend. Using the unequal variance t-test (Behrens-Fisher problem), dmax for ablative HIFU exposures with overheating and/or cavity formation (mean ± S.D. = 0.315 ± 0.113 mm, n = 15) was significantly different from cases of non-ablative (0.075 ± 0.039 mm, n = 6, p < 0.001) and normal ablative HIFU exposures (without overheating) (0.143 ± 0.130 mm, n = 7, p = 0.01). No significant difference existed between the cases of non-ablative and normal ablative HIFU exposures (p = 0.22). The threshold to distinguish between overheated and normal lesions is 0.16 mm providing 90.9 % accuracy with an ROC AUC of 0.86. Therefore dmax can be used to identify excessive heating during HIFU applications.
Figure 6.
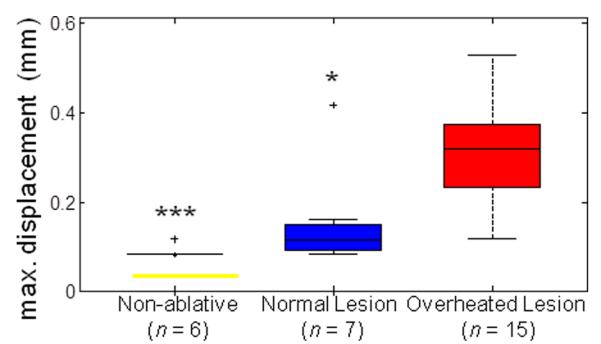
Determination of criterion for overheated surface lesions: Maximum displacement of spatial peak temperature location dmax from surface HIFU ablation experiments for non-ablative, normal lesion, and overheated lesion cases. The level of statistical significance compared with the overheated lesion cases is represented by triple asterisk (***) if p < 0.001and single asterisk (*) if p < 0.05. A threshold of 0.16 mm provides the highest accuracy to differentiate between normal and overheated surface lesions.
3.2.3 Thermal damage threshold
The lesion regions, determined from the bright-field images, were used to find the thermal damage threshold for the myocardium tissue specimens. The true lesion boundary was determined manually on each of the processed bright-field image, as shown by the example in Fig. 7A (t = 9 s in the HIFU experiment: 1060 W/cm2, 10 s, focused at 3 mm beneath surface). The corresponding CEM43 image (Fig. 7B) was thresholded by a set of times τ ranging from 0 to 5 × 10³ min. The overall ROC curve (Fig. 7C) was calculated from the average of TP, TN, FP, and FN from the five frames (t = 6, 7, 8, 9, 10 s, each with a different lesion size), and the AUC was 0.99. From the overall accuracy curve (Fig. 7D), the optimal critical CEM43 for lesion formation is 170 min. The predicted lesion boundary using CEM43 = 170 min is indicated on the processed bright-field image and the CEM43 image (Figs. 7A and 7B), within the normal range of soft tissues (40–240 min [7]).
Figure 7.
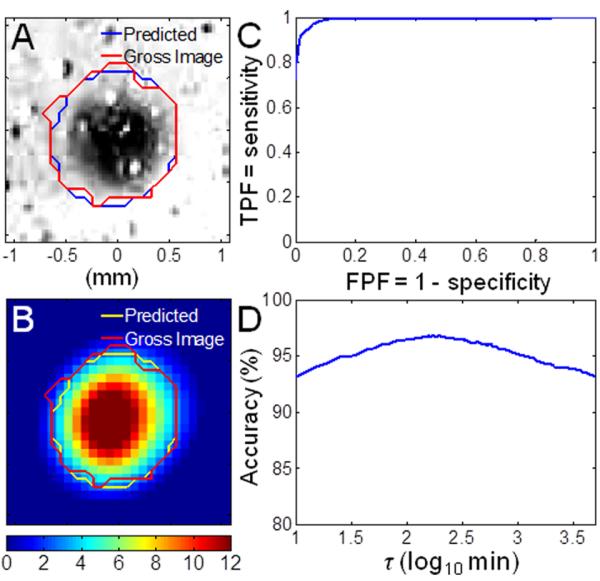
Determination of the critical CEM43: (A) Processed bright-field image (t = 9 s) with lesion at the center, mapped with true lesion boundary (red) and the predicted lesion boundary using critical CEM43 = 170 min (blue). (B) Corresponding parametric image of CEM43 on a logarithmic scale. (C) Overall empirical receiver-operating characte ristic (ROC) curve with area under the curve (AUC) = 0.99. (D) Overall accuracy as a function of threshold τ. The maximum accuracy occurs at 170 min.
The critical CEM43 for cardiac tissue has been estimated to be 128 min [6] but has not been experimentally determined. In this study, by deliberately forming the lesion on the tissue surface and evaluating the spatiotemporal temperature increase with confirmed lesion formation, the threshold of tissue coagulation was readily determined experimentally. Although ex vivo samples lack perfusion and tissue viability which could affect how the thermal damage can be assessed [7], the use of IR imaging to determine the thermal damage threshold can be easily carried out in both ex vivo and in vivo studies on various different tissue types and specimens.
3.3 Spatiotemporal temperature changes for subsurface HIFU ablation
In these experiments (total n = 39), the focus of the HIFU transducer was placed 3 – 8 mm beneath the tissue surface. The spatiotemporal temperature measured on the surface was correlated with HIFU events occurring at the subsurface volume based on characteristics observed from the experiments with lesion formation on the surface (Sec. 3.2).
3.3.1 Temperature changes during HIFU lesion formation
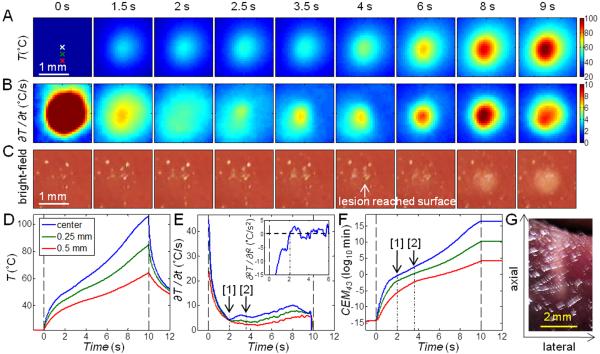
Figure 8 shows an example of the IR images (Fig. 8A), ∂T/∂t images (Fig. 8B), and the corresponding bright-field images of the surface (Fig. 8C) from an ablation experiment (1060 W/cm2, 10 s) with the focus placed at 3 mm beneath the surface. As in the case of surface ablation, the temperature at the surface above the HIFU focus increased rapidly after the start of HIFU application. The value of ∂T/∂t was the highest at the start of the HIFU exposure and then decreased. A reversal of ∂T/∂t which corresponded to the zero-crossing of ∂2T/∂t2 occurred at 2 s (Figs. 8B and 8E, Marker [1]), suggesting subsurface lesion formation based on the similar characteristics as those of surface lesion formation (e.g., Figs. 3B and 4B, starting t = 1 s) despite no visible surface lesion and CEM43 of 0.42 min at the center point (Fig. 8F, Marker [1]). ∂T/∂t continued to increase after 2 s, and lesion appeared on the surface at 3.5 to 4 s (Fig. 8C), when the CEM43 was from 111 to 802 min. The CEM43 reached 170 min at 3.62 s (Fig. 8F, Marker [2]). The gross image of the lesion cross-section is shown in Fig. 8G.
Figure 8.
Ablative HIFU exposures (1060 W/cm2, 10 s duration) with the focus placed at 3 mm beneath the surface. (A) IR images showing the surface temperature T (°C). (B) Images of the rate of temperature change ∂T/∂t (°C/s). (C) Bright-field images of the tissue surface showing lesion formation. (D) Time evolution of T at the center and 0.25 mm and 0.5 mm below the center (indicated on the first IR image in (A)). (E) Corresponding time evolution of ∂T/∂t : [1] ∂T/∂t starts to increase at 2 s, suggesting lesion formation in subsurface; [2] The CEM43 reaches 170 min at 3.62 s, predicting lesion formation at the surface between 3.5 and 4 s (see frame with arrow in (C)). The upper-right box shows the time evolution of ∂2T/∂t2 (°C/s2) at the center. The first zero-crossing occurred at 2 s. (F) Corresponding time evolution of CEM43: [1] 0.42 min at 2 s; [2] 170 min at 3.62 s. (G) Gross image of the lesion cross-section. Axial is the direction which ultrasound beams propagated, from the bottom surface of the tissue to the top surface.
Using the criterion developed for lesion identification defined in Eq. (6), we classified the sets of experiments with a subsurface HIFU ablation based on the surface temperature measurements. We only considered with ∂T/∂t > 0.5°C/s, which is a lower criterion compared to surface ablations (Sec. 3.2.1) due to the smaller temperature rise. Two sets of experiments were excluded due to skipped IR images, resulting in varying time intervals Δt which prohibited comparable time derivatives of temperature. Figure 9 shows the histogram of for all ablative (including HIFU outcomes of normal and overheated lesions, n = 30, 2102 locations) and non-ablative (n = 7, 363 locations) experiments. This classifier was determined to have an ROC AUC of 0.80 and with a threshold of = 0.03 s−1 providing 84.1 % accuracy for lesion identification. When the lesion is at a larger depth, its effect on the surface temperature is reduced due to the longer distance for heat conduction to reach the surface. This also explains the smaller AUC compared to the classification with a surface HIFU focus (0.999, see Sec. 3.2.1).
Figure 9.
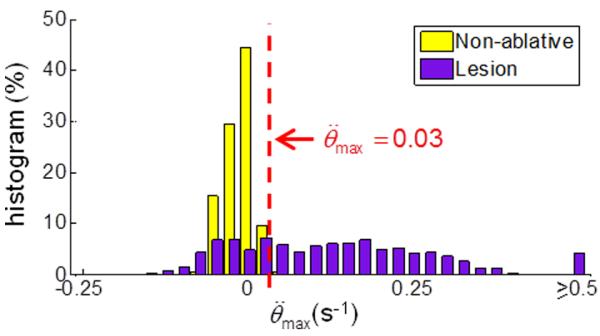
Determination of criterion for subsurface lesion formation: Histogram of the maximum normalized second derivative of temperature change for non-ablative and ablative HIFU ablations. The dashed line indicates a threshold of = 0.03 s−1 max which provided the highest accuracy for lesion identification.
3.3.2 Overheating: cavity formation and tissue dehydration
We examined whether similar characteristics of temperature irregularities, stagnation, and asymmetric distribution observed with the occurrence of cavity formation and tissue dehydration (or water extraction from tissue) in the cases of surface ablation (Sec. 3.2.2) can be regarded as indications of excessive heating in subsurface HIFU ablation.
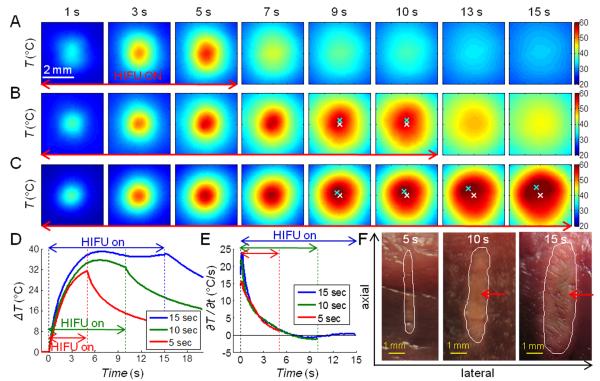
Figure 10 shows a comparison of three temperature profiles from experiments where HIFU exposures (1500 W/cm2) with durations of 5, 10, and 15 s were applied with the focus placed at 5 mm beneath the tissue surface. The temperature images (Fig. 10A) and time profiles (Figs. 10D and 10E, red line) for the shorter exposure ablation were smooth with no abrupt increase in ∂T/∂t. (The effect of lesion formation on the surface temperature was reduced in these cases due to the longer distance for heat to conduct to the surface.) The gross image of the corresponding tissue section (Fig. 10F) shows a small lesion with no sign of cavity formation.
Figure 10.
Three sets of IR images of temperature T (°C) during ablative HIFU exposures (1500 W/cm2) with the focus placed at 5 mm beneath the surface. Duration of HIFU exposures is (A) 5 s, (B) 10 s, and (C) 15 s. The spatial peak temperature (cyan cross) and the original center focus (white cross) are indicated in (B) and (C). (D) Time evolution of the temperature change ΔT(t) = T(t)–T(t = 0) and (E) the rate of temperature change ∂T/∂t (°C/s) at the center of the temperature distribution. (F) Gross images of the lesion cross-sections. The white contours indicate manually-drawn lesion boundaries, and the red arrows indicate regions with discoloration, suggesting overheating. Axial is the direction which ultrasound beams propagated, from the bottom surface of the tissue to the top surface.
With longer exposure times (10 and 15 s) (Figs. 10B and 10C), the temperature profiles (Fig. 10D, green and blue lines, respectively) showed the temperature reaching a plateau with a slight drop around 8 s while the HIFU exposure was still on. Afterwards, asymmetry in the spatial distribution of the temperature was observed, with the location of the peak temperature shifted away from its original central location with time. This is similar to the cases with surface ablation where cavity formation and tissue dehydration/water extraction were observed. Although no direct correlation of subsurface HIFU events with the temperature evolution was obtained, lesions observed in the gross images (Fig. 10F) exhibited discolorization in the lesion core which is often associated with overheating. The lesions also had a foam-like appearance, in contrast with the lesion generated by the 5 s HIFU exposure.
Figure 11 shows a box plot of dmax from surface temperature measurements in subsurface HIFU experiments. Using the unequal variance t-test, dmax for ablative HIFU exposures with overheating (0.842 ± 0.631 mm, n = 15) was significantly different from the non-ablative (0.206 ± 0.081 mm, n = 8, p < 0.01) and ablative HIFU exposures without overheating (0.204 ± 0.058 mm, n = 16, p < 0.01) cases. No significant difference occurred between the non-ablative and ablative HIFU exposures without overheating cases (p = 0.96). The threshold to distinguish between overheated and normal lesions is 0.29 mm providing 93.5 % accuracy with an ROC AUC of 0.99. dmax of the overheated lesions is larger in these experiments compared to the surface HIFU experiments (0.315 ± 0.113 mm, see Fig. 6), probably because the ultrasound propagation was blocked and/or disturbed in the subsurface volume, resulting in a more asymmetric surface temperature distribution.
Figure 11.
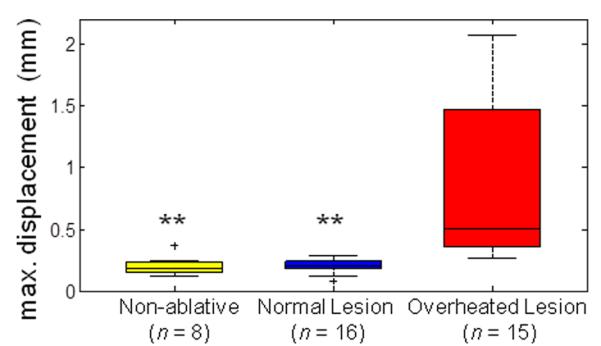
Determination of criterion for overheated subsurface lesions: Maximum displacement of spatial peak temperature location dmax from subsurface HIFU ablation experiments for non-ablative, normal lesion, and overheated lesion cases. The level of statistical significance compared with the overheated lesion cases is represented by double asterisk (**) if p < 0.01. A threshold of 0.29 mm provides the highest accuracy to differentiate between normal and overheated subsurface lesions.
3.4 Limitations and future study
As seen from the current results, the use of temperature information during HIFU application can be complex because the irreversible changes of the thermal and acoustical properties of the tissue due to coagulation and the occurrence of bubble and cavity formation can significantly alter the normal course of temperature progression, thereby making it challenging to predict tissue status. While specific characteristics of the temperature evolution of the tissue were shown to provide useful information for monitoring HIFU ablation in this study, additional work will be needed to provide further improved unambiguous determination of specific events relevant to HIFU therapy.
By correlating IR and bright-field images during HIFU treatments spatiotemporally, we were able to determine the critical CEM43 for cardiac tissue coagulation experimentally. However, care must be taken when applying the critical CEM43 for predicting tissue coagulation. Errors may arise when the value used was obtained from experiments with a much different temperature range or heating mechanism (e.g., heating rate, intensity). For example, the time required for tissue coagulation in thermal therapy (> 50 °C) may be less than the critical CEM43 obtained from experiments in the hyperthermia temperature range (40 – 45 °C) [41]. To make use of the simplicity of the thermal dose model and to ensure prediction accuracy, a chart of applicable critical CEM43 in various different ranges of temperature could be further established using the same experimental set-up and processing method used in this study with varying HIFU intensities and exposure durations.
In this study, cavity formation and bubble generation were determined by visual inspection from the bright-field images. To monitor gas bubble or cavity formation, especially in the subsurface HIFU experiments, passive cavitation detection techniques [25, 42, 43] could be incorporated in future studies. It would also be of interest to determine whether bubbles and cavities are formed from boiling or acoustic cavitation or the combination of both under current HIFU settings.
It is possible that phenomena such as lesion formation, water dehydration and overheating may result in different temperature behaviors in vivo and even for different tissue types. In order to provide temperature markers more relevant for in vivo HIFU applications, the current study needs to be extended to experiments that consider other effects such as blood perfusion on HIFU ablation. Studies are also needed to more systematically determine the robustness and accuracy of the temperature markers for HIFU induced tissue coagulation and other changes. One area that could improve the current study is to implement better methods for detecting tissue coagulation on the surface because fast deposition of energy from HIFU application results in CEM43 varying significantly temporally and spatially, making the selection of lesion boundaries critical. For example, methods that can detect lesion formation on the cellular or molecular level will provide more accurate detection.
4. Conclusions
Experimental results obtained from this ex vivo study demonstrate that parameters derived from the spatiotemporal changes of temperature measured at a tissue surface by real-time IR imaging exhibit characteristic changes corresponding to lesion formation, cavity generation, and water extraction/tissue dehydration during HIFU ablation. The temperature-derived parameters established in our study (, dmax) have the potential to provide useful information for real-time HIFU monitoring. The study also demonstrated a method of determining of the critical CEM43 for cardiac tissue via spatiotemporal correlation of IR and bright-field images during HIFU exposure that provides results consistent with existing literature values.
The methods described herein suggest that IR imaging may be useful for direct HIFU monitoring where a tissue surface is accessible with a shallow HIFU focal location such as in breast cancer and skin cancer treatments or during open-chest/open-abdomen surgeries. The temperature-derived markers described in this study also have the potential serve to complement HIFU monitoring within a tissue volume by other methods, such as ultrasound imaging and MRI, where direct determination of tissue status and other events is not possible in real time. As shown by the subsurface HIFU ablations, these temperature-derived parameters are applicable and useful even when direct temperature measurements of the region of interest are not feasible, provided the temperature information in the nearby regime is available.
Highlights.
IR imaging is applied to measure temperature changes during HIFU ablation.
Temperature-derived parameters corresponding to tissue changes are identified.
An increase in temporal rate of temperature indicates lesion formation.
Spatially asymmetric temperature changes indicate bubble and/or cavity formation.
The critical equivalent minutes at 43 °C for myocardium is determined to be 170 min.
Acknowledgments
This work was supported in part by the National Institutes of Health (R01 EB008999). The authors would also like to acknowledge J. Beeney for assistance on the implementation of the IR imaging and Madhu S. R. Gudur for discussion on calculation of CEM43 for thermal damage.
Footnotes
Publisher's Disclaimer: This is a PDF file of an unedited manuscript that has been accepted for publication. As a service to our customers we are providing this early version of the manuscript. The manuscript will undergo copyediting, typesetting, and review of the resulting proof before it is published in its final citable form. Please note that during the production process errors may be discovered which could affect the content, and all legal disclaimers that apply to the journal pertain.
REFERENCES
- [1].Kennedy JE. High-intensity focused ultrasound in the treatment of solid tumours. Nat Rev Cancer. 2005;5:321–327. doi: 10.1038/nrc1591. [DOI] [PubMed] [Google Scholar]
- [2].Crouzet S, Murat FJ, Pasticier G, Cassier P, Chapelon JY, Gelet A. High intensity focused ultrasound (HIFU) for prostate cancer: Current clinical status, outcomes and future perspectives. Int J Hyperthermia. 2010;26:796–803. doi: 10.3109/02656736.2010.498803. [DOI] [PubMed] [Google Scholar]
- [3].Dewhirst MW, Viglianti BL, Lora-Michiels M, Hanson M, Hoopes PJ. Basic principles of thermal dosimetry and thermal thresholds for tissue damage from hyperthermia. Int J Hyperthermia. 2003;19:267–294. doi: 10.1080/0265673031000119006. [DOI] [PubMed] [Google Scholar]
- [4].Dewey WC, Hopwood LE, Sapareto SA, Gerweck LE. Cellular responses to combinations of hyperthermia and radiation. Radiology. 1977;123:463–474. doi: 10.1148/123.2.463. [DOI] [PubMed] [Google Scholar]
- [5].Sapareto SA, Dewey WC. Thermal dose determination in cancer-therapy. Int J Radiat Oncol. 1984;10:787–800. doi: 10.1016/0360-3016(84)90379-1. [DOI] [PubMed] [Google Scholar]
- [6].Haemmerich D, Webster JG, Mahvi DM. Thermal dose versus isotherm as lesion boundary estimator for cardiac and hepatic radio-frequency ablation. Proc 25th Annual Intl Conf IEEE Engin Med Biol Soc, IEEE.2003. pp. 134–137. [Google Scholar]
- [7].Yarmolenko PS, Moon EJ, Landon C, Manzoor A, Ho chman DW, Viglianti BL, Dewhirst MW. Thresholds for thermal damage to normal tissues: An update. Int J Hyperthermia. 2011;27:320–343. doi: 10.3109/02656736.2010.534527. [DOI] [PMC free article] [PubMed] [Google Scholar]
- [8].Chung AH, Jolesz FA, Hynynen K. Thermal dosimetry of a focused ultrasound beam in vivo by magnetic resonance imaging. Med Phys. 1999;26:2017–2026. doi: 10.1118/1.598707. [DOI] [PubMed] [Google Scholar]
- [9].Daum DR, Smith NB, King R, Hynynen K. In vivo demonstration of noninvasive thermal surgery of the liver and kidney using an ultrasonic phased array. Ultrasound Med Biol. 1999;25:1087–1098. doi: 10.1016/s0301-5629(99)00053-8. [DOI] [PubMed] [Google Scholar]
- [10].Pennes HH. Analysis of tissue and arterial blood temperatures in the resting human forearm. J Appl Physiol. 1948;1:93–122. doi: 10.1152/jappl.1948.1.2.93. [DOI] [PubMed] [Google Scholar]
- [11].Nyborg WL. Solutions of the bio-heat transfer equation. Phys Med Biol. 1988;33:785–792. doi: 10.1088/0031-9155/33/7/002. [DOI] [PubMed] [Google Scholar]
- [12].Curra FP, Mourad PD, Khokhlova VA, Cleveland RO, Crum LA. Numerical simulations of heating patterns and tissue temperature response due to high-intensity focused ultrasound. IEEE Trans Ultrason Ferroelectr Freq Control. 2000;47:1077–1089. doi: 10.1109/58.852092. [DOI] [PubMed] [Google Scholar]
- [13].Clarke RL, ter Haar GR. Temperature rise recorded during lesion formation by high-intensity focused ultrasound. Ultrasound Med Biol. 1997;23:299–306. doi: 10.1016/s0301-5629(96)00198-6. [DOI] [PubMed] [Google Scholar]
- [14].Maruvada S, Liu YB, Herman BA, Harris GR. Temperature measurements in tissue-mimicking material during HIFU Exposure. In: Ebbini ES, editor. 8th Intl Symp on Therapeutic Ultrasound, AIP.2009. pp. 286–290. [Google Scholar]
- [15].Fry WJ, Fry RB. Determination of absolute sound levels and acoustic absorption coefficients by thermocouple probes - theory. J Acoust Soc Am. 1954;26:294–310. [Google Scholar]
- [16].Morris H, Rivens I, Shaw A, ter Haar G. Investigation of the viscous heating artefact arising from the use of thermocouples in a focused ultrasound field. Phys Med Biol. 2008;53:4759–4776. doi: 10.1088/0031-9155/53/17/020. [DOI] [PubMed] [Google Scholar]
- [17].Rivens I, Shaw A, Civale J, Morris H. Treatment monitoring and thermometry for therapeutic focused ultrasound. Int J Hyperthermia. 2007;23:121–139. doi: 10.1080/02656730701207842. [DOI] [PubMed] [Google Scholar]
- [18].Fennessy FM, Tempany CM. A review of magnetic resonance imaging-guided focused ultrasound surgery of uterine fibroids. Top Magn Reson Imag. 2006;17:173–179. doi: 10.1097/RMR.0b013e3180337e1f. [DOI] [PubMed] [Google Scholar]
- [19].Anand A, Savery D, Hall C. Three-dimensional spatial and temporal temperature imaging in gel phantoms using backscattered ultrasound. IEEE Trans Ultrason Ferroelectr Freq Control. 2007;54:23–31. doi: 10.1109/tuffc.2007.208. [DOI] [PubMed] [Google Scholar]
- [20].Arthur RM, Basu D, Guo YZ, Trobaugh JW, Moros EG. 3-D in vitro estimation of temperature using the change in backscattered ultrasonic energy. IEEE Trans Ultrason Ferroelectr Freq Control. 2010;57:1724–1733. doi: 10.1109/TUFFC.2010.1611. [DOI] [PubMed] [Google Scholar]
- [21].Hynynen K. MRI-guided focused ultrasound treatments. Ultrasonics. 2010;50:221–229. doi: 10.1016/j.ultras.2009.08.015. [DOI] [PubMed] [Google Scholar]
- [22].Miller NR, Bamber JC, Meaney PM. Fundamental limitations of noninvasive temperature imaging by means of ultrasound echo strain estimation. Ultrasound Med Biol. 2002;28:1319–1333. doi: 10.1016/s0301-5629(02)00608-7. [DOI] [PubMed] [Google Scholar]
- [23].Rieke V, Pauly K. Butts. MR thermometry. J Magn Reson Im. 2008;27:376–390. doi: 10.1002/jmri.21265. [DOI] [PMC free article] [PubMed] [Google Scholar]
- [24].Khokhlova VA, Bailey MR, Reed JA, Cunitz BW, Kaczkowski PJ, Crum LA. Effects of nonlinear propagation, cavitation, and boiling in lesion formation by high intensity focused ultrasound in a gel phantom. J Acoust Soc Am. 2006;119:1834–1848. doi: 10.1121/1.2161440. [DOI] [PubMed] [Google Scholar]
- [25].Coussios CC, Farny CH, ter Haar G, Roy RA. Role of acoustic cavitation in the delivery and monitoring of cancer treatment by high-intensity focused ultrasound (HIFU) Int J Hyperthermia. 2007;23:105–120. doi: 10.1080/02656730701194131. [DOI] [PubMed] [Google Scholar]
- [26].Lizzi FL. High-precision thermotherapy for small lesions. Eur Urol. 1993;23(Suppl. 1):23–28. doi: 10.1159/000474675. [DOI] [PubMed] [Google Scholar]
- [27].Ogan K, Roberts WW, Wilhelm DM, Bonnell L, Leiner D, Lindberg G, Kavoussi LR, Cadeddu JA. Infrared thermography and thermocouple mapping of radiofrequency renal ablation to assess treatment adequacy and ablation margins. Urology. 2003;62:146–151. doi: 10.1016/s0090-4295(03)00040-2. [DOI] [PubMed] [Google Scholar]
- [28].Diakides NA, Diakides M, Lupo JC, Paul JL, Balcerak R. Advances in medical infrared imaging. In: Diakides NA, Bronzino JD, editors. Medical Infrared Imaging. CRC Press; New York, NY: 2008. pp. 1-1–1-13. [Google Scholar]
- [29].Song C, Tang B, Campbell PA, Cuschieri A. Thermal spread and heat absorbance differences between open and laparoscopic surgeries during energized dissections by electrosurgical instruments. Surg Endosc. 2009;23:2480–2487. doi: 10.1007/s00464-009-0421-7. [DOI] [PubMed] [Google Scholar]
- [30].Cadeddu JA, Jackman SV, Schulam PG. Laparoscopic infrared imaging. J Endourol. 2001;15:111–116. doi: 10.1089/08927790150501033. [DOI] [PubMed] [Google Scholar]
- [31].Groh MA, Binns OA, Burton HG, Champsaur GL, Ely SW, Johnson AM. Epicardial ultrasonic ablation of atrial fibrillation during concomitant cardiac surgery is a valid option in patients with ischemic heart disease. Circulation. 2008;118:S78–S82. doi: 10.1161/CIRCULATIONAHA.107.750927. [DOI] [PubMed] [Google Scholar]
- [32].Mitnovetski S, Almeida AA, Goldstein J, Pick AW, Smith JA. Epicardial high-intensity focused ultrasound cardiac ablation for surgical treatment of atrial fibrillation. Heart Lung Circ. 2009;18:28–31. doi: 10.1016/j.hlc.2008.08.003. [DOI] [PubMed] [Google Scholar]
- [33].Madding RP. Emissivity measurement using infrared imaging radiometric cameras. In: Driggers RG, editor. Encyclopedia of optical engineering. CRC Press; New York, NY: 2003. pp. 475–483. [Google Scholar]
- [34].Sapareto SA, Dewey WC. Thermal dose determination in cancer-therapy. Int J Radiat Oncol Biol Phys. 1984;10:787–800. doi: 10.1016/0360-3016(84)90379-1. [DOI] [PubMed] [Google Scholar]
- [35].Chawla NV, Bowyer KW, Hall LO, Kegelmeyer WP. SMOTE: Synthetic minority over-sampling technique. J Artif Intell Res. 2002;16:321–357. [Google Scholar]
- [36].Steketee J. Spectral emissivity of skin and pericardium. Phys Med Biol. 1973;18:686–694. doi: 10.1088/0031-9155/18/5/307. [DOI] [PubMed] [Google Scholar]
- [37].Mitchell D, Wyndham CH, Hodgson T. Emissivity and transmittance of excised human skin in its thermal emission wave band. J Appl Physiol. 1967;23:390–394. doi: 10.1152/jappl.1967.23.3.390. [DOI] [PubMed] [Google Scholar]
- [38].Bush NL, Rivens I, ter Haar GR, Bamber JC. Acoustic properties of lesions generated with an ultrasound therapy system. Ultrasound Med Biol. 1993;19:789–801. doi: 10.1016/0301-5629(93)90095-6. [DOI] [PubMed] [Google Scholar]
- [39].Zderic V, Keshavarzi A, Andrew MA, Vaezy S, Martin RW. Attenuation of porcine tissues in vivo after high-intensity ultrasound treatment. Ultrasound Med Biol. 2004;30:61–66. doi: 10.1016/j.ultrasmedbio.2003.09.003. [DOI] [PubMed] [Google Scholar]
- [40].Damianou CA, Sanghvi NT, Fry FJ, Maass-Moreno R. Dependence of ultrasonic attenuation and absorption in dog soft tissues on temperature and thermal dose. J Acoust Soc Am. 1997;102:628–634. doi: 10.1121/1.419737. [DOI] [PubMed] [Google Scholar]
- [41].He XM, Bhowmick S, Bischof JC. Thermal therapy in urologic systems: a comparison of Arrhenius and thermal isoeffective dose models in predicting hyperthermic injury. J Biomech Eng. 2009;131:074507. doi: 10.1115/1.3128671. [DOI] [PubMed] [Google Scholar]
- [42].Rabkin BA, Zderic V, Crum LA, Vaezy S. Biological and physical mechanisms of HIFU-induced hyperecho in ultrasound images. Ultrasound Med Biol. 2006;32:1721–1729. doi: 10.1016/j.ultrasmedbio.2006.04.010. [DOI] [PubMed] [Google Scholar]
- [43].Mast TD, Salgaonkar VA, Karunakaran C, Besse JA, Datta S, Holland CK. Acoustic emissions during 3.1 MHz ultrasound bulk ablation in vitro. Ultrasound Med Biol. 2008;34:1434–1448. doi: 10.1016/j.ultrasmedbio.2008.02.007. [DOI] [PMC free article] [PubMed] [Google Scholar]


