

Abstract
Cancer patients commonly suffer from cachexia, a syndrome in which tumors induce metabolic changes in the host that lead to massive loss in skeletal muscle mass. Using a preclinical mouse model of cancer cachexia, we tested the hypothesis that tumor inoculation causes a reduction in ATP synthesis and genome-wide aberrant expression in skeletal muscle. Mice implanted with Lewis lung carcinomas were examined by in vivo 31P nuclear magnetic resonance (NMR). We examined ATP synthesis rate and the expression of genes that play key-regulatory roles in skeletal muscle metabolism. Our in vivo NMR results showed reduced ATP synthesis rate in tumor-bearing (TB) mice relative to control (C) mice, and were cross-validated with whole genome transcriptome data showing atypical expression levels of skeletal muscle regulatory genes such as peroxisomal proliferator activator receptor γ coactivator 1 ß (PGC-1ß), a major regulator of mitochondrial biogenesis and, mitochondrial uncoupling protein 3 (UCP3). Aberrant pattern of gene expression was also associated with genes involved in inflammation and immune response, protein and lipid catabolism, mitochondrial biogenesis and uncoupling, and inadequate oxidative stress defenses, and these effects led to cachexia. Our findings suggest that reduced ATP synthesis is linked to mitochondrial dysfunction, ultimately leading to skeletal muscle wasting and thus advance our understanding of skeletal muscle dysfunction suffered by cancer patients. This study represents a new line of research that can support the development of novel therapeutics in the molecular medicine of skeletal muscle wasting. Such therapeutics would have wide-spread applications not only for cancer patients, but also for many individuals suffering from other chronic or endstage diseases that exhibit muscle wasting, a condition for which only marginally effective treatments are currently available.
Keywords: skeletal muscle, cancer cachexia, mitochondria, mitochondrial, PGC-1ß, UCP3, FoXO3α, microarrays, genomics
Introduction
Cachexia is a complex metabolic syndrome that can result from adaptation to an underlying illness; it is characterized by loss of muscle mass with or without loss of fat mass (1). Selective targeting of skeletal muscle is a principal feature of cachexia pathophysiology (2), and a major cause of fatigue (3) in patients. Indeed, the condition can rob patients of 30% or more of their body weight (4). As many as half of untreated cancer patients present with cachexia (5,6), which is most commonly associated with cancers of the gastrointestinal tract and lung (6); furthermore, in these cancer types muscle wasting occurs at a faster rate than any other known situation in human subjects (6–8).
Cancer-induced muscle wasting is typically associated with the development of significantly increased resting energy expenditure (REE) in skeletal muscle and fat (6,7,9)-REE increases as a result of decreased caloric intake and/or increased energy expenditure. Uncoupling proteins (UCPs) have been implicated in the control of energy metabolism (6,7). They transport protons into the mitochondrial matrix (10) and nonesterified fatty acid (FA) anions out of the matrix in a process called FA cycling (11). Both of these processes reduce the proton gradient across the inner mitochondrial membrane, thereby dissipating energy as heat (7) and thus increasing energy expenditure. Strong evidence indicates that cancer-induced cachexia induces UCP2 and UCP3 at the transcriptional and translational levels in skeletal muscle via tumor necrosis factor alpha (TNFα) (12–14). This induction correlates directly with antioxidative activity as production of reactive oxygen species (ROS) increases as a result of mitochondrial dysfunction (15,16). Inflammatory cytokines are considered to be mediators of and targets for cancer cachexia (17–20); they have been reported to lead to post-transcriptional activation of the peroxisomal proliferator activator receptor γ coactivator 1 α (PGC-1α) via the p38 mitogen-activated protein kinase (MAPK) pathway, resulting in increased respiration in muscle cells (21). In addition, it has been shown that decreased PGC-1α expression leads to profoundly reduced mitochondrial content and activity (22), while increased PGC-1α protein levels have been observed in a rat cancer cachexia model (23). It is now well established that mitochondrial function can be altered via coordinated changes in gene expression (24).
In vivo NMR spectroscopy enables quantification of intracellular physiological variables in an organism without removal or destruction of the tissue to be examined, as other techniques usually require to make such an assessment (25,26). Indeed, in vivo NMR represents a significant advance in the study of mitochondrial function by providing measurements under physiological conditions in intact skeletal muscle, thus eliminating in vitro artifacts. With this methodology, researchers can measure the net skeletal muscle rate of oxidative ATP synthesis catalyzed by mitochondrial ATPase (27,28), which by definition is proportional to oxygen consumption by the P/O ratio (the ratio of the net rate of ATP synthesis by oxidative phosphorylation to the rate of oxygen consumption) (29,30). Furthermore, in vivo NMR in combination with whole-genome analysis of gene expression, which provides a snapshot of the transcriptome in a specific tissue in response to experimentally defined physiological conditions, provides a systematic approach for studying complex systems, such as cancer-induced muscle wasting, by integrating mitochondrial function data with information about mitochondrial regulation at the cellular and organism levels.
Although mitochondrial dysfunction, has been shown in experimental models of burn injury to lead to skeletal muscle wasting (31–39), it has never been studied in the context of cancer-induced cachexia. The aim of the present study was to study mitochondrial function in cancer cachexia holistically in a suitable preclinical model. To this end, highly cachectic, fast-growing Lewis lung carcinomas, characterized by poorly differentiated cells with a short doubling time (40), were implanted in mice. This model is advantageous owing to the fast rate of muscle wasting produced and lack of anorexia which produce a clear cachectic state characterized by profound muscle wasting (40–44), mimicking closely the pathophysiology of untreated human cancer cachexia. We hypothesize that mitochondrial dysfunction triggered by an altered gene expression program is a major cause of skeletal muscle wasting in cancer. To test this hypothesis, in vivo NMR combined with whole-genome expression analysis was applied to intact Lewis lung carcinoma-inoculated mice and the data were compared to data from control (C) tumor-free mice to assess alterations in the tumor bearing (TB) animals’ bioenergetic status and to characterize concomitant gene expression patterns in cancer-induced cachectic versus control skeletal muscle tissue.
Materials and methods
Animals
C57Bl/6 mice (20–25 g) (Charles River Laboratories, Boston, USA) were used as a representative inbred stock and reliable population for the microarray studies. The animals were maintained at 22±2°C with a regular light-dark cycle (lights on from 8:00 am to 8:00 pm) and had free access to standard rodent chow and water. The diet consisted of 54% carbohydrate, 17% protein, and 5% fat (the residue was non-digestible material). Food intake was measured daily; food provided daily was pre-weighted. After 24 h, remaining food was weighted and subtracted from the initially provided food. The net value of food consumed every 24 h gave the rate of food intake. Only male mice were used in order to avoid the variability that can result from the female estrous cycle. All animal experiments were approved by the Subcommittee on Research Animal Care of Massachusetts General Hospital, Boston.
Tumor implantation
Mice were inoculated with tumor according to an established protocol (43) under short-time isoflurane anesthesia (3% in O2) as described previously (43). Animals were randomized into tumor-free control (C) and tumor-bearing (TB). TB-mice received an intramuscular (right hind leg) inoculum of 4×10⁵ Lewis lung carcinoma cells obtained from exponential tumors.
Evaluation of cancer induced cachexia
Fourteen days after tumor transplantation, the mice were weighed and anesthetized with an intraperitoneal (i.p.) ketamine (87 mg/kg) and xylazine (13 mg/kg) injection. Tumor, tissues of interest and blood were collected. All mice were then administered a lethal dose of pentobarbital (200 mg/kg, i.p.). The cancer-induced cachexia was evaluated by measuring: i) the total body and carcass (muscle + bone + skin) weights, ii) the weight of gastrocnemius, tibialis, soleus and extensor digitorum longus (EDL) muscle weights in the contralateral (left leg) to the tumor bearing leg as described previously (43), and iii) the TNFα, interleukin-6 (IL-6) and interleukin-10 (IL-10) levels in blood using Q-Plex™ Mouse Cytokine/Chemokine kit by Quansys Biosciences laboratory (USA). (www.quansysbio.com/products-services/sample-testing).
31P NMR spectroscopy
Data acquisition
The theoretical basis of saturation transfer experiments has been described previously by Forsen and Hoffman (45). Animals were subjected to in vivo 31P NMR spectroscopy 14 days after tumor inoculation. The mice were transiently anesthetized with a mixture of isoflurane (3.0%) and O2 (2.0 l/min) delivered through a nose cone and placed in a customized restraining tube. Each animal’s left hind limb was placed into a solenoid coil (four turns; length, 2 cm; diameter, 1 cm) tuned to 31P frequency (162.1 MHz). During the MR imaging, mice were kept anesthetized with a mixture of isoflurane (1.5%) and O2 (0.6 l/min). The rectal body temperature was maintained at 37±1°C using heated water blankets. All in vivo 31P NMR experiments were performed in a horizontal bore magnet (proton frequency at 400 MHz, 21 cm diameter, Magnex Scientific, Varian, Palo Alto, CA, USA) using a Bruker Advance console. Field homogeneity was adjusted using the 1H signal of tissue water. A 90° pulse was optimized for detection of phosphorus spectra (repetition time 2 sec, 400 averages, 4,000 data points). Saturation 90° selective pulse trains (duration, 36.534 ms; bandwidth, 75 Hz) followed by crushing gradients were used to saturate the γATP peak. The same saturation pulse train was also applied downfield of the inorganic phosphate (Pi) resonance, symmetrically to the γATP resonance. T1 relaxation times of Pi and phosphocreatine (PCr) were measured using an inversion recovery pulse sequence in the presence of γATP saturation. An adiabatic pulse (400 scans; sweep width, 10 kHz; 4,000 data points) was used to invert Pi and PCr, with an inversion time between 152 and 7,651 ms.
Data analysis
31P NMR spectra were analyzed using the MestRe-C NMR software package (Mestrelab Research, NMR solutions, website: www.mestrec.com). Free induction decays were zero-filled to 8,000 points and apodized with exponential multiplication (30 Hz) before Fourier transformation. The spectra were then manually phased and corrected for baseline broad features. The Levenberg-Marquardt algorithm was used to least-square-fit a model of mixed Gaussian/Lorentzian functions to the data. Similarly, the T1obs relaxation time for Pi and PCr was calculated by fitting the function y = A1[1-A2e-(t/T1obs)] to the inversion recovery data, where y is the z magnetization and t is the inversion time.
Total RNA extraction
The mice were anesthetized by intraperitoneal injection of ketamine (87 mg/kg) and xylazine (13 mg/kg) and the gastrocnemius muscle contralateral (left) to the TB-hind leg was rapidly excised, weighed, and frozen in liquid nitrogen. Left gastrocnemius muscles excised from C animals served as controls specimens. All mice were then administered a lethal dose of pentobarbital (200 mg/kg, i.p.). Frozen biopsies from TB and C mice (n=4) were immersed in 1 ml TRIzol® (Gibco-BRL, Invitrogen, Carlsbad, CA) for RNA extraction. Each muscle specimen was homogenized for 60 sec with a Brinkman Polytron 3000 homogenizer before extraction of total RNA. Chloroform (200 μl) was added to each homogenized muscle specimen and mixed by inverting the tube repeatedly for 15 sec. After centrifugation at 12,000 × g for 15 min, the upper aqueous phase was transferred by pipet to a new tube and precipitated by adding 500 μl of isopropanol. Further centrifugation at 12,000 × g for 10 min condensed the RNA pellet, which was then washed with 500 μl of 70% ethanol and centrifuged at 7,500 × g for 5 min prior to air drying. The pellet was resuspended in 100 μl DEPC-H20. An RNeasy kit (Qiagen, Germantown, MD) was used to purify the RNA according to the manufacturer’s protocol. Purified RNA was quantified by UV absorbance at 260 and 280 nm and stored at −70°C for DNA microarray analysis.
Gene array hybridization and analysis
Biotinylated cRNA was generated from 10 μg aliquots of total RNA, and hybridized onto MOE430A oligonucleotide arrays, which were subsequently stained, washed, and scanned. All procedures followed standard Affymetrix protocols (Santa Clara, CA). The hybridized array image data files were converted to cell intensity (CEL) files in Microarray Suite 5.0 (MAS 5.0, Affymetrix). The data were scaled to a target intensity of 500, and Genespring GX (version 7.3) software (Agilent Technologies) was employed for statistical analysis of differential transcript expression using the Welch t-test for multiple testing correction and Benjamini and Hochberg False Discovery Rate (cut-off of 5% false discovery rate and 2-fold change). Probe sets representing the same transcript were ordered on their corresponding unigenes, and the 3′-most probe set was selected from combined lists of all probe sets. A collection of genes with experimental evidence was compiled using MOE430A chip annotation (Affymetrix, retrieved December, 2009) compiled from GeneSpring GX (version 7.3). Statistically significant sets of functionally related genes were selected using overrepresentation statistics calculated as hypergeometric probabilities using all genes selected in each experiment that had Gene Ontology annotation for biological process (46) using Gene Ontology Analysis (GeneSpring GX, version 7.3). Functions’ P-values were estimated using 0.05 as the cut-off point (GeneSpring GX, version 7.3). Functional categories that did not have at least two genes were removed.
Results
Lewis lung carcinoma inoculation decreased body, carcass and skeletal muscle weights
Food intake during the experiment did not differ between TB and C groups. Fourteen days after tumor implantation mean total body weight (BW) of TB mice had decreased by 17% relative to pre-inoculation (Table I). BW loss was associated with a 27.3% decrease in carcass weight (muscle + bone + skin) (Table I). Muscle mass was decreased 14 days after tumor implantation in all tissues studied, with the most substantial decreases being observed in the gastrognemnius (50.2% decrease), tibialis (49.0% decrease), and EDL (32.8% decrease) muscles (Table I).
Table I.
Cancer cachexia effects in C57BL/6 mice.
| Control | Tumor-bearing (day 14) | P-value | |
|---|---|---|---|
| Initial BW (g) | 17±0.2 (n=5) | 17±0.5 (n=8) | NS |
| Final BW (g) | 22±1 (n=5) | 14±1 (n=8) | <0.001 |
| % weight change | 29% | −17% | |
| Carcass (mg/100 g initial BW) | 77±2 (n=5) | 56±1 (n=8) | <0.001 |
| Muscles weights (mg/100 g initial BW) | |||
| Gastrocnemius | 764±16 (n=6) | 381±6 (n=8), −50.2% | <0.001 |
| Tibialis | 241±8 (n=6) | 123±7 (n=8), −49% | <0.001 |
| Soleus | 42±1 (n=6) | 37±3 (n=8), −11.9% | NS |
| EDL | 58±4 (n=6) | 39±3 (n=8), −32.8% | <0.01 |
Results are expressed as mean ± SEM for the number of animals indicated in parentheses. EDL, extensor digitorum longus; NS, not significant; carcass weight, muscle + bone + skin.
Lewis lung carcinoma inoculation increased blood levels of cytokines
TB mice had elevated levels of the procachectic cytokines TNFα (77.2% greater than C; P=0.02) and IL-6 (8,120.1% greater than C; P=0.01) 14 days after tumor implantation. Moreover, IL-10, which was undetectable in C mice, was also present at high levels (26.12±4.06 pg/ml) in TB mice.
Cancer cachexia reduced ATP synthesis rate
31P NMR spectra acquired from TB and C mice, before and after saturation of the γATP resonance, with the mean results and their percent change (Δ) presented in Table II. The unidirectional synthesis rate of the Pi ➝ γ-ATP reaction in TB mice was 47% lower than that observed in C mice (P=0.029). This synthesis rate involves measurements from NMR and from a biochemical assay (ATP concentration measurement), and both were significantly decreased in the cancer mice. The NMR-measured fractional change ΔM/M0 was decreased by 37% in TB mice relative to the C group (percent change in ΔM/M0, Table I). ATP concentration (14 days post-inoculation) was lower in TB than in C mice by approximately 27% (Table II), a difference that approached significance (P=0.054) in the unidirectional (one-tailed) t-test. ATP synthesis rate was significantly reduced in TB mice (47% lower than in C) in the unidirectional (one-tailed) t-test (P=0.029). The fractional change, ΔM/M0, and the observed spin lattice relaxation time, T1obs, were used to calculate the κf rate constant using the equation (1/T1obs) × (ΔM/M0). The ATP synthesis flux was then obtained as the product of κf and Pi concentration. Accordingly, the unidirectional synthesis rate of the PCr ➝ γ-ATP reaction was also 27% lower in TB mice compared to C, a difference that was significant according to a unidirectional (one-tailed) t-test (P=0.036).
Table II.
Results of in vivo 31P-NMR saturation transfer experiments performed on the hindlimb skeletal muscle of mice.
| Control (n=10) | Tumor-bearing (n=6) | Δ(%) | P-value | |
|---|---|---|---|---|
| ATP synthesis flux (reaction Pi➝γATP) | ||||
| ΔM/M0 | 0.484±0.036 | 0.304±0.051 | −37.2 | 0.011 |
| T1obs (s) | 1.59±0.14 | 1.50±0.14 | −5.6 | NS |
| κf (s−1) | 0.304±0.026 | 0.203±0.038 | −33.2 | 0.038 |
| ATP (mmol/g) | 1.19±0.14 | 0.87±0.19 | −26.9 | 0.054 |
| Pi (mmol/g) | 0.280±0.062 | 0.222±0.079 | −20.7 | NS |
| ATP synthesis rate (mmol/g/s) | 0.085±0.013 | 0.045±0.013 | −47.1 | 0.029 |
| ATP synthesis flux (reaction PCr➝ATP) | ||||
| ΔM/M0 | 0.24±0.02 | 0.26±0.02 | +8.3 | (NS) |
| T1obs (s) | 1.59±0.20 | 1.50±0.27 | −5.7 | (NS) |
| κf (s−1) | 0.15±0.02 | 0.17±0.03 | +13.3 | (NS) |
| ATP (μmol/g) | 1.19±0.28 | 0.87±0.19 | −26.9 | (NS) |
| PCr (μmol/g) | 4.13±0.99 | 2.65±0.59 | −35.8 | 0.015 |
| ATP synthesis rate (μmol/g/s) | 0.62±0.17 | 0.45±0.13 | −27.4 | 0.036 |
Values are means ± SEM; ΔM/M0 is the fractional change in Pi or PCr magnetization as a result of saturation transfer; T1obs is the observed spin lattice relaxation time of Pi or PCr during γATP saturation in seconds; κf is the rate constant for the reactions Pi ➝ ATP and PCr ➝ ATP, calculated as (1/T1obs) × (ΔM/M0). ATP synthesis is calculated as [Pi] or [PCr] × κf. A bioluminescence assay kit was used to assess ATP concentration. Δ (%), percent change. NS, not significant. Unpaired Student’s t-test was used for the comparisons.
Cancer-induced cachexia affected several cellular functions in skeletal muscle
Analysis of transcriptome studies identified 611 genes as differentially expressed in skeletal gastrocnemius muscle in TB versus C mice (P<0.05). Comparison of these 611 differentially expressed genes to annotations in the Gene Ontology Consortium enabled functionally related sets of genes to be identified and subsequent analysis of these data indicated that several cellular functions were altered by cancer-induced cachexia (Fig. 2). The four most prominently affected functions were related to inflammation and immune response, and these effects predominantly involved significant increases in transcription. The four next most prominently affected functional categories involved genes whose products mediate protein metabolism, especially protein degradation. Specifically, as shown in Fig. 2, transcription of molecules involved in protein catabolism, protein depolymerization, and proteasome-related was altered, mostly in the direction of upregulation. The ubiquitin-proteasome pathway in particular was implicated as a major process of protein degradation in cancer-induced cachexia. Transcription of protein maturation related genes was universally down-regulated in TB mice.
Figure 2.

Distribution of genes differentially expressed in gastrocnemius muscle of TB animals relative to C animals among 14 functional categories showed in the X axis, as identified by using Gene Ontology and KEGG metabolic pathways at P≤0.05. Gray bars indicate the number of upregulated genes while black bars correspond to down-regulated genes in the gastrocnemious muscle of TB animals versus C animals (left Y axis). The negative log10 of P-values represented by diamonds are indicated in the right Y axis.
The transcriptome analysis revealed cancer-induced alterations in cellular lipid metabolism and lipid catabolism in TB mice relative to C mice (Fig. 2), indicating that cancer-induced cachexia also begets abnormal lipid metabolism. Among the down-regulated genes (data not shown) was stearoyl-Coenzyme A desaturase 1, which encodes for the first (step-limited) enzyme in unsaturated fatty acid biosynthesis. Phospholipase A2 and phospholipase C, which have roles in several lipid metabolic and signaling pathways, were also differentially affected. Genes related to skeletal muscle anti-oxidative capacity were affected by cancer cachexia as well (last two functional catagories listed in Fig. 2). While increased transcription of genes related to oxidative stress response was evident, superoxide metabolism genes were down-regulated.
Differential expression of key mitochondrial genes in cancer cachexia
Fig. 3 shows the effect of cancer-induced cachexia on the expression levels of selective genes related to mitochondrial function. Specifically, uncoupling protein 3 (UCP3), and forkhead box O 3α (FoXO3α) expression levels were significantly upregulated (P=0.03 and P=0.04 respectively). As well as pyruvate dehydrogenase kinase 4 (PDK4), an inhibitor of pyruvate dehydrogenase complex (P=0.01). Meanwhile, peroxisome proliferator activated receptor-γ coactivator-1ß (PGC-1ß) was significantly down-regulated (P=0.04).
Figure 3.
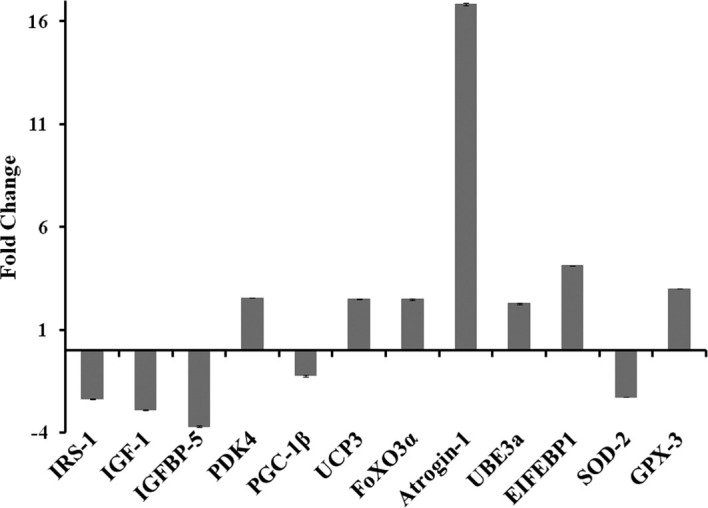
Summary of the magnitudes of change in mRNA expression of mitochondrial function-related and other cancer-induced cachexia-related genes 14 days after cancer transplantation. IRS-1, insulin receptor substrate 1; IGF-1, insulin-like growth factor 1; IGFBP-5, insulin-like growth factor binding protein 5; PDK4, pyruvate dehydrogenase kinase 4; PGC-1ß, peroxisome proliferator-activated receptor-γ coactivator-1ß; UCP3, uncoupling protein 3; FoxO3α, Forkhead box O3α; ATROGIN-1, F-box only protein 32; UBE3a, ubiquitin protein ligase E3A; SOD-2, superoxide dismutase 2; GPX, glutathione peroxidase 3.
It is noteworthy that the present experiments revealed also altered expression of genes known to be involved in the IGF-1/AKT pathway which regulates: a) signaling pathways responsible for FoXOs post-translational activation; and b) protein synthesis and degradation (Fig. 3). More specifically, our data suggest that cachexic animals had decreased AKT activation since insulin-like growth factor 1 (IGF-1), insulin receptor substrate 1 (IRS-1), and IGF binding protein 5 (IGFBP5) were all significantly down- regulated in TB mice (P=0.03, P=0.02 and P=0.048 versus C, respectively). Furthermore, the ubiquitin-proteasome pathway related genes atrogin-1 and ubiquitin-conjugating enzyme E3 (UBE3α) were upregulated in skeletal muscle of TB mice (P=0.0495 and P=0.0252 versus C, respectively); and the eukaryotic translation initiation factor 4E binding protein 1 (EIF4Ebp1) was also significantly up-regulated in TB mice (P=0.0077 versus C). Genes related to antioxidative capacity were also differentially expressed in TB mice: superoxide dismutase 2 (SOD2) was down-regulated (P=0.0111 versus C) while glutathione peroxidase 3 (GPX) was upregulated (P=0.0068 versus C).
Discussion
In this study, we used a combined approach of in vivo NMR together with whole-genome expression analysis to investigate mitochondrial function and elucidate a possible regulatory molecular mechanism that may mediate skeletal muscle wasting in an experimental preclinical murine model of cancer cachexia. Our animal model was validated by our findings of weight decreases in total body, carcass and several skeletal muscles 14 days after tumor implantation, observations that corroborated prior findings (43). Further validation of our model was provided by our genomic data which showed aberrant gene expression in several cellular functions related to cancer cachexia; the affected genes were most prominently found to be involved in immune-inflammatory response, protein degradation, lipid metabolism and antioxidative defense mechanisms. Increased immune-inflammatory response is consistent with the pathophysiology of cancer-induced cachexia described in previous reports (47,48), while protein degradation is considered to be a major cause of cachexia (2). Furthermore, the cancer-induced alterations in cellular lipid metabolism reported in this study are also indicative of abnormal lipid metabolism in cachexia, in agreement with previous observations (49).
The present in vivo NMR spectroscopy studies, which allowed measurements of physiological biomarkers (25,26), showed a significantly reduced ATP synthesis rate in cachexic mice suggestive of bioenergetic mitochondrial dysfunction. Our accompanying whole-genome expression experiments complemented our NMR findings, revealing aberrant expression of genes involved in mitochondrial biogenesis (PGC-1ß), and uncoupling (UCP3) in a clinically relevant cancer cachexia model. Interestingly, our NMR findings of mitochondrial dysfunction in the skeletal muscle of animals exhibiting cancer cachexia are similar to prior observations in murine models of burn trauma (31,37). In vivo 31P-NMR saturation-transfer can non-invasively measure fast enzyme reaction exchange rates (50) and, in particular, the net rate of oxidative ATP synthesis catalyzed by mitochondrial ATPase in skeletal muscle, which is proportional to the oxygen consumption rate according to the P:O ratio (the ratio of the net rate of ATP synthesis by oxidative phosphorylation to the rate of oxygen consumption) (29,30). It has been proposed that NMR-measured unidirectional ATP synthesis flux primarily reflects flux through F1F0-ATP synthase, with negligible influence of the coupled glyceraldehyde-3-phosphate dehydrogenase and phosphoglycerate kinase reactions for ATP production (28,51). Because these enzymes occur at near equilibrium, unidirectional production of ATP can be high. Furthermore, since cancer cachexia upregulates expression of PDK4 (in mouse Fig. 3; in rat, see (23), a well established inhibitor of the pyruvate dehydrogenase complex which is involved in controlling the use of glucose-linked substrates as sources of oxidative energy via glycolysis (52), we can assume that the contribution of glycolytic reactions to unidirectional ATP synthesis flux is negligible.
In agreement with our NMR findings, our genomic experiments revealed reduced expression of PGC-1ß, a mitochondrial biogenesis transcription factor. Reduced expression of PGC-1ß has also been observed in murine burn-induced skeletal muscle wasting models (31,37), while increased PGC-1α protein levels have been previously reported in a rat cancer cachexia model (23), strongly supporting the view that PGC-1s play a key role in cancer-induced muscle wasting. Specifically, it has been suggested that PGC-1α protects skeletal muscle from atrophy (53) while PGC-1ß expression has been associated with an increase in ATP-consuming reactions (24). Moreover, reduced PGC-1 expression levels have also been correlated to profoundly reduced mitochondrial content and activity (22); these effects may be due to the action of UCPs (34) given that down-regulation of PGC-1s is accompanied by increased UCP expression in murine models of both cancer- (12,14,23) and burn-related cachexia (31,54). Increased levels of UCPs dissipate the proton gradient and lower the mitochondrial membrane potential, a process known to increase energy expenditure by dissipating energy as heat (7). The presently observed upregulation of UCP3 in cachexic animals corroborates previous findings (12–14,16).
Indeed, this increase in UCP3 gene expression suggests that there was mitochondrial uncoupling in TB mice since increased levels of UCPs lower the mitochondrial membrane potential (55) and thus greatly reduce the amount of ROS in mitochondria (56,57), a major site of ROS production in the cell (58,59), especially in conditions characterized by high TNFα levels (60), such as cancer. To this end, it has been proposed that upregulation of UCPs in cancer may be directly related to the antioxidative capacity of skeletal muscle, thus involving UCPs in a counter-regulatory mechanism to lower ROS production; this process is thought to involve the muscle anabolic cytokine IL-15 (16). UCP expression has been reported to be upregulated by procachectic cytokines (TNFα and IL-6) via p38MAPK-dependent post-translational activation of PGC-1s (21). Our data agree with this notion, as we observed increased levels of the procachectic cytokines TNFα and IL-6 in TB mice relative to C mice (by 77.2% and 8,120.1%, respectively).
A principal finding of the present study was that down-regulation of PGC-1ß in TB mice was accompanied by a down-regulation of SOD2 as well as an upregulation of GPX. Interestingly, it has previously been shown that PGC-1s increase gene expression of SOD2, GPX and enzymes responsible for glutathione biosynthesis (24), and both SOD2 and GPX have been implicated in cancer-induced oxidative stress response (61–63). Our results indicate that muscle defense against oxidative stress in cancer is mediated largely by GPX, corroborating the observed increase in genes ascribed to the ‘response to oxidative stress’ function. Meanwhile, genes ascribed superoxide metabolism function were expressed at significantly lower levels in TB mice than in C mice, indicating that the defense mechanisms functioning in cancer cachexia are not adequate to handle the oxidative stress with which they are faced.
Another principal finding of our study is that decreased expression of PGC-1ß was accompanied by increased FoXO3α gene expression levels. This finding is consistent with a previous report suggesting that PGC-1s inhibit FoXOs-dependent transcription (53) and provides support for the view that PGC-1ß may play a central regulatory role in cancer-induced cachexia given that FoXOs are involved in multiple signaling pathways and play critical roles in numerous physiological and pathological processes including cancer (64). Specifically, FoXOs are under regulatory influences at multiple levels, including phosphorylation, acetylation/deacetylation, ubiquitination, and protein-protein interactions (64). Furthermore, in the present study, we also report aberrant expression of genes known to be involved in the IGF-1/AKT pathway, which has been reported to play a role in FoxOs post-translational activation (65,66). Involvement of the IGF-1/AKT pathway in cancer cachexia (67) was confirmed by our data showing decreased AKT activation as evidenced by down-regulated IGF-1, IRS-1 and IGFBP5. Consequently, decreased AKT activation could permit dephosphorylation of FoXOs and thus translocation of FoXOs to the nucleus, where they are activated and promote upregulation of genes related to protein degradation (53,66,68,69), namely atrogin-1 and ubiquitin-conjugating enzyme E3, thus leading to cachexia. Genes related to the structure of the proteolytic system (proteasome function in Fig. 2) were also upregulated in TB mice, further implicating activation of the ubiquitin-proteasome pathway as a major generator of protein degradation in cancer-induced cachexia, as previously reported in cancer patients exhibiting weight loss (70).
The hypothesis that IGF-1/AKT attenuation contributes to cancer cachexia is supported by the presently observed elevated levels of the EIF4Ebp1 in TB mice, as EIF4Ebp1 levels have been found to correlate with cancer development and cachexia (71,72) due to inhibition of protein synthesis (73) via binding to eukaryotic initiation factor 4E (eIF4E) (74). Specifically, hypophosphorylated EIF4Ebp1 binds to eIF4E and prevents recruitment of the 40S ribosomal subunit to mRNA, thus inhibiting cap-dependent translation. Binding of EIF4Ebp1 to eIF4E is regulated by mTOR-mediated phosphorylation (73). Upon its activation, mTOR phosphorylates EIF4Ebp1; hyperphosphorylated EIF4Ebp1 is released from eIF4E, leading to an increase in cap-dependent translation (75). Given that mTOR activation is regulated mainly by the IGF-1/AKT pathway, attenuation of AKT activity as observed in our experimental cancer cachexia model should further facilitate protein translation inhibition due to mTOR inactivation and the consequent hypophosphorylation of EIF4Ebp1.
In light of the afore-mentioned lines of evidence and previous reports, we propose here that PGC-1 acts as a key regulator of cancer-induced bioenergetic dysfunction and muscle wasting in experimental cancer cachexia, as illustrated in Fig. 4. Specifically, we propose that cancer induction of cachexia involves: i) decreased expression of PGC-1ß, which normally inhibits FoXOs; and ii) attenuated AKT activity, which both enable activation of FoXO3α and upregulate the expression of atrogenes, which then facilitate muscle degradation. In addition, attenuation of AKT can inhibit protein synthesis since the IGF-1/AKT pathway normally contributes to protein synthesis via mTOR. Meanwhile, decreased expression of PGC-1ß appears to: a) upregulate UCP3, leading to uncoupling and reduced ATP synthesis rate; and b) alter immuno-inflammatory gene expression in skeletal muscle [in cachexia Fig. 1; in experimental burn injury (31,33,34,36)]. This supposition is in agreement with other studies suggesting that upregulation of mRNA and protein expression of UCP2 and UCP3 (12–14) correlates directly with antioxidative capacity (15,16) in response to elevated TNFα-induced ROS production in cancer (60).
Figure 4.

Putative PGC-1-mediated mechanism of cancer-induced skeletal muscle wasting. In this model, significant down-regulation of PGC-1ß expression causes dysregulation of mitochondria, resulting in reduced ATP synthesis and increased ROS production, most likely due to PGC-1-dependent upregulation of UCPs. Meanwhile, reduced PGC-1ß gene expression levels result in a failure to down-regulate expression of FoXO3α, which normally suppresses atrogen expression and proteolysis. Insulin-stimulated IGF-1/AKT pathway signaling is also significantly attenuated. Thus, AKT does not phosphorylate FoXOs and, consequently, favors further upregulation of atrogenes, thus leading to skeletal muscle wasting. Moreover, reduced IGF-1/AKT signaling further facilitates protein translation inhibition due to mTOR inactivation which also results in cachexia. Meanwhile, PGC-1ß may affect IGF-1 and IRS-1 expression thereby producing insulin resistance in skeletal muscle. IRS-1, insulin receptor substrate 1; IGF-1, insulin-like growth factor 1; PGC-1s, peroxisome proliferator-activated receptor-γ coactivators-1; UCPs, uncoupling proteins; FoXOs, forkhead box O proteins; ROS, reactive oxygen species; TNFα, tumor necrosis factor α; NF-κB, nuclear factor-κB.
Figure 1.

NMR spectra of in vivo 31P NMR saturation-transfer performed on the hind limb skeletal muscle of awake mice. Representative summed 31P-NMR spectra acquired from C and TB mice before (A) and after (B) saturation of the γ-ATP resonance. The arrow on γ-ATP indicates the position of saturation (sat) by rf irradiation (−2.4 ppm). ppm, chemical shift in parts per million.
In conclusion, because hallmarks of skeletal muscle wasting can be detected by in vivo NMR, our findings are clinically relevant in as much as they can be used as molecular medicine biomarkers that can be translated to humans. Moreover, if PGC-1s mediate key regulatory functions in cancer-induced cachexia as suggested by the present findings, they could serve as funnels where several oncogenic/cachectic signals (cytokines, ROS, IGF-1) converge to drive the downstream physiological response (mitochondrial dysfunction, antioxidative and immune-inflammatory response, protein synthesis and degradation) of skeletal muscle to malignancy. Because PGC-1ß is a highly inducible factor in most tissues that responds to common calcium and cAMP signaling pathways, it is conceivable that drugs could be developed with the ability to induce PGC-1ß and thereby directly alleviate mitochondrial dysfunction. Such a novel therapeutic approach could revolutionize cancer cachexia treatment.
Acknowledgments
This study was supported in part by a National Institutes of Health (NIH) Center Grant (P50GM021700) to Ronald G. Tompkins (A. Aria Tzika, Director of the NMR core), and Shriner’s Hospital for Children research grants (no. 8893) to A. Aria Tzika, and (no. 8892) to Laurence G. Rahme. Cibely C. Fontes de Oliveira was supported by a Programme Alban scholarship (E05D059293BR). We also thank Ann Power Smith Ph.D. of Write Science Right for editorial assistance.
References
- 1.Evans WJ, Morley JE, Argiles J, et al. Cachexia: a new definition. Clin Nutr. 2008;27:793–799. doi: 10.1016/j.clnu.2008.06.013. [DOI] [PubMed] [Google Scholar]
- 2.Lecker SH, Jagoe RT, Gilbert A, et al. Multiple types of skeletal muscle atrophy involve a common program of changes in gene expression. FASEB J. 2004;18:39–51. doi: 10.1096/fj.03-0610com. [DOI] [PubMed] [Google Scholar]
- 3.Evans WJ, Lambert CP. Physiological basis of fatigue. Am J Phys Med Rehabil. 2007;(Suppl. 1):S29–S46. doi: 10.1097/phm.0b013e31802ba53c. [DOI] [PubMed] [Google Scholar]
- 4.Windsor JA, Hill GL. Risk factors for postoperative pneumonia. The importance of protein depletion. Ann Surg. 1988;208:209–214. doi: 10.1097/00000658-198808000-00013. [DOI] [PMC free article] [PubMed] [Google Scholar]
- 5.Dewys WD, Begg C, Lavin PT, et al. Prognostic effect of weight loss prior to chemotherapy in cancer patients. Eastern Cooperative Oncology. Group Am J Med. 1980;69:491–497. doi: 10.1016/s0149-2918(05)80001-3. [DOI] [PubMed] [Google Scholar]
- 6.Tisdale MJ. Cachexia in cancer patients. Nat Rev Cancer. 2002;2:862–871. doi: 10.1038/nrc927. [DOI] [PubMed] [Google Scholar]
- 7.Giordano A, Calvani M, Petillo O, Carteni M, Melone MR, Peluso G. Skeletal muscle metabolism in physiology and in cancer disease. J Cell Biochem. 2003;90:170–186. doi: 10.1002/jcb.10601. [DOI] [PubMed] [Google Scholar]
- 8.Muscaritoli M, Bossola M, Aversa Z, Bellantone R, Rossi Fanelli F. Prevention and treatment of cancer cachexia: new insights into an old problem. Eur J Cancer. 2006;42:31–41. doi: 10.1016/j.ejca.2005.07.026. [DOI] [PubMed] [Google Scholar]
- 9.Tisdale MJ. Mechanisms of cancer cachexia. Physiol Rev. 2009;89:381–410. doi: 10.1152/physrev.00016.2008. [DOI] [PubMed] [Google Scholar]
- 10.Klingenberg M, Echtay KS, Bienengraeber M, Winkler E, Huang SG. Structure-function relationship in UCP1. Int J Obes Relat Metab Disord. 1999;23(Suppl. 6):S24–S29. doi: 10.1038/sj.ijo.0800939. [DOI] [PubMed] [Google Scholar]
- 11.Jezek P, Engstova H, Zackova M, et al. Fatty acid cycling mechanism and mitochondrial uncoupling proteins. Biochim Biophys Acta. 1998;1365:319–327. doi: 10.1016/s0005-2728(98)00084-x. [DOI] [PubMed] [Google Scholar]
- 12.Busquets S, Sanchis D, Alvarez B, Ricquier D, Lopez-Soriano FJ, Argiles JM. In the rat, tumor necrosis factor alpha administration results in an increase in both UCP2 and UCP3 mRNAs in skeletal muscle: a possible mechanism for cytokine-induced thermogenesis? FEBS Lett. 1998;440:348–350. doi: 10.1016/s0014-5793(98)01485-9. [DOI] [PubMed] [Google Scholar]
- 13.Collins P, Bing C, McCulloch P, Williams G. Muscle UCP-3 mRNA levels are elevated in weight loss associated with gastrointestinal adenocarcinoma in humans. Br J Cancer. 2002;86:372–375. doi: 10.1038/sj.bjc.6600074. [DOI] [PMC free article] [PubMed] [Google Scholar]
- 14.Sanchis D, Busquets S, Alvarez B, Ricquier D, Lopez-Soriano FJ, Argiles JM. Skeletal muscle UCP2 and UCP3 gene expression in a rat cancer cachexia model. FEBS Lett. 1998;436:415–418. doi: 10.1016/s0014-5793(98)01178-8. [DOI] [PubMed] [Google Scholar]
- 15.Busquets S, Garcia-Martinez C, Olivan M, Barreiro E, Lopez-Soriano FJ, Argiles JM. Overexpression of UCP3 in both murine and human myotubes is linked with the activation of proteolytic systems: a role in muscle wasting? Biochim Biophys Acta. 2006;1760:253–258. doi: 10.1016/j.bbagen.2005.10.011. [DOI] [PubMed] [Google Scholar]
- 16.Busquets S, Almendro V, Barreiro E, Figueras M, Argiles JM, Lopez-Soriano FJ. Activation of UCPs gene expression in skeletal muscle can be independent on both circulating fatty acids and food intake. Involvement of ROS in a model of mouse cancer cachexia. FEBS Lett. 2005;579:717–722. doi: 10.1016/j.febslet.2004.12.050. [DOI] [PubMed] [Google Scholar]
- 17.Argiles JM, Busquets S, Lopez-Soriano FJ. The pivotal role of cytokines in muscle wasting during cancer. Int J Biochem Cell Biol. 2005;37:2036–2046. doi: 10.1016/j.biocel.2005.03.014. [DOI] [PubMed] [Google Scholar]
- 18.Argiles JM, Busquets S, Lopez-Soriano FJ. Cytokines as mediators and targets for cancer cachexia. Cancer Treat Res. 2006;130:199–217. doi: 10.1007/0-387-26283-0_9. [DOI] [PubMed] [Google Scholar]
- 19.Acharyya S, Guttridge DC. Cancer cachexia signaling pathways continue to emerge yet much still points to the proteasome. Clin Cancer Res. 2007;13:1356–1361. doi: 10.1158/1078-0432.CCR-06-2307. [DOI] [PubMed] [Google Scholar]
- 20.Argiles JM, Busquets S, Toledo M, Lopez-Soriano FJ. The role of cytokines in cancer cachexia. Curr Opin Support Palliat Care. 2009;3:263–268. doi: 10.1097/SPC.0b013e3283311d09. [DOI] [PubMed] [Google Scholar]
- 21.Puigserver P, Rhee J, Lin J, et al. Cytokine stimulation of energy expenditure through p38 MAP kinase activation of PPARgamma coactivator-1. Mol Cell. 2001;8:971–982. doi: 10.1016/s1097-2765(01)00390-2. [DOI] [PubMed] [Google Scholar]
- 22.Uldry M, Yang W, St-Pierre J. Complementary action of the PGC-1 coactivators in mitochondrial biogenesis and brown fat differentiation. Cell Metab. 2006;3:333–341. doi: 10.1016/j.cmet.2006.04.002. [DOI] [PubMed] [Google Scholar]
- 23.Fuster G, Busquets S, Ametller E, et al. Are peroxisome proliferator-activated receptors involved in skeletal muscle wasting during experimental cancer cachexia? Role of beta2-adrenergic agonists. Cancer Res. 2007;67:6512–6519. doi: 10.1158/0008-5472.CAN-07-0231. [DOI] [PubMed] [Google Scholar]
- 24.St-Pierre J, Lin J, Krauss S, et al. Bioenergetic analysis of peroxisome proliferator-activated receptor gamma coactivators 1alpha and 1beta (PGC-1alpha and PGC-1beta) in muscle cells. J Biol Chem. 2003;278:26597–26603. doi: 10.1074/jbc.M301850200. [DOI] [PubMed] [Google Scholar]
- 25.Ackerman JJ, Grove TH, Wong GG, Gadian DG, Radda GK. Mapping of metabolites in whole animals by 31P NMR using surface coils. Nature. 1980;283:167–170. doi: 10.1038/283167a0. [DOI] [PubMed] [Google Scholar]
- 26.Hitzig BM, Prichard JW, Kantor HL, Ellington WR, Ingwall JS, Burt CT, et al. NMR spectroscopy as an investigative technique in physiology. FASEB J. 1987;1:22–31. doi: 10.1096/fasebj.1.1.3301494. [DOI] [PubMed] [Google Scholar]
- 27.Brindle KM, Blackledge MJ, Challiss RA, Radda GK. 31P NMR magnetization-transfer measurements of ATP turnover during steady-state isometric muscle contraction in the rat hind limb in vivo. Biochemistry. 1989;28:4887–4893. doi: 10.1021/bi00437a054. [DOI] [PubMed] [Google Scholar]
- 28.Jucker BM, Dufour S, Ren J, et al. Assessment of mitochondrial energy coupling in vivo by 13C/31P NMR. Proc Natl Acad Sci USA. 2000;97:6880–6884. doi: 10.1073/pnas.120131997. [DOI] [PMC free article] [PubMed] [Google Scholar]
- 29.Kingsley-Hickman PB, Sako EY, Ugurbil K, From AH, Foker JE. 31P NMR measurement of mitochondrial uncoupling in isolated rat hearts. J Biol Chem. 1990;265:1545–1550. [PubMed] [Google Scholar]
- 30.Sako EY, Kingsley-Hickman PB, From AH, Foker JE, Ugurbil K. ATP synthesis kinetics and mitochondrial function in the postischemic myocardium as studied by 31P NMR. J Biol Chem. 1988;263:10600–10607. [PubMed] [Google Scholar]
- 31.Padfield KE, Astrakas LG, Zhang Q, et al. Burn injury causes mitochondrial dysfunction in skeletal muscle. Proc Natl Acad Sci USA. 2005;102:5368–5373. doi: 10.1073/pnas.0501211102. [DOI] [PMC free article] [PubMed] [Google Scholar]
- 32.Astrakas LG, Goljer I, Yasuhara S, et al. Proton NMR spectroscopy shows lipids accumulate in skeletal muscle in response to burn trauma-induced apoptosis. FASEB J. 2005;19:1431–1440. doi: 10.1096/fj.04-2005com. [DOI] [PubMed] [Google Scholar]
- 33.Padfield KE, Zhang Q, Gopalan S, et al. Local and distant burn injury alter immuno-inflammatory gene expression in skeletal muscle. J Trauma. 2006;61:280–292. doi: 10.1097/01.ta.0000230567.56797.6c. [DOI] [PubMed] [Google Scholar]
- 34.Zhang Q, Cao H, Astrakas LG, et al. Uncoupling protein 3 expression and intramyocellular lipid accumulation by NMR following local burn trauma. Int J Mol Med. 2006;18:1223–1229. [PubMed] [Google Scholar]
- 35.Khan N, Mupparaju S, Mintzopoulos D, et al. Burn trauma in skeletal muscle results in oxidative stress as assessed by in vivo electron paramegnetic resonance. Mol Med Rep. 2008;1:813–819. doi: 10.3892/mmr-00000033. [DOI] [PMC free article] [PubMed] [Google Scholar]
- 36.Tzika AA, Astrakas LG, Cao H, et al. Murine intramyocellular lipids quantified by NMR act as metabolic biomarkers in burn trauma. Int J Mol Med. 2008;21:825–832. [PubMed] [Google Scholar]
- 37.Tzika AA, Mintzopoulos D, Padfield K, et al. Reduced rate of adenosine triphosphate synthesis by in vivo 31P nuclear magnetic resonance spectroscopy and downregulation of PGC-1beta in distal skeletal muscle following burn. Int J Mol Med. 2008;21:201–208. [PubMed] [Google Scholar]
- 38.Righi V, Andronesi O, Mintzopoulos D, Tzika AA. Molecular characterization and quantification using state of the art solid-state adiabatic TOBSY NMR in burn trauma. Int J Mol Med. 2009;24:749–757. doi: 10.3892/ijmm_00000288. [DOI] [PMC free article] [PubMed] [Google Scholar]
- 39.Tzika AA, Mintzopoulos D, Mindrinos M, Zhang J, Rahme LG, Tompkins RG. Microarray analysis suggests that burn injury results in mitochondrial dysfunction in human skeletal muscle. Int J Mol Med. 2009;24:387–392. doi: 10.3892/ijmm_00000244. [DOI] [PMC free article] [PubMed] [Google Scholar]
- 40.Lippman MM, Laster WR, Abbott BJ, Venditti J, Baratta M. Antitumor activity of macromomycin B (NSC 170105) against murine leukemias, melanoma, and lung carcinoma. Cancer Res. 1975;35:939–945. [PubMed] [Google Scholar]
- 41.Sato T, Takusagawa K, Asoo N, et al. Ultrastructure of the Lewis lung carcinoma. Eur J Cancer Clin Oncol. 1982;18:369–376. doi: 10.1016/0277-5379(82)90008-6. [DOI] [PubMed] [Google Scholar]
- 42.Henry N, van Lamsweerde AL, Vaes G. Collagen degradation by metastatic variants of Lewis lung carcinoma: cooperation between tumor cells and macrophages. Cancer Res. 1983;43:5321–5327. [PubMed] [Google Scholar]
- 43.Argiles JM, Figueras M, Ametller E, et al. Effects of CRF2R agonist on tumor growth and cachexia in mice implanted with Lewis lung carcinoma cells. Muscle Nerve. 2008;37:190–195. doi: 10.1002/mus.20899. [DOI] [PubMed] [Google Scholar]
- 44.Llovera M, Garcia-Martinez C, Lopez-Soriano J, et al. Protein turnover in skeletal muscle of tumour-bearing transgenic mice overexpressing the soluble TNF receptor-1. Cancer Lett. 1998;130:19–27. doi: 10.1016/s0304-3835(98)00137-2. [DOI] [PubMed] [Google Scholar]
- 45.Forsen S, Hoffman R. Study of moderately rapid chemical exchange reactions by means of nuclear magnetic double resonance. J Chem Phys. 1963;39:2892–2901. [Google Scholar]
- 46.Ashburner M, Ball CA, Blake JA, et al. Gene ontology: tool for the unification of biology. The Gene Ontology Consortium. Nat Genet. 2000;25:25–29. doi: 10.1038/75556. [DOI] [PMC free article] [PubMed] [Google Scholar]
- 47.Gordon JN, Green SR, Goggin PM. Cancer cachexia. QJM. 2005;98:779–788. doi: 10.1093/qjmed/hci127. [DOI] [PubMed] [Google Scholar]
- 48.Peterson JM, Guttridge DC. Skeletal muscle diseases, inflammation, and NF-kappaB signaling: insights and opportunities for therapeutic intervention. Int Rev Immunol. 2008;27:375–387. doi: 10.1080/08830180802302389. [DOI] [PubMed] [Google Scholar]
- 49.MacDonald N, Easson AM, Mazurak VC, Dunn GP, Baracos VE. Understanding and managing cancer cachexia. J Am Coll Surg. 2003;197:143–161. doi: 10.1016/S1072-7515(03)00382-X. [DOI] [PubMed] [Google Scholar]
- 50.Alger JR, Shulman RG. NMR studies of enzymatic rates in vitro and in vivo by magnetization transfer. Q Rev Biophys. 1984;17:83–124. doi: 10.1017/s0033583500005266. [DOI] [PubMed] [Google Scholar]
- 51.Jucker BM, Ren J, Dufour S, et al. 13C/31P NMR assessment of mitochondrial energy coupling in skeletal muscle of awake fed and fasted rats. Relationship with uncoupling protein 3 expression. J Biol Chem. 2000;275:39279–39286. doi: 10.1074/jbc.M007760200. [DOI] [PubMed] [Google Scholar]
- 52.Roche TE, Baker JC, Yan X, et al. Distinct regulatory properties of pyruvate dehydrogenase kinase and phosphatase isoforms. Prog Nucleic Acid Res Mol Biol. 2001;70:33–75. doi: 10.1016/s0079-6603(01)70013-x. [DOI] [PubMed] [Google Scholar]
- 53.Sandri M, Lin J, Handschin C, et al. PGC-1alpha protects skeletal muscle from atrophy by suppressing FoxO3 action and atrophy-specific gene transcription. Proc Natl Acad Sci USA. 2006;103:16260–16265. doi: 10.1073/pnas.0607795103. [DOI] [PMC free article] [PubMed] [Google Scholar]
- 54.Zhang QH, Cao HH, Astrakas LG, et al. Uncoupling protein 3 expression and intramyocellular lipid accumulation by NMR following local burn trauma. Int J Mol Med. 2006;18:1223–1229. [PubMed] [Google Scholar]
- 55.Miwa S, Brand MD. Mitochondrial matrix reactive oxygen species production is very sensitive to mild uncoupling. Biochem Soc Trans. 2003;31:1300–1301. doi: 10.1042/bst0311300. [DOI] [PubMed] [Google Scholar]
- 56.Vidal-Puig AJ, Grujic D, Zhang CY, et al. Energy metabolism in uncoupling protein 3 gene knockout mice. J Biol Chem. 2000;275:16258–16266. doi: 10.1074/jbc.M910179199. [DOI] [PubMed] [Google Scholar]
- 57.Clapham JC, Arch JR, Chapman H, et al. Mice overexpressing human uncoupling protein-3 in skeletal muscle are hyperphagic and lean. Nature. 2000;406:415–418. doi: 10.1038/35019082. [DOI] [PubMed] [Google Scholar]
- 58.Lenaz G, Bovina C, D’Aurelio M, et al. Role of mitochondria in oxidative stress and aging. Ann N Y Acad Sci. 2002;959:199–213. doi: 10.1111/j.1749-6632.2002.tb02094.x. [DOI] [PubMed] [Google Scholar]
- 59.Lowell BB, Shulman GI. Mitochondrial dysfunction and type 2 diabetes. Science. 2005;307:384–387. doi: 10.1126/science.1104343. [DOI] [PubMed] [Google Scholar]
- 60.Li YP, Schwartz RJ, Waddell ID, Holloway BR, Reid MB. Skeletal muscle myocytes undergo protein loss and reactive oxygen-mediated NF-kappaB activation in response to tumor necrosis factor alpha. FASEB J. 1998;12:871–880. doi: 10.1096/fasebj.12.10.971. [DOI] [PubMed] [Google Scholar]
- 61.Laviano A, Meguid MM, Preziosa I, Rossi Fanelli F. Oxidative stress and wasting in cancer. Curr Opin Clin Nutr Metab Care. 2007;10:449–456. doi: 10.1097/MCO.0b013e328122db94. [DOI] [PubMed] [Google Scholar]
- 62.Arthur PG, Grounds MD, Shavlakadze T. Oxidative stress as a therapeutic target during muscle wasting: considering the complex interactions. Curr Opin Clin Nutr Metab Care. 2008;11:408–416. doi: 10.1097/MCO.0b013e328302f3fe. [DOI] [PubMed] [Google Scholar]
- 63.Mastrocola R, Reffo P, Penna F, et al. Muscle wasting in diabetic and in tumor-bearing rats: role of oxidative stress. Free Rad Biol Med. 2008;44:584–593. doi: 10.1016/j.freeradbiomed.2007.10.047. [DOI] [PubMed] [Google Scholar]
- 64.Fu Z, Tindall DJ. FOXOs, cancer and regulation of apoptosis. Oncogene. 2008;27:2312–2319. doi: 10.1038/onc.2008.24. [DOI] [PMC free article] [PubMed] [Google Scholar]
- 65.Glass DJ. Signalling pathways that mediate skeletal muscle hypertrophy and atrophy. Nat Cell Biol. 2003;5:87–90. doi: 10.1038/ncb0203-87. [DOI] [PubMed] [Google Scholar]
- 66.Sandri M, Sandri C, Gilbert A, et al. Foxo transcription factors induce the atrophy-related ubiquitin ligase atrogin-1 and cause skeletal muscle atrophy. Cell. 2004;117:399–412. doi: 10.1016/s0092-8674(04)00400-3. [DOI] [PMC free article] [PubMed] [Google Scholar]
- 67.Costelli P, Muscaritoli M, Bossola M, et al. IGF-1 is down-regulated in experimental cancer cachexia. Am J Physiol Regul Integr Comp Physiol. 2006;291:R674–R683. doi: 10.1152/ajpregu.00104.2006. [DOI] [PubMed] [Google Scholar]
- 68.Stitt TN, Drujan D, Clarke BA, et al. The IGF-1/PI3K/Akt pathway prevents expression of muscle atrophy-induced ubiquitin ligases by inhibiting FOXO transcription factors. Mol Cell. 2004;14:395–403. doi: 10.1016/s1097-2765(04)00211-4. [DOI] [PubMed] [Google Scholar]
- 69.Saini A, Al-Shanti N, Stewart CE. Waste management-cytokines, growth factors and cachexia. Cytokine Growth Factor Rev. 2006;17:475–486. doi: 10.1016/j.cytogfr.2006.09.006. [DOI] [PubMed] [Google Scholar]
- 70.Khal J, Wyke SM, Russell ST, Hine AV, Tisdale MJ. Expression of the ubiquitin-proteasome pathway and muscle loss in experimental cancer cachexia. Br J Cancer. 2005;93:774–780. doi: 10.1038/sj.bjc.6602780. [DOI] [PMC free article] [PubMed] [Google Scholar]
- 71.Jacobson BA, De A, Kratzke MG, et al. Activated 4E-BP1 represses tumourigenesis and IGF-I-mediated activation of the eIF4F complex in mesothelioma. Br J Cancer. 2009;101:424–431. doi: 10.1038/sj.bjc.6605184. [DOI] [PMC free article] [PubMed] [Google Scholar]
- 72.Kim YY, Von Weymarn L, Larsson O, et al. Eukaryotic initiation factor 4E binding protein family of proteins: sentinels at a translational control checkpoint in lung tumor defense. Cancer Res. 2009;69:8455–8462. doi: 10.1158/0008-5472.CAN-09-1923. [DOI] [PMC free article] [PubMed] [Google Scholar]
- 73.Hara K, Yonezawa K, Kozlowski MT, et al. Regulation of eIF-4E BP1 phosphorylation by mTOR. J Biol Chem. 1997;272:26457–26463. doi: 10.1074/jbc.272.42.26457. [DOI] [PubMed] [Google Scholar]
- 74.Sonenberg N. eIF4E, the mRNA cap-binding protein: from basic discovery to translational research. Biochem Cell Biol. 2008;86:178–183. doi: 10.1139/O08-034. [DOI] [PubMed] [Google Scholar]
- 75.Dowling RJ, Pollak M, Sonenberg N. Current status and challenges associated with targeting mTOR for cancer therapy. BioDrugs. 2009;23:77–91. doi: 10.2165/00063030-200923020-00002. [DOI] [PubMed] [Google Scholar]