

Abstract
The BDC2.5 T cell clone is highly diabetogenic, but the transgenic mouse generated from that clone is surprisingly slow in diabetes development. While defining pathogenic effector T cells in autoimmunity has been inconsistent, CD4+ cells expressing the CD40 receptor (Th40 cells) are highly diabetogenic in NOD mice and NOD.BDC2.5.TCR.Tg mice possess large numbers of these cells. Given the importance of CD40 for pathogenic T cell development, BDC2.5.CD40−/− mice were created. Tregs, CD4+CD25hiFoxP3+, develop normally but pathogenic effector cells are severely reduced in number. Th40 cells from diabetic BDC2.5 mice rapidly induce diabetes in NOD.scid recipients but Th40 cells from pre-diabetic mice transfer diabetes very slowly. Demonstrating an important paradigm shift, effector Th40 cells from pre-diabetic mice are FoxP3+. As mice age, moving to T1D development Th40 cells lose FoxP3. When Th40 cells that are FoxP3+ are transferred to NOD.scid recipients disease is delayed. Th40 cells that are FoxP3− rapidly transfer disease. Th40 cells from BDC2.5.CD40−/− mice do not transfer disease nor do they lose FoxP3 expression. Mechanistically, FoxP3+ cells produce IL-17 but do not produce IFNγ while FoxP3− Th40 cells produce IFNγ and IL-2. This poses a new consideration for the function of FoxP3, as directly impacting effector T cell function.
Keywords: FoxP3, CD40, tolerance, auto-aggressive T cell, regulatory T cell
Introduction
Autoimmune diseases are characterized by the emergence of auto-aggressive cells leading to auto antibody production and T cell mediated aseptic inflammation. In the case of type 1 diabetes pathogenic effector T cells and other cells infiltrate pancreatic islet beta cells (insulitis) leading to loss of insulin production. An interesting aspect of this is the high degree of attack specificity confounded by the multiplicity of auto-antigen responses. Immune cells must exist in homeostatic balance to prevent such outcomes; with tolerance ultimately keeping the system in check. T cell tolerance mechanisms include: anergy due to inappropriate costimulation (1); T cell receptor revision (2); activation induced cell death (3) and regulatory T cell (Treg) control of pathogenic effector T cells (4). In autoimmunity, auto-aggressive T cells (TAA) escape control, thus breaching tolerance mechanisms.
Clear definition of TAA cells has proven difficult and inconsistent; attempts to identify biomarkers have not always been successful. TAA typically are associated with a memory phenotype where cells rapidly express and then down-regulate activation markers e.g. CD69, CD25 and CD154, etc. Activated human T cells express HLA-DR with one study suggesting that HLA-DR+ and CD30 are diabetogenic T cell biomarkers (5). We defined a subset of effector T cells based on CD40 expression that have proven highly diabetogenic in the NOD mouse model of T1D (6–10). Th40 cells produce pro-inflammatory cytokines and interestingly can produce IL-17A (Th17 defining cytokine) and IFNγ (a Th1 defining cytokine) concurrently (11).
Th40 cell levels are predictive of diabetes onset and are highly pathogenic, as determined by passive disease transfer experiments (6, 8–10). Given that Th40 cell numbers in spleen and pancreatic lymph nodes of NOD mice are significantly expanded and capable of disease transfer when isolated prior to diabetes onset we performed a translational study to examine Th40 cells in diagnosed diabetic human subjects. In a blinded study we correctly identified T1D patients versus controls and importantly T2D subjects using the Th40 identifier (12). New onset (diagnosis less than 2 weeks) and long term diabetic subjects (diagnosis greater than 40 years) maintain a significantly (p < 10−7) elevated percentage of Th40 T cells compared to controls (12). Additionally CD40 expression occurs on naïve and memory T cells making CD40 expression irrelevant of activation status.
CD4+CD25+ cells that express the forkhead box transcription factor FoxP3 are defined as Tregs (13). Tregs control TAA through cell contact and secretion of cytokines including TGFβ and IL-10. Transfer of polyclonal NOD CD4+ T cells transduced with a FoxP3 retrovirus did not protect from diabetes but transfer of BDC2.5 cells transduced with FoxP3 ameliorated disease for greater than 100 days (14). Another antigen specific (GAD protein) FoxP3 transduced T cell (15) clone did not protect from diabetes, suggesting an antigen specificity requirement for Treg function. FoxP3 expression is required for Treg development (16) and functions as a transcriptional repressor and transcriptional activator (17). Major suppressor targets are cytokine genes including IL-2 and IFNγ (18), which are effector cell cytokines. Plasticity to FoxP3 expression has been demonstrated; for example, it was shown that a FoxP3-intermediate and a FoxP3-high population of cells exist (15). Interestingly a subset of cells is FoxP3int RORγt+, with RORγt being the crucial transcription factor for IL-17 expression (15). Splenic FoxP3int RORγt+ cells express membrane TGFβ and CD62L, the latter targeting them to the pancreas (15). Importantly these cells could function as Tregs but also could polarize to a Th17 effector cell phenotype (15).
The BDC2.5 T cell clone is highly diabetogenic, inducing rapid insulitis then hyperglycemia in NOD.scid recipient mice (19); and it accelerates diabetes in young NOD recipients (20). Given the highly auto-aggressive nature of this T cell clone, it was assumed that the TCR transgenic (TCR.Tg) mouse would be highly diabetogenic when in fact it proved to be much less diabetes susceptible than NOD mice (21). While typically 80% of NOD mice are diabetic by 20 weeks of age, only 15% of BDC2.5.TCR.Tg mice are diabetic by 25 weeks and 50% by 40 weeks (21). BDC2.5.TCR.Tg generated on a RAG knockout background experience rapid diabetes, with 100% incidence by 8 weeks (21). Even though BDC2.5 mice have T cells carrying a highly auto-aggressive TCR, Tregs are abundant in these mice (22). It was shown that a population of CD4+FoxP3+ cells occur at a markedly increased frequency (22). Such expansions did not occur in NOD, BALB/c or C57BL/6 mice. Furthermore the suppressive function by classic Tregs remained intact through 20 weeks of age (22).
Given all the above considerations, we hypothesize that FoxP3 expression may be more complicated than just strict association with classic Tregs. We postulate that FoxP3 is expressed in cells destined for effector function acting as a temporal auto-regulator. In this study we confirm that BDC2.5 TCR.Tg mice have excessively delayed diabetes kinetics but 100% of mice become diabetic given sufficient time. BDC2.5 mice on a CD40 knockout background do not become diabetic at all and T cells isolated from those mice are incapable of transferring diabetes, even after extended time periods. T cells develop in BDC2.5.CD40−/− mice with fewer CD4+ cells and slightly more CD8+ cells. Classic Tregs in these mice are functionally intact while pathogenic effector cells are drastically ablated. In BDC2.5 mice, Th40 cells express intracellular FoxP3 initially but loose it over time. Effector T cells from BDC2.5.CD40−/− mice do not loose FoxP3 intracellular expression and do not develop diabetes. Th40 cells isolated from younger, 6 – week old donor, or older, 22 – week non-diabetic, BDC2.5 mice require longer time periods to transfer diabetes. Th40 cells isolated from diabetic BDC2.5 mice transfer diabetes very rapidly. In cases where diabetes transfer is slower, a substantial portion of Th40 cells have FoxP3, while rapidly disease transferring Th40 cells are FoxP3−. When Th40 cells are recovered from diabetic recipient mice the cells are all FoxP3−. Mechanistically, FoxP3− Th40 cells produce Th1 cytokines IFNγ and IL-2 in addition to producing the Th17 definitive cytokine IL-17. Interestingly, FoxP3− Th40 cells produce IL-17 but do not produce IFNγ or IL-2. These data suggest a definitive role for IFNγ in diabetes progression and supports other reports that IL-17 is not instrumental in diabetes development in the BDC2.5 model (23). These data further suggest an alternative role for FoxP3 as suppressing effector T cell function and that suppressor function is eventually lost in CD40 competent mice but not in CD40 deficient mice.
Materials and Methods
Mice
NOD.BDC2.5 mice were purchased from Jackson Laboratories and NOD mice were from Taconic Laboratories. All mice were confirmed by UCD Veterinarian staff to be pathogen free. NOD.BDC2.5.CD40−/− mice were generated using established speed congenic methods. NOD.CD154−/− mice were generated by breeding NOD mice to B6.CD154−/− through 10 generations. NOD.CD154−/− was confirmed by screening for the neo-cassette insert. The CD40 knockout is a functional knockout with an insertion in the exon 3 region interrupting the CD154 binding site (24). CD40 protein is still detected on cells. Experiments were conducted under University of Colorado Denver Anschutz Medical campus approved Institutional Animal Use and Care and Use Committee protocols. Procedures to alleviate pain and suffering were done according to UC-Denver IACUC guidelines.
Diabetes Incidence and Histology
Mice were monitored for blood glucose by tail vein bleeds. Diabetes was considered to be blood glucose greater than 250 mg/dl for 3 consecutive readings in a one week period. Pancreata were taken from mice and paraffin embedded. Sections were stained with hematoxylin/eosin. Islets were scored on the following scale: 0 = no infiltrates; 1 = unipolar insulitis; 2 = bipolar insulitis; 3 = complete infiltration.
Antibodies, Staining and Flow Cytometry
Antibodies with directly conjugated fluors included: anti-CD4 (clone H29.19), anti-CD8 (clone 53.6.7), anti-CD5, anti-CD8, anti-FoxP3, anti-CD44, anti-CD62L, anti-IFNγ, anti-IL-17, anti-IL-2 and isotype controls that were purchased from eBioscience (San Diego, CA) and Miltenyi (Auburn CA). Anti-CD40 (hybridomas 1C10 and 4F11) and anti-CD25 (hybridoma PC6.5.3) are produced in house. Intracellular staining for FoxP3 or cytokines was performed using eBioscience permeabilization/fixation buffers as per manufacturer’s instructions. Cells from pancreatic lymph nodes, peripheral lymph nodes or spleen were depleted using anti-MHC-II magnetic beads and sorted on a Miltenyi Auto-MACS cell separator. Cells were stained at 4°C and FcR blocking antibody 2.4G2 was added to each sample.
Cell sorting
Th40 cells were purified by sorting CD4lo cells as previously described (7). Th40 cells were isolated by removing MHC-II+ cells followed by CD40 selection using a Miltenyi AutoMacs. In both cases CD25+ cells were pre-sorted to remove potential Tregs. In studies involving Tregs, CD40+ cells were removed prior to isolation of Tregs. Cells were cultured in DMEM with 10% fetal calf serum.
Adoptive Transfers
Sorted Th40 cells from BDC2.5 or from BDC2.5.CD40−/− mice were injected IP (intra-peritoneal) into NOD.scid recipient mice age less than 3 weeks. In donors, FoxP3 levels were confirmed by flow cytometry and western blots. BDC2.5 T cell clones were maintained as described (25) and purified T cells injected. Cells were a single injection at concentration of 5 ×10⁶ in all studies.
RESULTS
We compared kinetics of diabetes onset in NOD.BDC2.5, (BDC.2.5 wild type), BDC2.5.CD40−/−, NOD, and NOD.CD154−/− mice. In our colony, 80% of female NOD mice become diabetic by 21 – weeks of age (Fig. 1A). BDC2.5 mice on a NOD background develop diabetes slowly, but with 100% penetrance over a prolonged period, in this case 48 weeks (Fig. 1A). Histology of pancreata from diabetic BDC2.5 mice demonstrates extensive T cell infiltrates (Fig. 1B and E). The CD40/CD154 inflammatory dyad is tightly associated with autoimmunity (11, 26, 27), and blocking CD40/CD154 interaction prevents numerous autoimmune diseases including T1D (10, 28). We generated BDC2.5.TCR.Tg mice on a CD40−/− background (BDC2.5.CD40−/−), which completely prevented diabetes onset through 60 weeks (Fig. 1A). Furthermore, in a CD40 deficient environment pancreata do not develop infiltrates (Fig. 1C and E). CD40 expression on APC directly impacts T cell development therefore we examined diabetes incidence in NOD.CD154−/− mice that have normal CD40 expression, including normal development of Th40 cells (not shown). These mice also do not develop diabetes (Fig. 1A) and no islet infiltrates are detected (Fig. 1D and E). These data suggest that CD154 expression contributes to islet infiltration and is required for diabetes development.
Figure 1. Diabetes Incidence in NOD.BDC2.5 and NOD.BDC2.5.CD40−/− mice.

(A) Mice with blood glucose greater than 250 mg/dl for 3 consecutive readings over 7 days were considered diabetic. Mice included: NOD (positive control, 40 mice total), NOD.BDC2.5 mice (24 total), NOD.BDC2.5.CD40−/− mice (24 total) and NOD.CD154−/− mice (20 total) that were monitored over 60 weeks. Representative histology of pancreata from age matched (B) BDC2.5 mice; (C) BDC2.5.CD40−/− and (D) NOD.CD154−/− mice. (E) Histology scores of pancreata. Data represent over 100 islets examined from each cohort. Scale is 0 = no insulitis; 1 = uni-polar insulitis; 2 = bi-polar insulitis; and 3 = complete infiltration. BDC2.5 scores are post diabetes onset and BDC2.5.CD40−/− and NOD.CD154−/− are at 45 weeks of age. A one way ANOVA analysis using Graph Pad Prism, showed highly significant, p < 0.001, differences between BDC2.5, NOD, BDC2.5.CD40−/− and NOD.CD154−/− curves.
We compared lymphocytes from pancreatic (draining) lymph nodes and peripheral (non-draining) lymph nodes between BDC2.5 and BDC2.5.CD40−/− mice. While the BDC2.5 TCR is I-Ag7 restricted favoring CD4 T cell development, CD8 cells arise in those mice nonetheless (Fig 2A, B and C). In both draining and non-draining lymph nodes substantially more CD4+ cells than CD8+ cells were detected in the CD40 sufficient environment (Fig. 2A, B and C). In peripheral and pancreatic lymph nodes there were significantly more CD4+ cells in BDC2.5 than in BDC2.5.CD40−/− mice, suggesting that CD40 promotes or sustains CD4 expansions in those mice. Interestingly there was significantly (p < 0.001) more CD8+ cells in pancreatic lymph nodes of BDC2.5.CD40−/− mice. In pancreatic lymph nodes of BDC2.5 mice a population of CD4+CD8+ cells was detected (Fig. 2A and D). This population was much less prominent in peripheral (non-draining) lymph nodes. In BDC2.5.CD40−/− mice there were significantly fewer CD4+CD8+ (Fig. 2A and D).
Figure 2. CD4 and CD8 levels in lymph nodes of BDC2.5 and BDC2.5.CD40−/− mice.

(A) Peripheral lymph nodes including axial, brachial, inguinal and sub-maxillary and pancreatic lymph nodes were excised from BDC2.5 and BDC2.5.CD40−/− mice at 12 weeks of age. Single cell suspensions were stained for CD4 versus CD8. Representative dot plots from 8 different mice from each cohort are shown. Gates were set from isotype controls (not shown). Plots of differences in CD4 and CD8 percentages in (B) peripheral lymph nodes and (C) pancreatic lymph nodes of BDC2.5 and BDC2.5.CD40−/− mice. (D) Plots of percentages of CD4+CD8+ double positive cells in pancreatic lymph nodes of BDC2.5 and BDC2.5.CD40−/− mice (8 total). Statistics were determined by unpaired Student’s t-test using the GraphPad Prism program.
CD40 and memory phenotype
Given that CD40 signals are critical for memory T cell development (29), we examined the effect of CD40 on memory versus naïve CD4+ cells in this TCR.Tg model. BDC2.5 mice have a substantial proportion of effector memory, CD44+CD62L− cells and central memory, CD44+CD62L+ cells, with very few naïve, CD44−CD62L+, cells (Fig. 3A). T cells from BDC2.5.CD40−/− mice have significantly more (p < 0.001) naïve phenotype cells and a significantly reduced number of effector memory cells (Fig. 3B). The number of central memory cells, CD44+CD62L+ is unaltered compared to BDC2.5 mice (Fig 3A and B). Both congenic strains have identical self-reactive TCR molecules demonstrating an important role for CD40 in memory T cell development irrespective of TCR expression. It is true that APC are affected by lack of CD40 expression in BDC2.5.CD40−/− mice yet the role of CD40 affecting memory T cell development in these TCR transgenic mice remains evident.
Figure 3. The effect of CD40 on memory phenotype in BDC2.5 versus BDC2.5.CD40−/− mice.
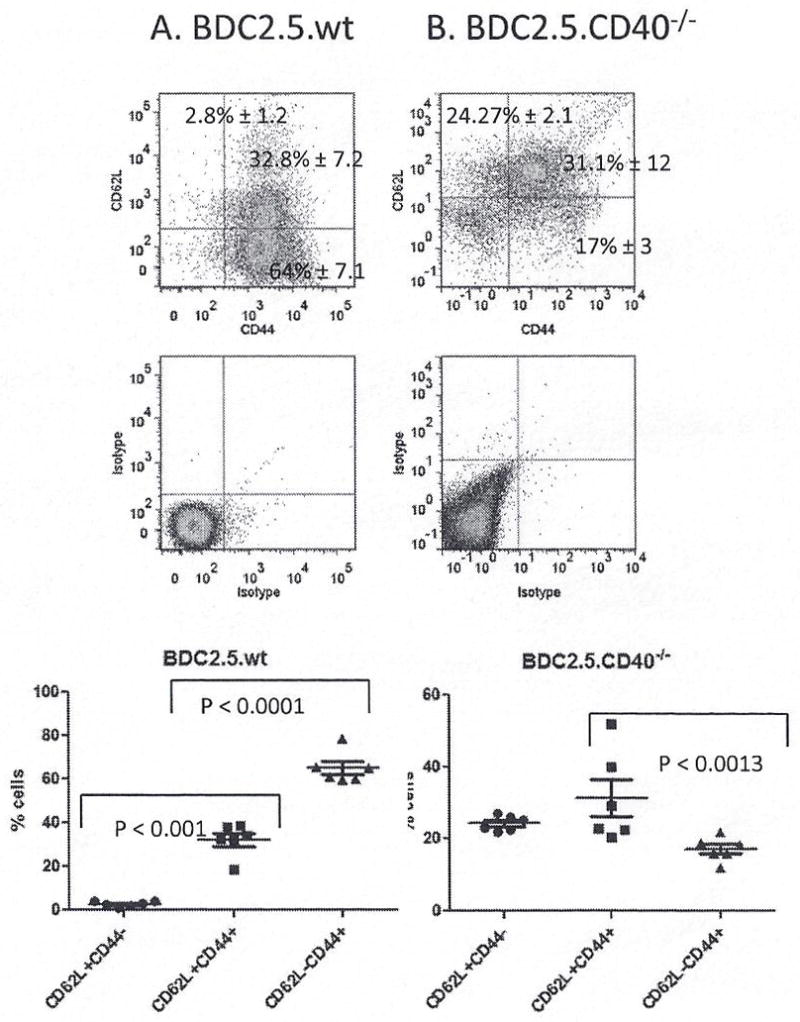
Pancreatic lymph nodes and spleens were analyzed from 12 – week old BDC2.5 and BDC2.5.CD40−/− mice for memory and naïve phenotypes. MHC-II+ depleted cells were stained for CD4, CD44 and CD62L for (A) BDC2.5 and (B) BDC2.5.CD40−/− mice; 8 mice of each cohort were examined. Statistics were determined by unpaired Student’s t-test using the GraphPad Prism program.
Pathogenic effector T cells
BDC2.5.TCR.Tg mice present a model where potential Tregs and potential auto-aggressive T cells express the same TCR and thus respond to the same auto-antigen. The CD40 knockout has a neo-cassette insertion in exon 3 of CD40 that contains the CD154 binding site and thus is a ‘functional’ knockout (24); therefore the CD40 protein can be expressed, but should not receive CD154 mediated signals. BDC2.5 mice have a substantial Th40 cell population in pancreatic lymph nodes (Fig. 4A). BDC2.5.CD40−/− mice have Th40 cells, but at significantly reduced numbers (p < 0.0001) (Fig. 4B). Within the CD4 population a CD4lo and CD4hi population is detectable (Fig. 4B). In previous work we showed that phenotypically CD4lo cells have as much CD4 as phenotypically CD4hi cells, when examined by western blot (7). We compared levels of Th40 cells in pancreatic lymph nodes (PLN) and spleens of mice at 6 – weeks and at 21 – weeks of age (Fig. 4C and D). In BDC2.5 mice, there was a significant increase in Th40 cells in PLN and in spleen at 21 – weeks compared to 6 – weeks of age (Fig. 4C). In the BDC2.5.CD40−/− levels of Th40 cells remained contained (Fig. 4D) and were significantly (p < 0.00001) lower than in wild type mice (Fig. 4D compared to C).
Figure 4. Levels of pathogenic effector Th40 cells in pancreatic lymph nodes of BDC2.5 and BDC2.5.CD40−/− mice.
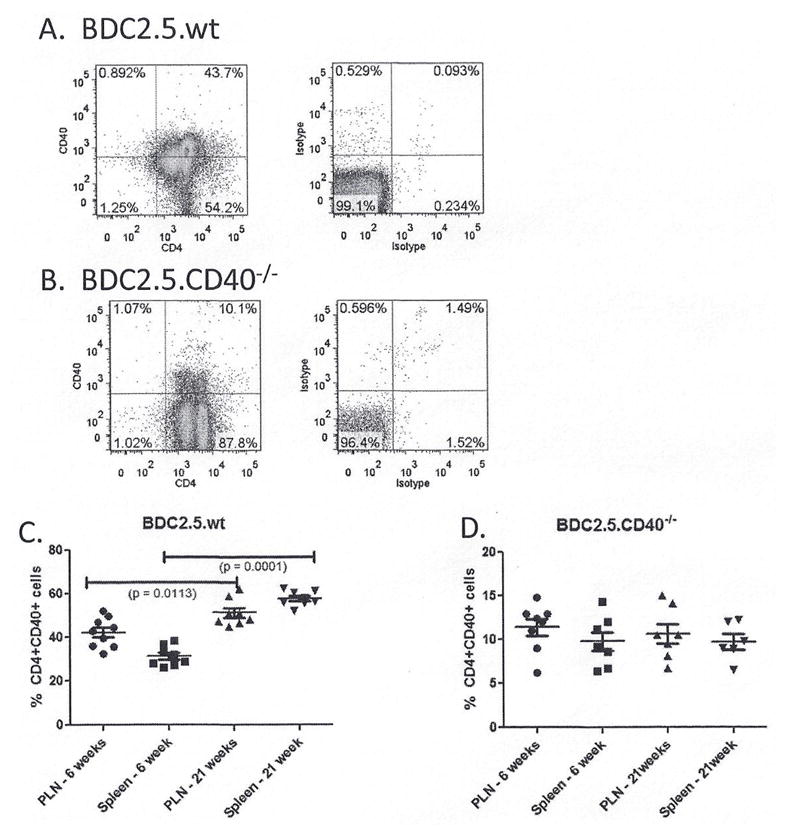
Pancreatic lymph nodes and spleens were excised from BDC2.5 and BDC2.5.CD40−/− mice at 6 – weeks and 21 – weeks of age. Cells were stained for CD4 and CD40 with gates set from isotype controls. Representative dot plots from (A) BDC2.5 and (B) BDC2.5.CD40−/− mice are shown. (C) The percent of Th40 cells in pancreatic lymph nodes (PLN) and spleens from 9 individual mice cells of age matched BDC2.5 and BDC2.5.CD40−/− mice (8 total). Statistics were determined by unpaired ANOVA using the GraphPad Prism program.
Tregs and CD40
BDC2.5 mice eventually breach tolerance to develop diabetes (Fig. 1). Previous studies describe a population of CD4+CD25+FoxP3+CD69− T cells in BDC2.5 mice that could be regulatory (30). Because of the delayed kinetics in diabetes development in BDC2.5 and lack of diabetes development in BDC2.5.CD40−/− mice we inspected Tregs in each of these mice over time. We examined CD4+FoxP3+ cells in pancreatic lymph nodes and spleens of 6 – weeks and at 21 – weeks of age. In BDC2.5 mice there were significantly more Tregs in spleen than in PLN at 6 weeks of age (p < 0.001) (Fig. 5A). At 21 – weeks of age there was a significant increase in Tregs (p = 0.0019) in PLN with no significant change in spleens (Fig. 5A). In BDC2.5.CD40−/− mice there were overall more Tregs with Treg numbers further increasing in PLN at 21 – weeks of age (Fig. 5B).
Figure 5. Classic Tregs in BDC2.5 and BDC2.5.CD40−/− mice.

Classic Tregs were defined as CD4+CD25hi FoxP3+ and were examined after CD40+ T cells had been removed. Graphs demonstrate Treg percentages in (A) BDC2.5 and (B) BDC2.5.CD40−/− mice, at least 6 mice of each type were examined. Statistics were determined by ANOVA using the GraphPad Prism program.
FoxP3 expression in pathogenic effector cells
Given that Treg numbers are normal in BDC2.5.TCR.Tg mice and because a substantial population of CD4 cells in BDC2.5 and BDC2.5.CD40−/− mice are FoxP3+ but only a portion of those cells are CD25+, we examined FoxP3 expression within Th40 cells over time as BDC2.5 mice develop diabetes. In young BDC2.5 mice, a subset (36.6%) of Th40 cells expresses low levels of FoxP3 (Fig. 6A). As mice age to 21 weeks, the level of FoxP3+ cells within the Th40 population and in CD4+CD25+ cells substantially increases (Fig. 6A, B and C). Furthermore, the expression level of FoxP3 within cells also increases as measured by mean fluorescent intensity. Once diabetes onsets both the percentage of FoxP3+ cells and the cellular expression level of FoxP3 diminishes (Fig. 6A and C) in Th40 cells. By comparison FoxP3 levels within classic Tregs does not diminish over the same time period (Fig. 6C).
Figure 6. FoxP3 expression on Th40 versus Treg cells.

Pancreatic lymph nodes were excised from NOD.BDC2.5 mice at 6 and 22 weeks of age and from diabetic mice (35 weeks of age). (A) Cells were stained for CD4, CD40, and FoxP3. Dot plot of CD4 versus CD40, above isotype controls, representing 15 different mice is shown. Within the Th40 population histograms for FoxP3 (histogram, dark line) above isotype control (light line) are shown. Data represent 9 individual mice. (B) Dot plots of CD4 versus CD25 above isotype control and FoxP3 levels (histogram, dark line) above isotype control (light line). Data represent 9 individual mice. (C) The percentage of FoxP3+ cells in CD4+CD40+ and CD4+CD25hi populations from each of the 9 mice is represented. Statistics were determined by unpaired Student’s t-test using the GraphPad Prism program.
We considered that FoxP3 expression in effector cells, independent of Tregs impacts diabetogenicity. We sorted Th40 cells from pre-diabetic BDC2.5 mice with 57% of the cells being FoxP3+ (Fig. 7A). Cells were adoptively transferred to NOD.scid recipients that were monitored for disease (Fig. 7B). Kinetics of diabetes onset was compared between the BDC2.5 T cell clone that is FoxP3−, Th40 cells from the diabetic, FoxP3− BDC2.5 mice, cells from 6 – week old and 22 – week old BDC2.5 that are FoxP3+, and cells from BDC2.5.CD40−/− FoxP3+ mice. Th40 cells from pre-diabetic BDC2.5 mice that were FoxP3+ had significantly delayed disease kinetics although mice eventually became diabetic (Fig. 7B). There was no significant difference in disease transfer between cells from 6 – week old FoxP3+ cells or 22 – week old FoxP3+ cells (Fig. 7B). Cells from diabetic BDC2.5 transferred disease rapidly (Fig. 7B). At diabetes onset, T cells were extracted from spleens of recipient mice that received FoxP3+ BDC2.5 cells and examined for CD40 and FoxP3 expression. FoxP3 expression in Th40 cells was undetectable (Fig. 7C). Cells from BDC2.5.CD40−/− did not transfer disease through 60 weeks and importantly did not lose FoxP3 expression in vivo.
Figure 7. Th40-FoxP3+ cells do not transfer diabetes but Th40-FoxP3− cells do.

CD4+ cells from pre-diabetic BDC2.5 mice, 12-weeks of age, were isolated and stained for (A) FoxP3 and CD40 levels above isotype controls. CD25+ cells were depleted and the Th40 cells were adoptively transferred, 5×10⁶, to NOD.scid recipients. Likewise Th40 cells were isolated from diabetic BDC2.5 mice. (B) NOD.scid recipients (16 total) of BDC2.5 cells from diabetic mice became diabetic with rapid kinetics. Recipient mice (6 total from 6 weeks of age and 6 total from 21 weeks of age) of Th40-FoxP3+ cells, 5×10⁶, do become diabetic but with significantly delayed kinetics. Mice receiving BDC2.5.CD40−/− T cells (12 total) do not develop diabetes through 60 weeks. (C) T cells were recovered from pancreatic lymph nodes and spleens of NOD.scid recipients of Th40-FoxP3+ cells and stained for FoxP3 expression. Recovered cells from recipients of Th40-FoxP3+ cells from BDC2.5.CD40−/− mice did not lose FoxP3 even through 60 weeks.
FoxP3+ cells in the BDC2.5 diabetes model produce IL-17 but not Th1 cytokines
Diabetogenesis is driven predominantly by Th1 cytokines; in fact a substantial role for IFNγ as the major contributor to disease is suggested (23, 31). Th17 cells produce IL-17 and IL-22 and while they have been associated with autoimmunity their role in T1D is disputed (23). Th17 polarized BDC2.5 cells transfer diabetes to NOD.scid recipient but convert to Th1, producing IFNγ (23). We previously showed that Th40 cells are capable of producing IFNγ and IL-17 and in fact can concomitantly express both cytokines (11). Interestingly, Th40 cells that are FoxP3+ express ROR-γt, the transcription factor responsible for IL-17 production (Fig. 8A). FoxP3+ Th40 cells from BDC2.5 and CD4+ T cells from BDC2.5.CD40−/− mice express IL-17 but do not express IFNγ or IL-2 (Fig. 8B). IL-17 production in CD40 deficient conditions is significantly (p < 0.001) greater than in BDC2.5 mice. FoxP3− cells on the other hand express all three cytokines. FoxP3− cells from BDC2.5 mice that are CD40 sufficient, express significantly (p < 0.0003) more IFNγ. IL-2 production is not significantly (p = 0.2586) different in BDC2.5 or CD40 deficient conditions (Fig. 8C). As in the case with FoxP3+ cells, FoxP3− cells from CD40 deficient conditions produce significantly (p < 0.0001) more IL-17 (Fig. 8C).
Figure 8. Cytokine production in FoxP3+ and FoxP3− cells within Th40 cell population.

Th40 cells from BDC2.5 or BDC2.5.CD40−/− mice were examined for (A) ROR-γt levels. Histograms represent ROR-γt (dark line) above isotype control (light line). Histogram represents 6 different mice. Th40 cells were purified from pancreatic lymph nodes of BDC2.5 or BDC2.5.CD40−/− mice and examined immediately ex vivo by intra-cellular staining for IFNγ, IL-2 or IL-17. Cells from 6 mice of BDC2.5 or BDC2.5.CD40−/− mice were compared. The percent positive cells in (B) FoxP3+ population and (C) FoxP3− population is shown.
Discussion
A significant role for CD40 in autoimmunity is clear. The role for CD40 on T cells is more controversial, although numerous studies describing CD40 expressing T cells now exist (6–12, 32–34). Understanding the role of Th40 cells is important to understanding how CD40 affects the immune system and the critical role that it plays in autoimmunity. CD40 engagement was first described on B cells and was reported as essential for antibody class switching (35). Expression on macrophages was later described and the functional outcome was pro-inflammatory cytokines including TNFα, IL-1, and IL-6 among others (36). On T cells CD40 serves to induce pro survival molecules including Bcl-XL, and c-FLIP (7) and importantly CD40 serves as a functional costimulus, even eclipsing CD28 for pro inflammatory cytokine production (37, 38). An interesting aspect is that Th40 cells can simultaneously produce IFNγ, a Th1 cytokine, and IL-17A, the definitive Th17 cytokine (11). This suggests an overlooked link between Th1 and Th17 cells relative to auto-aggressive potential.
The BDC2.5 T cell clone and subsequent TCR transgenic mouse have proven useful in understanding diabetogenesis. BDC2.5 TCR recognizes chromogranin-A (39) and the clone is highly diabetogenic while the TCR.Tg mouse has surprisingly slow disease kinetics. Given sufficient time however, BDC2.5 mice become diabetic in a CD40 dependent process. BDC2.5.CD40−/− mice do not become diabetic but because CD40 is expressed on APC the precise cellular contribution remains unknown. An important observation made here is that T cells isolated from BDC2.5.CD40−/− mice do not transfer disease to a background where APC are CD40 sufficient. This is true even over a long time period, demonstrating that CD40 expression directly on T cells is involved in breach of tolerance. In addition, only a small portion of T cells from BDC2.5.CD40−/− mice progress to memory phenotype. These data suggest that a CD40 competent background is required for pathogenic/auto-aggressive T cell development. Furthermore, by doing these experiments in the BDC2.5 system, where a highly pathogenic TCR is expressed, it can be concluded that factors intrinsic to T cell development independent of TCR expression contribute to pathogenesis of T cells and those factors are directly influenced by CD40.
In BDC2.5 mice it has been shown that Tregs develop normally (22). It has been shown in the NOD model of T1D that Treg numbers are normal early but then qualitative function of Tregs diminishes as mice develop diabetes (40). However in those studies “pathogenic” effector cells were not removed prior to isolation of CD25+ Tregs. CD25 is activation induced and thus the true Treg population was qualitatively underestimated. When CD40+ T cells are removed and then CD25+ cells are counted or isolated for functional assays, the numbers of Tregs and the function of Tregs in NOD mice are identical to non-autoimmune BALB/c mice (9). Furthermore different subsets of Tregs have been reported within the CD4+ population including CD25+, CD62L+ and CD45RBlow (41). Depletion of each subset separately resulted in different autoimmune outcomes in NOD mice, however only CD4+CD25+ cells were capable of suppressing effector T cell proliferation (41). Here we further report that while pathogenic effector T cells require a CD40 competent background for development, Tregs do not.
Given the finding that BDC2.5 mice eventually develop diabetes with 100% penetrance but do so with notably longer kinetics, we suspected a temporal peripheral tolerance dysfunction independent of Tregs. As stated, Tregs appear normal in BDC2.5 mice therefore we considered effector T cells. We have studied Th40 cells extensively and determined that in NOD mice they are highly pathogenic (6–12, 32–34). In fact, peripheral Th40 cells are as effective at disease transfer as diabetogenic T cell clones. We determined that BDC2.5 mice have expanded numbers of Th40 cells and that adoptive transfer of diabetes when those cells were obtained from pre-diabetic mice required extended time. If however Th40 cells were isolated from diabetic BDC2.5 mice, then diabetes incidence occurred very rapidly; thus indicating dysfunction specifically within this effector cell subset. Importantly there was no significant difference in disease transfer using BDC2.5 cells from young (6 week old) or older (21 week old) pre-diabetic mice.
FoxP3 functions as both a gene repressor, affecting cytokine genes among others, and a gene activator (42). It is predominantly associated with regulatory T cell function where it impacts anergy and induction of genes involved in suppressor activity (42). We considered a paradigm shift that effector T cells, in this case Th40 cells, could express but then lose FoxP3 and thus auto-regulate (18). Such cells may achieve full effector status, which is precisely what was observed. In pre-diabetic BDC2.5 mice a substantial portion of Th40 T cells were FoxP3+. When those cells were adoptively transferred and mice became diabetic, FoxP3 expression was lost. BDC2.5.CD40−/− T cells did not transfer diabetes even over long time periods. When those cells were removed from recipient mice, FoxP3 expression was still intact. These T cells were generated in a CD40 deficient background but were placed in a CD40 competent environment; the BDC2.5.CD40−/− T cells were not capable of receiving endogenous CD40 signals and did not lose FoxP3 expression. The conclusion therefore is that CD40 signals directly to T cells impact tolerance mechanisms of those cells and promote pathogenesis.
There were notable differences in FoxP3+ and FoxP3− Th40 cells relative to cytokine production. FoxP3− cells had more prominent Th1 characteristics, producing IFNγ and IL-2, but also were able to produce IL-17. Perhaps more telling is the FoxP3+ cytokine bias in Th40 cells. Those cells did not produce Th1 cytokines, but did produce IL-17. Th40-FoxP3+ cells produce RORγt, suggesting a pathway to effector function. Importantly those cells did not transfer diabetes until FoxP3 expression was lost. Coincident to that loss, IFNγ production was induced. These findings are consistent with other reports that IFNγ but not IL-17 are more critical in diabetogenesis (23). In fact, polarized Th17 cells were reported to convert to Th1, IFNγ producing cells during diabetogenesis. Given that T cells from BDC2.5.CD40−/− mice did not transfer diabetes and did not lose FoxP3 expression, a mechanism for breach of tolerance involving CD40 is suggested. These data suggest a completely new consideration for tolerance dysfunction.
Acknowledgments
This work was supported by funding from the American Diabetes Association, (ADA, 1-08-CD-19) the National Institutes of Diabetes, Digestive and Kidney Disorders (NIDDK, 01-RO1DK075013-05) and the Kleberg Foundation to DHW.
References
- 1.Schwartz RH. T cell anergy. Annu Rev Immunol. 2003;21:305–334. doi: 10.1146/annurev.immunol.21.120601.141110. [DOI] [PubMed] [Google Scholar]
- 2.Wagner JDH. Reshaping the T cell repertoire: TCR editing and TCR revision for Good and for Bad. Clin Immunol. 2007;I123:1–6. doi: 10.1016/j.clim.2006.08.006. [DOI] [PubMed] [Google Scholar]
- 3.Green DR, Droin N, Pinkoski M. Activation-induced cell death in T cells. Immunol Rev. 2003;193:70–81. doi: 10.1034/j.1600-065x.2003.00051.x. [DOI] [PubMed] [Google Scholar]
- 4.Izcue A, Coombes JL, Powrie F. Regulatory T cells suppress systemic and mucosal immune activation to control intestinal inflammation. Immunol Rev. 2006;212:256–271. doi: 10.1111/j.0105-2896.2006.00423.x. [DOI] [PubMed] [Google Scholar]
- 5.Baker C, Chang L, Elsegood KA, Bishop AJ, Gannon DH, Narendran P, Leech NJ, Dayan CM. Activated T cell subsets in human type 1 diabetes: evidence for expansion of the DR+ CD30+ subpopulation in new-onset disease. Clin Exp Immunol. 2007;147:472–482. doi: 10.1111/j.1365-2249.2006.03307.x. [DOI] [PMC free article] [PubMed] [Google Scholar]
- 6.Vaitaitis GM, Poulin M, Sanderson RJ, Haskins K, Wagner DH., Jr Cutting edge: CD40-induced expression of recombination activating gene (RAG) 1 and RAG2: a mechanism for the generation of autoaggressive T cells in the periphery. J Immunol. 2003;170:3455–3459. doi: 10.4049/jimmunol.170.7.3455. [DOI] [PubMed] [Google Scholar]
- 7.Vaitaitis GM, Wagner DH., Jr High distribution of CD40 and TRAF2 in Th40 T cell rafts leads to preferential survival of this auto-aggressive population in autoimmunity. PLoS One. 2008;3:e2076. doi: 10.1371/journal.pone.0002076. [DOI] [PMC free article] [PubMed] [Google Scholar]
- 8.Wagner DH, Jr, Vaitaitis G, Sanderson R, Poulin M, Dobbs C, Haskins K. Expression of CD40 identifies a unique pathogenic T cell population in type 1 diabetes. Proc Natl Acad Sci U S A. 2002;99:3782–3787. doi: 10.1073/pnas.052247099. [DOI] [PMC free article] [PubMed] [Google Scholar]
- 9.Waid DM, Vaitaitis GM, Pennock ND, Wagner DH., Jr Disruption of the homeostatic balance between autoaggressive (CD4+CD40+) and regulatory (CD4+CD25+FoxP3+) T cells promotes diabetes. J Leukoc Biol. 2008;84:431–439. doi: 10.1189/jlb.1207857. [DOI] [PMC free article] [PubMed] [Google Scholar]
- 10.Waid DM, Vaitaitis GM, Wagner DH., Jr Peripheral CD4loCD40+ auto-aggressive T cell expansion during insulin-dependent diabetes mellitus. Eur J Immunol. 2004;34:1488–1497. doi: 10.1002/eji.200324703. [DOI] [PubMed] [Google Scholar]
- 11.Vaitaitis G, Waid DM, Wagner D., Jr The Expanding Role of TNF-Receptor Super Family Member CD40 (tnfrsf5) in Autoimmune Disease: Focus on Th40 Cells. Curr Immunol Rev. 2010;6:130–137. [Google Scholar]
- 12.Waid DM, Wagner RJ, Putnam A, Vaitaitis GM, Pennock ND, Calverley DC, Gottlieb P, Wagner DH., Jr A unique T cell subset described as CD4loCD40+ T cells (TCD40) in human type 1 diabetes. Clin Immunol. 2007;124:138–148. doi: 10.1016/j.clim.2007.05.003. [DOI] [PubMed] [Google Scholar]
- 13.Bour-Jordan H, Bluestone JA. Regulating the regulators: costimulatory signals control the homeostasis and function of regulatory T cells. Immunol Rev. 2009;229:41–66. doi: 10.1111/j.1600-065X.2009.00775.x. [DOI] [PMC free article] [PubMed] [Google Scholar]
- 14.Jaeckel E, von Boehmer H, Manns MP. Antigen-specific FoxP3-transduced T-cells can control established type 1 diabetes. Diabetes. 2005;54:306–310. doi: 10.2337/diabetes.54.2.306. [DOI] [PubMed] [Google Scholar]
- 15.Tartar DM, VanMorlan AM, Wan X, Guloglu FB, Jain R, Haymaker CL, Ellis JS, Hoeman CM, Cascio JA, Dhakal M, Oukka M, Zaghouani H. FoxP3+RORgammat+ T helper intermediates display suppressive function against autoimmune diabetes. J Immunol. 2010;184:3377–3385. doi: 10.4049/jimmunol.0903324. [DOI] [PMC free article] [PubMed] [Google Scholar]
- 16.Fontenot JD, Gavin MA, Rudensky AY. Foxp3 programs the development and function of CD4+CD25+ regulatory T cells. Nat Immunol. 2003;4:330–336. doi: 10.1038/ni904. [DOI] [PubMed] [Google Scholar]
- 17.Schubert LA, Jeffery E, Zhang Y, Ramsdell F, Ziegler SF. Scurfin (FOXP3) acts as a repressor of transcription and regulates T cell activation. J Biol Chem. 2001;276:37672–37679. doi: 10.1074/jbc.M104521200. [DOI] [PubMed] [Google Scholar]
- 18.Kasprowicz DJ, Droin N, Soper DM, Ramsdell F, Green DR, Ziegler SF. Dynamic regulation of FoxP3 expression controls the balance between CD4+ T cell activation and cell death. Eur J Immunol. 2005;35:3424–3432. doi: 10.1002/eji.200526339. [DOI] [PubMed] [Google Scholar]
- 19.Peterson JD, Pike B, McDuffie M, Haskins K. Islet-specific T cell clones transfer diabetes to nonobese diabetic (NOD) F1 mice. J Immunol. 1994;153:2800–2806. [PubMed] [Google Scholar]
- 20.Haskins K, Portas M, Bradley B, Wegmann D, Lafferty K. T-lymphocyte clone specific for pancreatic islet antigen. Diabetes. 1988;37:1444–1448. doi: 10.2337/diab.37.10.1444. [DOI] [PubMed] [Google Scholar]
- 21.You S, Slehoffer G, Barriot S, Bach JF, Chatenoud L. Unique role of CD4+CD62L+ regulatory T cells in the control of autoimmune diabetes in T cell receptor transgenic mice. Proc Natl Acad Sci U S A. 2004;101(Suppl 2):14580–14585. doi: 10.1073/pnas.0404870101. [DOI] [PMC free article] [PubMed] [Google Scholar]
- 22.Thomas DC, Mellanby RJ, Phillips JM, Cooke A. An early age-related increase in the frequency of CD4+ Foxp3+ cells in BDC2.5NOD mice. Immunology. 2007;121:565–576. doi: 10.1111/j.1365-2567.2007.02604.x. [DOI] [PMC free article] [PubMed] [Google Scholar]
- 23.Bending D, De La Pena H, Veldhoen M, Phillips JM, Uyttenhove C, Stockinger B, Cooke A. Highly purified Th17 cells from BDC2.5NOD mice convert into Th1-like cells in NOD/SCID recipient mice. J Clin Invest. 2009 doi: 10.1172/JCI37865. [DOI] [PMC free article] [PubMed] [Google Scholar]
- 24.Kawabe T, Naka T, Yoshida K, Tanaka T, Fujiwara H, Suematsu S, Yoshida N, Kishimoto T, Kikutani H. The immune responses in CD40-deficient mice: impaired immunoglobulin class switching and germinal center formation. Immunity. 1994;1:167–178. doi: 10.1016/1074-7613(94)90095-7. [DOI] [PubMed] [Google Scholar]
- 25.Dallas-Pedretti A, McDuffie M, Haskins K. A diabetes-associated T-cell autoantigen maps to a telomeric locus on mouse chromosome 6. Proc Natl Acad Sci U S A. 1995;92:1386–1390. doi: 10.1073/pnas.92.5.1386. [DOI] [PMC free article] [PubMed] [Google Scholar]
- 26.Croft M, So T, Duan W, Soroosh P. The significance of OX40 and OX40L to T-cell biology and immune disease. Immunol Rev. 2009;229:173–191. doi: 10.1111/j.1600-065X.2009.00766.x. [DOI] [PMC free article] [PubMed] [Google Scholar]
- 27.Schonbeck U, Libby P. The CD40/CD154 receptor/ligand dyad. Cell Mol Life Sci. 2001;58:4–43. doi: 10.1007/PL00000776. [DOI] [PMC free article] [PubMed] [Google Scholar]
- 28.Balasa B, Krahl T, Patstone G, Lee J, Tisch R, McDevitt HO, Sarvetnick N. CD40 Ligand-CD40 interactions are necessary for the initiation of insulitis and diabetes in nonobese diabetic mice. Journal of Immunology. 1997;159:4620–4627. [PubMed] [Google Scholar]
- 29.Williams MA, Holmes BJ, Sun JC, Bevan MJ. Developing and maintaining protective CD8+ memory T cells. Immunol Rev. 2006;211:146–153. doi: 10.1111/j.0105-2896.2006.00389.x. [DOI] [PubMed] [Google Scholar]
- 30.Herman AE, Freeman GJ, Mathis D, Benoist C. CD4+CD25+ T regulatory cells dependent on ICOS promote regulation of effector cells in the prediabetic lesion. J Exp Med. 2004;199:1479–1489. doi: 10.1084/jem.20040179. [DOI] [PMC free article] [PubMed] [Google Scholar]
- 31.Trembleau S, Penna G, Gregori S, Magistrelli G, Isacchi A, Adorini L. Early Th1 response in unprimed nonobese diabetic mice to the tyrosine phosphatase-like insulinoma-associated protein 2, an autoantigen in type 1 diabetes. J Immunol. 2000;165:6748–6755. doi: 10.4049/jimmunol.165.12.6748. [DOI] [PubMed] [Google Scholar]
- 32.Siebert JC, Inokuma M, Waid DM, Pennock ND, Vaitaitis GM, Disis ML, Dunne JF, Wagner DH, Jr, Maecker HT. An analytical workflow for investigating cytokine profiles. Cytometry A. 2008;73:289–298. doi: 10.1002/cyto.a.20509. [DOI] [PubMed] [Google Scholar]
- 33.Vaitaitis G, Wagner DH., Jr CD40 Glycoforms and TNF-Receptors 1 and 2 in the Formation of CD40 Receptor(s) in Autoimmunity. Mol Immunol. 2010;47:2303–2313. doi: 10.1016/j.molimm.2010.05.288. [DOI] [PMC free article] [PubMed] [Google Scholar]
- 34.Carter J, Vaitaitis GM, Waid DM, Wagner DH. CD40 engagement of CD4(+) CD40(+) T cells in a neo-self antigen disease model ablates CTLA-4 expression and indirectly impacts tolerance. Eur J Immunol. 2012;42:424–435. doi: 10.1002/eji.201141880. [DOI] [PubMed] [Google Scholar]
- 35.Korthauer U, Graf D, Mages HW, Briere F, Padayachee M, Malcolm S, Ugazio AG, Notarangelo LD, Levinsky RJ, Kroczek RA. Defective expression of T-cell CD40 ligand causes X-linked immunodeficiency with hyper-IgM. Nature. 1993;361:539–541. doi: 10.1038/361539a0. [DOI] [PubMed] [Google Scholar]
- 36.Alderson MR, Armitage RJ, Tough TW, Strockbine L, Fanslow WC, Spriggs MK. CD40 expression by human monocytes: regulation by cytokines and activation of monocytes by the ligand for CD40. Journal of Experimental Medicine. 1993;178:669–674. doi: 10.1084/jem.178.2.669. [DOI] [PMC free article] [PubMed] [Google Scholar]
- 37.Baker RL, Wagner DH, Jr, Haskins K. CD40 on NOD CD4 T cells contributes to their activation and pathogenicity. J Autoimmun. 2008;31:385–392. doi: 10.1016/j.jaut.2008.09.001. [DOI] [PubMed] [Google Scholar]
- 38.Munroe ME, Bishop GA. A costimulatory function for T cell CD40. Journal of Immunology. 2007;178:671–682. doi: 10.4049/jimmunol.178.2.671. [DOI] [PubMed] [Google Scholar]
- 39.Stadinski BD, Delong T, Reisdorph N, Reisdorph R, Powell RL, Armstrong M, Piganelli JD, Barbour G, Bradley B, Crawford F, Marrack P, Mahata SK, Kappler JW, Haskins K. Chromogranin A is an autoantigen in type 1 diabetes. Nat Immunol. 11:225–231. doi: 10.1038/ni.1844. [DOI] [PMC free article] [PubMed] [Google Scholar]
- 40.You S, Belghith M, Cobbold S, Alyanakian MA, Gouarin C, Barriot S, Garcia C, Waldmann H, Bach JF, Chatenoud L. Autoimmune diabetes onset results from qualitative rather than quantitative age-dependent changes in pathogenic T-cells. Diabetes. 2005;54:1415–1422. doi: 10.2337/diabetes.54.5.1415. [DOI] [PubMed] [Google Scholar]
- 41.Alyanakian MA, You S, Damotte D, Gouarin C, Esling A, Garcia C, Havouis S, Chatenoud L, Bach JF. Diversity of regulatory CD4+T cells controlling distinct organ-specific autoimmune diseases. Proc Natl Acad Sci U S A. 2003;100:15806–15811. doi: 10.1073/pnas.2636971100. [DOI] [PMC free article] [PubMed] [Google Scholar]
- 42.Kim CH. FOXP3 and its role in the immune system. Adv Exp Med Biol. 2009;665:17–29. doi: 10.1007/978-1-4419-1599-3_2. [DOI] [PubMed] [Google Scholar]