

SUMMARY
Background
Graves’ disease (GD) is associated with hyperthyroidism. Thyrotoxicosis adversely affects multiple organ systems including hematopoiesis. Anemia occurring specifically in GD has not been systematically studied previously.
Objective
To define the prevalence and characteristics of the anemia associated with GD.
Design
Eighty Seven newly diagnosed patients with GD were recruited. Hematologic indices, thyroid function and inflammatory parameters were examined at presentation and following successful treatment.
Setting
Tertiary care academic referral center.
Results
Thirty three percent of subjects presented with anemia. The prevalence of anemia not attributable to other causes (GD anemia) was 22%. GD anemia affected 41.6% (10/24) of men compared to 17.5% of women (11/63). Mean EPO levels (15.5 ± 5.3 mIU/ml) were within normal reference limits but significantly higher (P=0.004) than those of the non-anemic controls. Hgb correlated inversely with EPO (P=0.05) and CRP (P=0.04) levels, a relationship that persisted after multivariate adjustment for TT3 or TT4. With antithyroid therapy for 16 ± 6.3 weeks, Hgb levels normalized in 8/9 subjects with GD anemia (10.7 ± 0.8 g/dl to 13.5 ± 1.3 g/dl, P=0.0001). After correction of Hgb, mean MCV and TIBC were significantly increased and median ferritin and mean Epo were significantly decreased.
Conclusions
GD anemia is common, resembles the anemia of chronic disease and is associated with markers of inflammation. It corrects promptly with the return to the euthyroid state following treatment.
Keywords: anemia, autoimmune, Graves’ disease, thyrotoxicosis
INTRODUCTION
Graves’ disease (GD) is an autoimmune disease associated with hyperthyroidism. Its prevalence is estimated to be 2.5% among women and 0.23% among men 1. Both thyrotoxicosis and the underlying autoimmunity of GD affect multiple tissues and their functions, including hematopoesis 2, 3. An association between thyrotoxicosis and anemia has been reported previously but the mechanisms involved remain poorly understood. Alterations in erythrocytes purported in thyrotoxicosis are sometimes contradictory and include increased erythropoeisis and red cell mass, abnormal iron incorporation, 2,3-DPG levels, Hgb, shortened erythrocyte survival, and ineffective iron utilization 2, 3. Anemia associated specifically with GD has not been studied previously in a prospective manner utilizing a large cohort. Anemia associated with chronic disease or inflammation is commonly seen in malignant, infectious, and autoimmune conditions 4. It can occur within days of illness onset and its pathogenesis may result from the actions of cytokines 5. Ford and Carter suggested that the hematologic changes associated with thyrotoxicosis might relate to the underlying immunologic disturbance in GD 2.
Here we report a novel study that for the first time examines in a prospective and adequately powered manner the prevalence of anemia in subjects newly diagnosed with GD, including kinetics of its reversal following resolution of thyrotoxicosis. Our findings disclose that the anemia is not only related to thyroid hormone excess but is also associated with markers of inflammation.
METHODS
Study subjects
Patients who presented to the endocrine clinic at Harbor-UCLA Medical Center with newly diagnosed GD were enrolled after obtaining informed consent, as approved by the Institutional Review Board. The diagnosis was established on the basis of standard clinical and laboratory criteria. Subjects were included if they were already treated with ß-blockers but were excluded if thionamides or corticosteroid therapy had been initiated. Ninety-eight patients were prospectively screened and enrolled. Of these 98 subjects, 1 patient manifested “silent” thyroiditis, 2 were euthyroid, and 8 failed to undergo a complete blood count (CBC) and were therefore excluded. The remaining 87 subjects comprise the study group. Of these 87 subjects, 64 were unselected, and newly diagnosed with GD who presented consecutively. The remaining 23 subjects were selected because they were newly-diagnosed with the combination of GD and anemia. The study group was divided into those presenting with anemia (Group A) and those with normal RBC mass (Group B). Table 1 contains patient characteristics at presentation. Euthyroidism was achieved with thionamide therapy alone or in combination with radioactive iodine treatment or surgical thyroidectomy followed by thyroid hormone replacement. A group of control subjects (10 females and 9 males) without hyperthyroidism or any known autoimmune disease, presented for a routine health visit. They were randomly recruited from the primary care clinic, and were utilized for comparison of hematologic parameters with those of patients with GD.
Table 1.
Patient characteristics
| N=87 | ||
|---|---|---|
|
| ||
| Group A (Anemic) | Group B (Non-Anemic) | |
|
| ||
| N (%) | 31 (36) | 56 (64) |
|
| ||
| Sex: | ||
| Male | 12 | 12 |
|
| ||
| Female | 19 | 44 |
|
| ||
| Mean age (yr) (range) | 37 (19-53) | 36 (19-63) |
Laboratory investigation
C-reactive protein (CRP) levels were measured using the ROCHE COBAS MIRA S analyzer and CRP reagent kit (Cat.# 999-27001) and calibrator set (Cat.# 997-27041) from Wako Chemicals (Richmond, VA). Erythropoetin (EPO) levels were measured by Quest Diagnostics (San Juan Capistrano, CA) utilizing a chemiluminescent immunoassay by Diagnostic Product Corporation (Los Angeles, CA).
Statistical analysis
All continuous measurements except ferritin are summarized as mean ± standard deviation and compared between groups with 2-sided t-tests. Due to its skewed distribution, ferritin is summarized with quartiles and compared between groups with Kruskal-Wallis tests. Percentages are compared between groups with Fisher’s exact tests. Pearson correlations are used to measure associations between continuous measurements. Multivariate adjustment for group differences in means and for correlations is made using multiple regression. Due to skewness in some measures, non-parametric Spearman correlations were also calculated and provided the same conclusions as Pearson correlations. A data analysis plan, including statistical methods and specification of all measurements to be examined was developed prior to data analysis. All of these are included in this report. A 0.05 level of significance is used without mathematical correction for multiple comparisons. The study includes a sufficient number of subjects to provide (1) a margin of error on the estimate of prevalence of anemia in GD patients to be no greater than ±15%, and (2) 80% power to detect a shift in the distribution of any characteristic in anemia patients that is at least 15% of the reference range for non-anemic GD patients.
RESULTS
Prevalence of anemia at presentation
Of the 87 GD subjects comprising the study group, 64 were unselected and consecutively enrolled and are used to establish the prevalence of anemia in our population. Forty-five of 64 (70.3%) subjects were female with a mean age of 37.5±11.3 yr (mean ± SD). Twenty-one of 64 (33%) were anemic. The diagnosis of anemia was established based on Hgb levels below the lower limit of the reference range for our assay (females 11.9-14.9 /dl, males 13.9-16.9 g/dl). Of these 21 subjects, a secondary cause of anemia could be established in 7 patients. Therefore, the prevalence of anemia without an obvious secondary cause (GD anemia) was 14/64 (21.9% [95% CI: 12.5% to 34.0%]).
Characterization of anemia at presentation
Thirty-one patients presented with anemia, having a mean Hgb of 11.3 ± 1.2 g/dl. Another cause could be identified in 10 of these 31 patients. Seven were iron-deficient, 1 carried the diagnosis of thalassemia minor, 1 with hereditary hemochromatosis, and another with coincident rheumatoid arthritis and anemia of chronic disease. We focused on the 21 subjects with GD anemia (Hgb 11.6 ± 1.2 g/dl) (Table 2) in which no other cause could be identified by history, physical exam, blood chemistries, or hematologic assessment. The mean MCV was 80.3 fL ± 3.8, slightly below the lower limits of normal (females < 81.5, males < 82.2 fL). Median ferritin, mean TIBC, and EPO levels (15.5 ± 5.3 mIU/ml, reference range 4.1-19.5 mIU/ml) were within normal reference limits. However, these EPO levels are inappropriately low for subjects with anemia. By comparison, anemic patients with a secondary cause (n=10) presented with a Hgb of 10.6±1.0 g/dl, MCV 74.4 fL ±12.1, median ferritin 14 ng/ml, TIBC 366 μg/dl ±115.3 and EPO 101.7 mIU/ml ±203.1 (Table 2). Interestingly, while 80% (8/10) of patients presenting with secondary anemia were female, the distribution of males and females was nearly equivalent among those with GD anemia (48% vs 52%). Males comprised only 28% (24/87) of the overall cohort. Thus GD anemia affected 41.6% (10/24) of men presenting with autoimmune hyperthyroidism compared to 17.5% of women (11/63). The 56 patients from Group B who presented without anemia exhibited Hgb concentrations of 13.5 ± 1.0 g/dl while MCV, TIBC, ferritin and EPO levels were within normal limits (Table 2).
Table 2.
Thyroid and hematologic parameters of study subjects at presentation
| Anemic
|
Non-Anemic | †P-value | |||
|---|---|---|---|---|---|
| All | Anemia with 2nd cause | GD Anemia | |||
|
| |||||
| N | 31 | 10 | 21 | 56 | |
| Age | 37 | 40 | 35 | 35 | |
| mean (range) | (19-53) | (20-50) | (19-53) | (19-63) | |
| Sex: Male | 12 | 2 | 10 | 12 | |
| Female | 19 | 8 | 11 | 44 | |
|
| |||||
|
Mean±SD
| |||||
| Hgb (g/dl) | 11.3±1.2 | 10.6±1.0 | 11.6±1.2 | 13.5±1.0 | - |
| MCV (fL) | 78.4±7.8 | 74.4±12.1 | 80.3±3.8 | 81.9±5.3 | 0.22 |
| Ferritin (11-306ng/ml)* | 90 (35-219) | 14 (4-84) | 133 (77-293) | 87 (43-193) | 0.09 |
| TIBC (245-400μg/dl) | 308±88.6 | 366.1±115.3 | 277.7±52.1 | 349±58 | <0.0001 |
| EPO (4.1-19.5 mIU/ml) | 45.3±122.5 | 101.7±203.1 | 15.5±5.3 | 11.4±5 | 0.004 |
| TT4 (6.1-12.2 μg/dl) | 24.3±8.6 | 21.4±5.9 | 26.1±9.6 | 20.4±7.6 | 0.02 |
| TT3 (79-149 ng/dl) | 557±315 | 479±266 | 606±341 | 497±275 | 0.20 |
| CRP (0.5-3.0 mg/L) | 4.9±5.5 | 3.9±5.3 | 5.5±5.6 | 2.7±4.9 | 0.07 |
|
| |||||
|
% positive
| |||||
| TSIG (%+) | 26/29=90% | 8/10=80% | 18/19=95% | 45/55=82% | 0.27 |
| Anti-TPO (IU/ml) | 26/29=90% | 9/10=90% | 17/19=89% | 50/54=93% | 0.65 |
| Anti-Tg (IU/ml) | 22/29=76% | 8/10=80% | 14/19=74% | 28/51=55% | 0.18 |
Comparison between GD anemic and Non-Anemic subjects
Median (1st – 3rd Quartiles)
We next compared the 21 GD anemic patients with those 56 without anemia with regard to MCV, ferritin, TIBC and EPO levels (Table 2). While mean MCV did not differ between the two groups, those presenting with GD anemia exhibited significantly lower mean TIBC (p<0.0001) and higher mean EPO (P=0.004) levels. Interestingly, the GD anemia group exhibited marginally higher ferritin levels, although not achieving statistical significance (P=0.09).
Correlation of GD anemia at presentation with thyroid hormone, anti-thyroid Ab, and inflammatory marker levels
When comparing thyroid hormone levels and anti-thyroid Ab status [anti-thyroid peroxidase (anti-TPO), anti-thyroglobulin (anti-TG), thyroid stimulating immunoglobulin (TSI)] in the two groups, GD anemic and non-anemic subjects differed only with regard to TT4 (26.1 ± 9.6 μg/dl vs 20.4 ± 7.6 μg/dl, P= 0.02), as shown in Table 2.
We then examined CRP and ferritin, markers of inflammation, in the two groups. Mean CRP (5.5 ± 5.6 mg/dl vs 2.7 ± 4.9 mg/dl) and median ferritin levels (133 vs. 87) were substantially but not significantly higher in the GD anemic group (P=0.07 and P=0.09 respectively, Table 2). Since no correlation was observed between CRP and thyroid hormone levels (P>0.85), group differences for CRP were essentially unchanged in multivariate analyses that adjusted for T3 (P=0.04) or for TT4 (P=0.08).
Correlation at presentation of Hgb with thyroid hormone, anti-thyroid Ab, and inflammatory marker levels
TT4, TT3, and CRP levels as well as the presence of anti-thyroid Abs were also examined for associations with levels of Hgb in the combined group of GD anemic and non-anemic subjects (Table 3). TT4 and TT3 levels at presentation were not significantly correlated with Hgb levels (Table 3, Fig. 1A). Hgb correlated inversely with CRP (Table 3, Fig. 1B) and remained so after multivariate adjustment for TT3 or TT4, but Hgb was not correlated with ferritin levels (Table 3). TIBC correlated positively (P=0.0005) while EPO levels correlated inversely (P=0.05) and this relationship remained essentially unchanged after multivariate adjustment for TT3 (P=0.004 and P=0.05, respectively) and TT4 (P=0.01 and P=0.06, respectively). The presence of anti-thyroid Abs (anti-TPO, anti-TG and TSI) failed to correlate with Hgb levels at presentation (data not shown).
Table 3.
Correlation of Hgb levels with other parameters at presentation
| GD Anemia and Non-Anemic
|
P-value | |||
|---|---|---|---|---|
| N | Range | Correlation | ||
|
| ||||
| TT4 | 67 | 7.1 – 49.3 | -0.19 | 0.11 |
| TT3 | 66 | 59.2 – 1282 | -0.05 | 0.67 |
| Ferritin | 70 | 12.1 – 1085 | -0.09 | 0.45 |
| CRP | 64 | 0.12 – 31.3 | -0.26 | 0.04 |
| EPO | 73 | 3.4 – 57.0 | -0.23 | 0.05 |
| TIBC | 70 | 201 – 489 | 0.40 | 0.0005 |
Fig 1. Correlation between Hgb and TT4, TT3 and CRP levels at presentation.
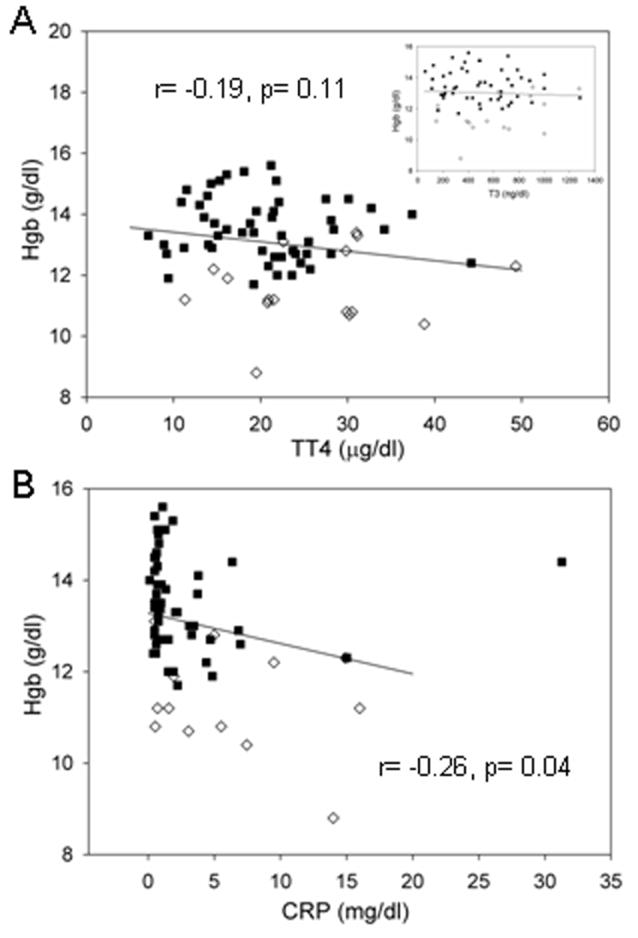
Scatter plot 1A displays the Pearson correlation (Spearman correlation= -0.19, P=0.12) between Hgb and TT4 levels [T3 in insert] in GD anemic (◇) and non-anemic (■) subjects. The Pearson correlation between Hgb and CRP levels in these subjects is displayed in scatter plot 1B. [Spearman correlation= -0.38, P=.002].
Impact of restoration to the euthyroid state on hematologic parameters
Hematologic parameters were examined at the time subjects first became euthyroid, as was established by normalization of TT4 and/or TT3. Fourteen previously anemic (9 with GD anemia and 5 with a secondary cause) subjects who became euthyroid within 26 weeks of initial presentation and 36 non-anemic patients were included in this analysis. Of the 14 anemic subjects, 10 were treated with anti-thyroid medications alone while 4 received radioactive iodine in addition. Subjects received no additional therapy for their anemia. Interestingly, Hgb levels normalized in 8/9 subjects with GD anemia (10.7±0.8 g/dl to 13.5±1.3 g/dl, P=0.0001). The mean Hgb level achieved post euthyroidism in these 8 subjects (7 female, 1 male) was 13.6 ± 0.73 g/dl for females and 15.5 g/dl in the male. These levels are comparable to those found in control subjects without hyperthyroidism or autoimmune disease [13.8± 0.65 g/dl, range=12.6-14.8 g/dl (females), 15.2± 1.08 g/dl, range=13.6-16.9 g/dl (males)]. Hgb levels increased more modestly in the 5 subjects with secondary cause-associated anemia, changes that failed to reach statistical significance (10.4±1.3 g/dl to 11.6±1.9 g/dl P=0.08) (Table 4). In contrast to those with GD anemia, those with secondary anemia failed to correct (8/9 vs 0/5, P=0.003). After GD anemia subjects increased their Hgb, their mean MCV and TIBC were significantly increased and their median ferritin and mean Epo were significantly decreased (Table 4). Hemograms were also performed on 36 non-anemic patients once they became euthyroid. Compared to those with GD anemia, the non-anemic subjects manifested a small but statistically significant increase in Hgb (0.36 ±0.9 g/dl P=0.02) and MCV (3.97 ±3.2 fL p<0.0001) (Table 4). Decreasing TT4 and TT3 levels following treatment correlated with increasing Hgb in the combined group of GD anemic and non-anemic subjects (Table 4, Fig 2A). A similar inverse correlation existed between changes in Hgb and EPO levels (r= -0.48, P=0.04). TT4 and TT3 levels were coupled to those of Hgb over short time intervals. Intermittently compliant subjects exhibited excursions in their Hgb levels coinciding with changing TT3 levels (Figure 3).
Table 4.
Change in hematologic parameters during restoration of euthyroid state
| Anemia with 2nd cause | GD Anemia | †P-value | Non-Anemic | |
|---|---|---|---|---|
|
| ||||
| N | 5 | 9 | 36 | |
|
| ||||
| Weeks | 13.4±4 | 16±6.3 | 0.43 | |
|
| ||||
| Hgb (g/dl) | ||||
| Initial | 10.4±1.3 | 10.7±0.8 | 13.3±1.0 | |
| Euthyroid | 11.6±1.9 | 13.5±1.3 | 13.7±0.4 | |
| Change | 1.4±1.3 | 2.8±1.3 | 0.07 | 0.36±0.9 |
|
| ||||
| MCV (fL) | ||||
| Initial | 78.1±15.6 | 80.3±2.9 | 81.3±4.4 | |
| Euthyroid | 79.6±16.2 | 83.6±3.9 | 85.2±4.4 | |
| Change | 1.5±2.9 | 3.2±1.9 | 0.19 | 4.0 ±3.2 |
|
| ||||
| Ferritin (ng/ml)* | ||||
| Initial | 61 (17-593) | 176 (114-450) | ||
| Euthyroid | 10 (7-431) | 20 (14-28) | ||
| Change | -54 (-165- -8) | -155 (-426- -98) | 0.14 | |
|
| ||||
| TIBC (μg/dl) | ||||
| Initial | 296±86.1 | 247.6±49.8 | ||
| Euthyroid | 410.3±124.5 | 328.3±67.3 | ||
| Change | 114.3±49.2 | 96.8±71.7 | 0.72 | |
|
| ||||
| EPO (mIU/ml) | ||||
| Initial | 168.2±284.1 | 16.3±5.2 | ||
| Euthyroid | 28.1±13.3 | 12.5±5.8 | ||
| Change | -140.1±282.8 | -3.7±4.3 | 0.33 | |
|
| ||||
| Hgb normalization | 0/5 =0% | 8/9 =89% | 0.003 | |
With the exception of ferritin, results are expressed as mean±SD
Median (1st – 3rd Quartiles)
Comparison between GD anemia and anemia with secondary cause
Fig 2. Correlation between changes in Hgb and TT4, TT3 and CRP levels following successful therapy.
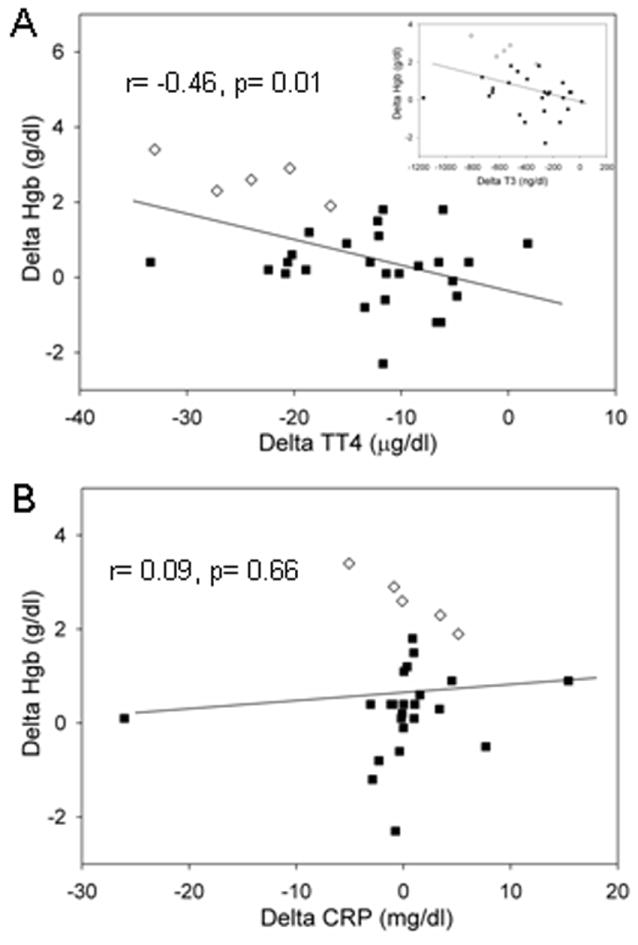
Scatter plot 2A displays the Pearson correlation (Spearman correlation= -0.42, P=0.02) between change (delta) in Hgb and TT4 levels [T3 in insert] of GD anemic (◇) and non-anemic (■) subjects. Scatter plot B displays the Pearson correlation (Spearman correlation= 0.25, P=0.20) between change (delta) in Hgb and CRP levels in these subjects.
Fig 3. Hgb levels correlate inversely with thyroid hormone levels.
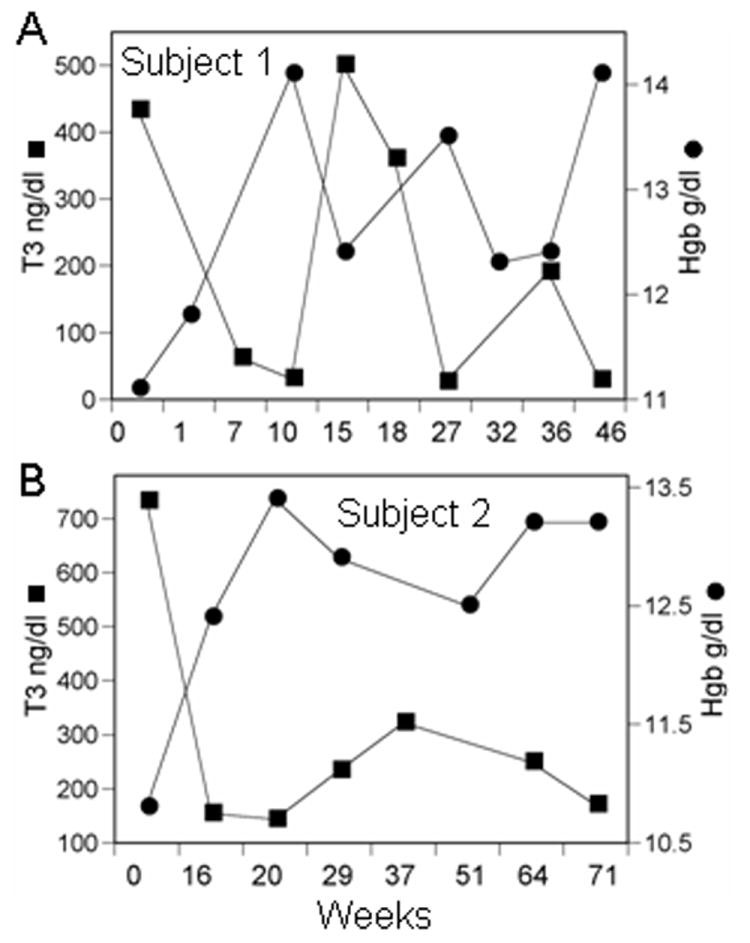
Panel A and B contain data from two newly diagnosed subjects presenting with GD anemia. The Hgb and TT3 levels are plotted along the ordinate and time (weeks) along the abscissa. TT3 levels fluctuated widely in these subjects as a consequence of intermittent compliance and were mirrored by coincident changes in Hgb.
No correlation was found between changes in Hgb and changes in CRP levels (Fig. 2B). Note in Fig 2B that although the 5 GD anemic subjects exhibited a remarkably strong association, only the patient with the greatest Hgb increase showed substantial CRP decrease. One non-anemic subject had an anomalous CRP of 31 mg/dl at presentation.
Treatment with antithyroid drugs
Thirty patients with anemia at presentation received antithyroid medication. They received either methimazole or propylthiouracil, with daily doses ranging from 2.5-40 mg and 50-600 mg, respectively. In none of these patients did either drug worsen hematologic parameters. CBC’s were available for 14 previously anemic patients who had achieved euthyroidy. Mean Hgb improved from 10.6 g/dl ±1.0 to 12.8 g/dl ±1.8 (P=0.0001). Only 1/14 of these patients exhibited worsening of their anemia (0.8 decrease in Hgb) while treated with anti-thyroid medication.
DISCUSSION
Here we studied 87 newly diagnosed patients with GD and found the overall prevalence of anemia to be 33%, a finding congruent with previous reports 6-8. These earlier studies included hyperthyroidism from several different etiologies and were either small or retrospective. GD is substantially more frequent among females of childbearing age. Our cohort reflects this gender and age distribution. Interestingly, and for unclear reasons, men presented more frequently with GD anemia among our study subjects. GD anemia resembled that associated with chronic disease. Normalization of Hgb following treatment of thyrotoxicosis was accompanied by increases in MCV and TIBC while ferritin and EPO levels decreased. This correction occurred within a median of 16 weeks from initiation of anti-thyroid therapy and correlated with normalizing TT4, TT3 and TSH levels. GD anemia corrected in 8/9 (89%) patients but in none of those with secondary anemia. Agranulocytosis and pancytopenia can complicate thionamide therapy 9, 10. Fourteen anemic subjects in this study were treated with thionamides. After correction of hyperthyroidism, Hgb levels improved in all but one. Thus, thionamides may be safely administered to patients presenting with anemia and autoimmune hyperthyroidism with periodic monitoring of CBC.
Thyroid hormone stimulates erythropoiesis leading to marrow erythroid hyperplasia and an increased red cell mass 2, 3. The mechanisms underlying these actions remain unclear but evidence for both direct 11 and indirect effects on erythroid precursors 12, 13 have been reported. The hormones may increase Epo levels directly 13 or through increased oxygen demand 2. Das et al studied 21 patients with hyperthyroidism of which 5 were anemic 6. The authors found increased erythropoesis with erythrocytosis and elevated serum Epo levels in these patients. They concluded that Epo provoked these effects. However, in a rodent model, both LT3 and its calorigenically inactive isomer, DT3, increased erythrocyte iron utilization while only LT3 stimulated oxygen consumption 14. Thus, the calorigenic and erythropoetic actions of thyroid hormone may be uncoupled. Thyroxine promotes heme synthesis and degradation in liver, 15-18. It shifts the Hgb dissociation curve to the right 2, facilitating tissue oxygen delivery, suggesting that a secondary elevation of Epo may not represent the sole compensatory mechanism. In our study, patients with GD anemia presented with Epo levels within the normal range (Table 2). These were reduced following correction of thyrotoxicosis and correlated inversely with increasing Hgb levels. Thus, relatively modest changes in Epo levels which remain within the normal range might impose biologically important consequences in red cell mass. Another indirect effect of thyroid hormone on erythropoesis is mediated through release of erythroid specific stimulating factors from mononuclear cells 12. T4 may also act directly on erythrocyte precursors through a receptor with β2-adrenergic properties that can be blocked by β-blockers 19, 20. At the time of enrollment, approximately 50% of non-anemic and 76% of anemic patients in our cohort were treated with β-blockers. It is possible that these agents might have played some role in their development of anemia. Another finding of interest was the higher CRP level associated with GD anemia and with lower Hgb levels at presentation. While the implications of this finding to the underlying pathogenesis of GD anemia remain uncertain, it suggests the possibility that some aspect of the inflammation driving the thyroid disease may also influence erythropoesis in addition to the effects of thyrotoxicosis.
Despite the erythropoetic effects of thyroid hormone, most patients with thyrotoxicosis present with normal levels of Hgb. Blood volume is increased in hyperthyroidism by approximately 6% 21 and this may serve to partially counterbalance the erythropoesis induced by thyrotoxicosis. Furthermore, red cell life span may be shortened 2, 3, 22 and some thyrotoxic patients may exhibit ineffective erythropoesis 23, 24. Thyroxine may also influence iron incorporation into red cells but previous findings conflict 14, 23, 24. Why a subset of patients with hyperthyroidism, as in our cohort, should develop anemia is not understood. Some authors have suggested a “suppressive effect” 8, 25 of supra-physiologic doses of thyroid hormone on erythropoesis. Others have postulated a contribution of secondary causes 6 including autoimmune associated vitamin B12 and iron deficiency 26. In our cohort only 10/31 (32.3%) anemic GD patients exhibited a secondary cause. Rivlin et al suggested that anemia occurred more frequently in patients whose hyperthyroidism was unusually severe or protracted 24, while Axelrod and colleagues found no such relationship 27. We did not observe a correlation between degree of hyperthyroidism and Hgb that ranged over normal and anemic levels, but newly diagnosed GD anemic subjects did present with higher mean TT4 than non-anemic subjects. It remains possible that thyrotoxicosis uniformly decreases Hgb in all subjects but relatively few become anemic. Nightingale et. al. found that Hgb levels of 131 non-anemic hyperthyroid patients increased 0.5g/dl (P<0.01) after up to 4 years following treatment 7. Similarly, J. How et. al. reported a 0.68 g/dl (p<0.01) increase in 44 non-anemic hyperthyroid females after therapy 28. We too detected a significant Hgb increase of 0.36g/dl after correction of hyperthyroidism in our non-anemic cohort.
Table 5.
Correlation of Hgb change to change in other parameters during restoration of euthyroid state.
| GD Anemia and Non-Anemia
|
|||
|---|---|---|---|
| N | Range | Correlation / P-value | |
|
| |||
| TT4 | 31 | -33.4 to 1.8 | -0.46/0.01 |
| TT3 | 30 | -1166 to 12.8 | -0.38/0.04 |
| Ferritin | 7 | -544 to -50.8 | -0.31/0.49 |
| CRP | 28 | -26 to 15.4 | 0.09/0.66 |
| EPO | 19 | -13.2 to 16.4 | -0.48/0.04 |
| TIBC | 7 | -103 to 185 | 0.75/0.05 |
Acknowledgments
We are indebted to the Harbor-UCLA General Clinical Research Center for assistance with patient recruitment and sample processing. We thank Debbie Hanaya for her assistance with preparation of the manuscript. This work was supported in part by the National Institutes of Health Grants K23 RR017304, M01 RR00425, EY008976, EY011708, and DK063121.
References
- 1.Tunbridge WM, Evered DC, Hall R, Appleton D, Brewis M, Clark F, Evans JG, Young E, Bird T, Smith PA. The spectrum of thyroid disease in a community: the Whickham survey. Clinical Endocrinology (Oxf) 1977;7:481–493. doi: 10.1111/j.1365-2265.1977.tb01340.x. [DOI] [PubMed] [Google Scholar]
- 2.Ford HC, Carter JM. The haematology of hyperthyroidism: abnormalities of erythrocytes, leucocytes, thrombocytes and haemostasis. Postgraduate Medical Journal. 1988;64:735–742. doi: 10.1136/pgmj.64.756.735. [DOI] [PMC free article] [PubMed] [Google Scholar]
- 3.Singh V, Catlett JP. Hematologic Manifestations of Thyroid Disease. The Endocrinologist. 1998;8:87–91. [Google Scholar]
- 4.Cartwright GE. The anemia of chronic disorders. Seminars in Hematology. 1966;3:351–375. [PubMed] [Google Scholar]
- 5.Ganz T. Molecular pathogenesis of anemia of chronic disease. Pediatric Blood Cancer. 2006;46:554–557. doi: 10.1002/pbc.20656. [DOI] [PubMed] [Google Scholar]
- 6.Das KC, Mukherjee M, Sarkar TK, Dash RJ, Rastogi GK. Erythropoiesis and erythropoietin in hypo- and hyperthyroidism. Journal of Clinical Endocrinology and Metabolism. 1975;40:211–220. doi: 10.1210/jcem-40-2-211. [DOI] [PubMed] [Google Scholar]
- 7.Nightingale S, Vitek PJ, Himsworth RL. The haematology of hyperthyroidism. Quarterly Journal of Medicine. 1978;47:35–47. [PubMed] [Google Scholar]
- 8.Perlman JA, Sternthal PM. Effect of 131I on the anemia of hyperthyroidism. Journal of Chronic Diseases. 1983;36:405–412. doi: 10.1016/0021-9681(83)90173-x. [DOI] [PubMed] [Google Scholar]
- 9.Cooper DS. Antithyroid drugs. New England Journal of Medicine. 2005;352:905–917. doi: 10.1056/NEJMra042972. [DOI] [PubMed] [Google Scholar]
- 10.Lima CS, Zantut Wittmann DE, Castro V, Tambascia MA, Lorand-Metze I, Saad ST, Costa FF. Pancytopenia in untreated patients with Graves’ disease. Thyroid. 2006;16:403–409. doi: 10.1089/thy.2006.16.403. [DOI] [PubMed] [Google Scholar]
- 11.Golde DW, Bersch N, Chopra IJ, Cline MJ. Thyroid hormones stimulate erythropoiesis in vitro. British Journal of Haematology. 1977;37:173–177. doi: 10.1111/j.1365-2141.1977.tb06833.x. [DOI] [PubMed] [Google Scholar]
- 12.Dainiak N, Sutter D, Kreczko S. L-triiodothyronine augments erythropoietic growth factor release from peripheral blood and bone marrow leukocytes. Blood. 1986;68:1289–1297. [PubMed] [Google Scholar]
- 13.Fandrey J, Pagel H, Frede S, Wolff M, Jelkmann W. Thyroid hormones enhance hypoxia-induced erythropoietin production in vitro. Experimental Hematology. 1994;22:272–277. [PubMed] [Google Scholar]
- 14.Donati RM, Warnecke MA, Gallagher NI. Ferrokinetics in hyperthyroidism. Annals of Internal Medicine. 1965;63:945–950. doi: 10.7326/0003-4819-63-6-945. [DOI] [PubMed] [Google Scholar]
- 15.Donati RM, Gallagher NI. Hematologic alteration associated with endocrine disease. Medical Clinics of North America. 1968;52:231–241. [PubMed] [Google Scholar]
- 16.Fuhr JE, Dunn CD. Control of hemoglobin synthesis in fetal erythroid cells by L-thyroxine. American Journal of Hematology. 1978;5:163–168. doi: 10.1002/ajh.2830050213. [DOI] [PubMed] [Google Scholar]
- 17.Smith TJ, Drummond GS. Thyroid hormone regulation of heme synthesis in rat liver. Endocrinology. 1988;122:1964–1967. doi: 10.1210/endo-122-5-1964. [DOI] [PubMed] [Google Scholar]
- 18.Smith TJ, Drummond GS, Kourides IA, Kappas A. Thyroid hormone regulation of heme oxidation in the liver. Proceedings of the National Academy of Sciences of the United States of America. 1982;79:7537–7541. doi: 10.1073/pnas.79.23.7537. [DOI] [PMC free article] [PubMed] [Google Scholar]
- 19.Dainiak N, Hoffman R, Maffei LA, Forget BG. Potentiation of human erythropoiesis in vitro by thyroid hormone. Nature. 1978;272:260–262. doi: 10.1038/272260a0. [DOI] [PubMed] [Google Scholar]
- 20.Popovic WJ, Brown JE, Adamson JW. The influence of thyroid hormones on in vitro erythropoiesis. Mediation by a receptor with beta adrenergic properties. Journal of Clinical Investigation. 1977;60:907–913. doi: 10.1172/JCI108845. [DOI] [PMC free article] [PubMed] [Google Scholar]
- 21.Gibson JG, Harris AW. Clinical Studies Of The Blood Volume. V. Hyperthyroidism And Myxedema. Journal of Clinical Investigation. 1939;18:59–65. doi: 10.1172/JCI101026. [DOI] [PMC free article] [PubMed] [Google Scholar]
- 22.McClellan JE, Donegan C, Thorup OA, Leavell BS. Survival time of the erythrocyte in myxedema and hyperthyroidism. Journal of Laboratory and Clinical Medicine. 1958;51:91–96. [PubMed] [Google Scholar]
- 23.Lahtinen R. Sideroblasts and haemosiderin in thyrotoxicosis. Scandinavian Journal of Haematology. 1980;25:237–243. doi: 10.1111/j.1600-0609.1981.tb01395.x. [DOI] [PubMed] [Google Scholar]
- 24.Rivlin RS, Wagner HN., Jr Anemia in hyperthyroidism. Annals of Internal Medicine. 1969;70:507–516. doi: 10.7326/0003-4819-70-3-507. [DOI] [PubMed] [Google Scholar]
- 25.Reddy J, Brownlie BE, Heaton DC, Hamer JW, Turner JG. The peripheral blood picture in thyrotoxicosis. New Zealand Medical Journal. 1981;93:143–145. [PubMed] [Google Scholar]
- 26.Centanni M, Marignani M, Gargano L, Corleto VD, Casini A, Delle Fave G, Andreoli M, Annibale B. Atrophic body gastritis in patients with autoimmune thyroid disease: an underdiagnosed association. Archives of Internal Medicine. 1999;159:1726–1730. doi: 10.1001/archinte.159.15.1726. [DOI] [PubMed] [Google Scholar]
- 27.Axelrod AR, Berman L. The bone marrow in hyperthyroidism and hypothyroidism. Blood. 1951;6:436–453. [PubMed] [Google Scholar]
- 28.How J, Davidson RJ, Bewsher PD. Red cell changes in hyperthyroidism. Scandinavian Journal of Haematology. 1979;23:323–328. doi: 10.1111/j.1600-0609.1979.tb02869.x. [DOI] [PubMed] [Google Scholar]