

Abstract
Transverse relaxation time (T2) is a basic but very informative MRI parameter, widely used in imaging to examine a host of diseases, including multiple sclerosis, stroke, and tumor. However, short repetition time (TR) is often used to minimize scan time, which may introduce non-negligible errors in T2 measurement. Specifically, due to the use of refocusing pulse, the steady state magnetization depends not only on TR but also on the TE. Hence, if the TE dependence is not properly accounted for, it may be mistaken as T2-induced signal attenuation, leading to non-negligible T2 underestimation. Our study proposed a fast radio-frequency enforced steady state (FRESS) spin echo (SE) MRI sequence, which saturates the magnetization after the echo and ensures a TE-independent steady state. The proposed FRESS-SE MRI was evaluated with numerical simulation, implemented with echo planar imaging readout, and validated by both phantom and in vivo experiments. In summary, FRESS-SE T2 MRI technique was developed for fast and accurate T2 imaging, suitable for in vivo applications.
Keywords: MRI, spin echo, stroke, T2
INTRODUCTION
Transverse relaxation time (T2) is a basic but very informative MRI parameter, providing non-invasive measurement of tissue status and disease prognosis and thus widely used in imaging to examine a host of diseases including epilepsy, multiple sclerosis (MS), stroke and tumor (1–6). In addition, quantitative T2 mapping offers tremendous insights into brain development, iron deposition and metabolism (7–11). In order to quantify T2, multiple T2-weighted images are acquired and fitted against their echo time (TE), assuming long repetition time (TR) for complete relaxation. In practice, however, short TR is often used to minimize the scan time; its use, however, may undermine quantitative T2 measurement. For instance, in their study of child brain development, Ding et al. reported T2 measurements two to four times larger than those found in an earlier study by Holland et al.; Ding postulated that the discrepancy between these findings may be partially attributable to the choice of different TR (10,11). It is important to note that while multi-echo acquisition strategies such as the Carr Purcell Meiboom Gill (CPMG) sequence allow efficient T2 mapping, they require a train of refocusing radio frequency (RF) pulses, and the use of slice selective and crusher gradients may introduce non-negligible diffusion attenuation. In addition, it may be susceptible to field inhomogeneity and stimulated echo artifacts, particularly, in heterogeneous systems (12–18). Whereas the use of composite RF pulses may mitigate field inhomogeneity effect, it may introduce T1-mixing effects (19–22).
Our study analyzed the evolution of magnetization for conventional SE MRI, and showed that the steady state magnetization is indeed both TR- and TE-dependent. Specifically, Z-magnetization recovers after the excitation pulse, which is inverted by the refocusing π pulse before resuming the longitudinal relaxation. Hence, the conventional SE MRI steady state depends on not only TR, but also on when the π pulse is applied, and therefore, is TE dependent. Unless very long TR is used, the TE-dependent steady state may cause significant underestimation of T2. To solve for this error, we proposed a fast RF-enforced steady state (FRESS) MRI sequence that saturates both transverse and longitudinal magnetizations after the SE to ensure a TE-independent steady state, similar to that used for fast T1 mapping (23). Here, we evaluated single echo FRESS T2 MRI with echo-planar imaging (EPI) readout and tested whether it can provide fast yet accurate T2 measurement at short TR. We first evaluated the proposed FRESS-SE MRI using a triple-compartment phantom with broad T2 distribution, from tens of milliseconds to hundreds of milliseconds, and confirmed that our method provides significantly improved T2 measurement, particularly at short TR. We also tested bi-exponential fitting by combing each two compartments, which showed similar results as mono-exponen-tial fitting. Moreover, we validated the proposed FRESS-SE sequence using an animal model of ischemic stroke. In summary, our work demonstrated that FRESS-SE T2 MRI enables fast and accurate T2 imaging, and is suitable for in vivo application.
THEORY
We examined the Z-magnetization evolution of the conventional SE MRI. The steady state Z-magnetization (Mss) can be shown as:
| [1] |
where M0 is the thermal equilibrium Z-magnetization. If TE is significantly shorter than TR, the TE dependence of the steady state can be reasonably ignored, and T2 can be derived by fitting the signal intensity as a function of TE. Conversely, when TE is not negligible, the image intensity can be described by M(TR, TE, T1, T2) = Mss(TR, TE, T1)·e−TE/T2. In fact, the steady state itself (Equation [1]) decreases with TE, which if not properly accounted for, will be mistaken as T2-induced signal attenuation, leading to T2 underestimation. To address this, we proposed FRESS-SE MRI, which saturates the magnetizations after the SE so that spins recover from 0 till the next excitation pulse (TR0), and the steady state magnetization becomes Mss(TR0, T1) = M0(1−e−TR0/T1. As such, the steady state magnetization is independent of TE, provided that TR0 is kept as constant, and T2 can be obtained from numerical fitting.
MATERIALS AND METHODS
T2 phantom
We engineered a triple-compartment phantom, comprising two agarose gel compartments and a third compartment of 3% bovine serum albumin (BSA) solution. Briefly, 0.5% and 2% agarose solution was prepared by mixing agarose (Sigma Aldrich, St Louis, MO) with distilled water, and doped with 0.5 mM CuSO4·5H2O. The solution was microwave heated and transferred to two centrifuge tubes, which were capped and inserted into a 50 ml Falcon tube. We then prepared 3% BSA solution and transferred it into the Falcon tube.
Animal stroke model
Animal studies were carried out in accordance with guidelines approved by the Subcommittee on Research Animal Care, Massachusetts General Hospital (SRAC, MGH). Adult male Wistar rats (n = 5, 250–300 g) were anesthetized with 1–1.5% isoflurane during surgery and MRI, in a gas mixture of 30% O2 and 70% N2O. The animals’ core temperature was monitored using a rectal probe, and maintained within the normal physiological range by a circulating warm water jacket positioned around the torso. We also monitored cardiac rate and blood oxygenation saturation (SpO2) online (Nonin Pulse Oximeter 8600, Plymouth, MN). Standard permanent middle cerebral artery occlusion (MCAO) was induced by inserting a 4–0 nylon suture into the lumen of internal carotid artery (ICA) to block the origin of the middle cerebral artery (MCA). After surgery, animals were allowed to recover from anesthesia and scanned at approximately 24 h (n = 5) and again 48 h (n = 4) later.
MRI and data analysis
Figure 1 compares the conventional SE (Fig. 1a) and the proposed FRESS-SE MRI (Fig. 1b) sequences. For the FRESS-SE sequence, a saturation module that includes a slice-selective 90° RF pulse sandwiched by two crusher gradient pulses is applied after the SE to saturate both transverse and longitudinal magnetization. It is important to note that TR0 must be kept constant in order to reach the same steady state. To achieve this, we can add a filler echo time (δTE) so that (TE + δTE) remains constant, resulting in fixed TR and TR0 (scheme I). Alter-natively, the crusher module can be applied immediately after the SE, resulting in a fixed TR0 but variable TR (scheme II). To mitigate the RF inhomogeneity artifacts, composite RF pulses can be applied for saturation, such as two π/2 pulses with alternated phase (24).
Figure 1.

Pulse sequence diagrams of the conventional spin echo (SE) sequence (a) and the proposed fast radio-frequency enforced steady state (FRESS) SE sequence, in which a saturation module that includes a slice-selective π/2 pulse and spoiler gradients was applied after the spin echo (b). Note that composite RF pulses can be applied to minimize the field inhomogeneity artifacts.
MRI data were acquired using a 4.7 T (Bruker Biospin, Billerica, MA) with the standard setup (25). We used field of view (FOV) of 48 × 48 mm2, imaging matrix of 64 × 64, and slice thickness of 3 mm. Specifically, we measured T1 using an inversion recovery SE EPI, with seven inversion intervals (TI) from 0.1 to 7.5 s, signal averaged twice (NA) = 2, TR = 15 s; the EPI sampling bandwidth was 150 kHz. For both T2 sequences, we used six TEs: 50, 75, 100, 150, 200 and 250 ms. In addition, TR was serially varied at 15, 12, 9, 6, 4, 3, 2 and 1.6 s (NA = 4) to examine the TR dependence of the T2 measurement. We also repeated the phantom study with multi-slice acquisition (number of slices = 5, 3 mm/slice), with identical TR and TE. For in vivo imaging, we obtained multi-slice T2 MRI with four TEs of 30, 60, 90 and 120 ms for both conventional and FRESS T2 sequences, and TR was serially varied at 6, 4, 3, 2 and 1.6 s (NA = 8, FOV = 20 × 20 mm2, imaging matrix size = 48 × 48, slice thickness = 1.8 mm, number of slices = 5).
Images were analyzed in MATLAB (MathWorks, Natick, MA). T1 and T2 maps were computed by nonlinear least-square fitting of signal intensities versus TIs and TEs, respectively, pixel-by-pixel. For T1 fitting, we had M(TI) = M0(1–2·η·e−TI/T1, with three unknown variables, where η is inversion efficiency. For mono-exponential T2 fitting, we assumed M(TE) = M0·e−TE/T2, with two unknown variables, M0 and T2. For bi-exponential T2 fitting, we had M(TE) = M0a·e−TE/T2a + M0b·e−TE/T2b, with four unknowns, M0a, M0b, T2a and T2b. One animal was excluded from image analysis due to severe motion artifact.
RESULTS
We simulated the magnetization evolution of the conventional SE MRI for two representative T2 values of 50 and 500 ms; T1 = 3 s (Fig. 2). As shown in Fig. 2a, we plotted three Z-magnetizations: one without refocusing π pulse (solid line), and two with π pulse, applied at 12.5 ms (dashed) and 500 ms (dotted), respectively. The plot shows that the Z-magnetization steady state depends not only on TR but also TE. If the refocusing pulse-induced loss of steady state magnetization (TE dependence) is not properly taken into account, it may be mistaken as T2-induced signal attenuation, and therefore cause an underestimation of T2. We simulated T2-weighted signal by varying TE from 50 to 500 ms in 10 steps and obtained T2 by numerical fitting, assuming a mono-exponential function. Our results showed that the measured T2 decreased with short TR, particularly for the long T2 component (Fig. 2b). This decrease in T2 occurred because for a given TE, the T2-induced signal decay for the long T2 component is less than that for the short T2 component, and therefore is more susceptible to the refocusing π pulse-induced loss of steady state Z-magnetization. We also compared the sensitivity of conventional SE and FRESS EPI. For the conventional SE MRI, the Z-magnetization at TE can be shown as
Figure 2.
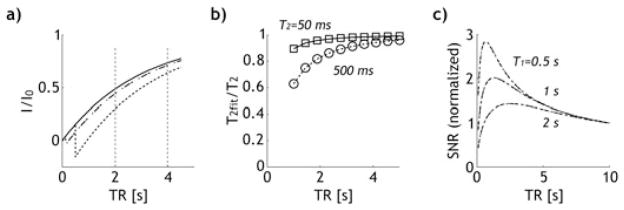
Simulation shows the steady state magnetization for the conventional spin echo (SE) MRI was both TR and TE dependent. (a) Z-magnetiza-tion for the conventional SE MRI as a function of repetition time without π pulse (solid), and with π pulse applied at 12.5 ms and 500 ms (i.e. TE = 25 ms (dashed) and 1 s (dotted)). (b) The normalized T2 for the conventional SE MRI as a function of TR, revealing that underestimation of T2 was particularly severe for the long T2 component at short TR. (c) Analysis of SNR as a function of TR for both conventional SE and the proposed fast radio-frequency enforced steady state (FRESS) T2 MRI. It shows that SNR per time was maximal at TR slightly above its T1 values, suggesting the necessity of developing quantitative T2 MRI at short TR.
while for FRESS T2 MRI, we have M(TE) = 0. As such, the saturation module of FRESS-SE MRI only marginally reduces the steady state Z-magnetization. We also simulated the steady state magnetization with TR varied from 0.1 to 10 s, for three representative T1 of 0.5, 1 and 2 s. We assumed a typical T2 of 100 ms, with two TEs, 50 and 100 ms. We calculated the normalized signal to noise ratio (SNR) per time as
in which the SNR at a long TR was used as the reference (TR∞ = 10 s). For the proposed FRESS MRI (scheme II), we assumed TR0 = TR – mean(TE). Figure 2c shows the SNRnorm for conventional SE (black dashed dotted line) and FRESS-SE MRI (gray dashed), with very little difference. Thus, despite the use of a saturation module, the sensitivity of the proposed FRESS-SE T2 MRI is comparable to that of the conventional SE MRI. In addition, it showed that SNR per time is highest at an optimal TR comparable to T1 (TRopt ~ 1.26 T1), which suggests the necessity to correct the TR dependence of T2 mapping so the sensitivity of T2 MRI can be optimized.
Figure 3a shows phantom T2 maps obtained with both the conventional SE and the proposed FRESS-SE sequences for three representative TRs of 9, 3 and 1.6 s. Whereas the conventional SE sequence significantly underestimated T2 of the BSA solution at short TR, the proposed FRESS-SE sequence yielded consistent T2 measurements. In addition, T1 was found to be 2188 ± 120, 2340 ± 141 and 2521 ± 151 ms, for the 2% agarose, 0.5% agarose and BSA solution compartments, respectively. Figure 3b shows TR-dependence of T2 for three regions of interest (ROI) from the three compartments. For 2% agarose, the T2 measurements from both sequences were comparable, while the conventional SE MRI showed noticeable underestimation of T2 for the 0.5% agarose compartment, particularly at short TRs. Most importantly, T2 of the BSA solution obtained with the FRESS-SE MRI sequence was nearly independent of TR, and persistently higher than T2 measures acquired using the conventional sequence, especially at short TR. In fact, at the shortest evaluated TR of 1.6 s, the maximal T2 differences between FRESS-SE and conventional SE MRI were 3, 19 and 94 ms for 2% and 0.5% aga-rose, and 3% BSA solution, respectively. Therefore, the proposed FRESS-SE MRI significantly improved T2 measurement, especially when short TR is used. To test whether the FRESS T2 MRI can measure T2 in multi-compartment systems, we combined image signals from three sets of two separate ROIs each, and obtained their T2 with bi-exponential fitting. We showed that T2 derived from bi-exponential fitting agreed well with those obtained from mono-exponential fitting of each compartment independently when compared with conventional SE MRI. In addition, FRESS T2 retained its advantage of little TR dependence. We also compared single- and multi-slice T2 quantification. For single slice acquisition, T2 was found to be 453 ± 26, 196 ± 5 and 59 ± 1 ms for BSA, 0.5% and 2% agarose gel, while they became 456 ± 28, 196 ± 5 and 59 ± 1 ms for multi-slice acquisition of the conventional SE MRI. For FRESS T2 MRI, single slice measurement of T2 was 490 ± 2, 201 ± 1 and 60 ± 0 ms. In addition, for multi-slice FRESS T2 MRI, T2 of the corresponding slice was found to be 495 ± 2, 205 ± 1 and 61 ± 0 ms. Thus, we showed that FRESS T2 MRI is consistently equal to or higher than conventional SE MRI. In addition, very little T2 difference was found between single- and multi-slice acquisitions, suggesting negligible magnetization transfer (MT) effect with multi-slice acquisition. To assess the sensitivity of the proposed FRESS T2 MRI, we also calculated the coefficient of variation (CV) for both FRESS and conventional SE MRI. Mean CV of T2 measured by FRESS MRI was 2%, 1.9% and 7.5% for BSA, 0.5% and 2% agarose gel, respectively, which were comparable to that obtained with conventional SE MRI, being 1.4%, 1.8% and 7.8%, respectively. Finally, it is necessary to note that the RF field has been calibrated with double angle method (DAM), with its field homogeneity being 100 ± 6% (mean ± SD) (26,27). However, we found no B1-inhomogeneity artifacts in FRESS T2 maps (Fig. 3), suggesting that subtle B1 inhomogeneity effect can be reasonably compensated with composite RF pulses.
Figure 3.
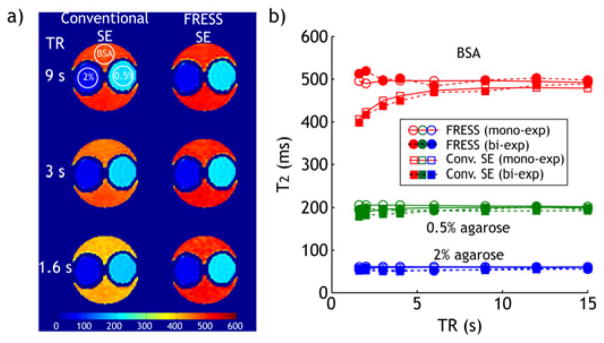
Comparison of conventional spin echo (SE) and fast radio-frequency enforced steady state SE (FRESS-SE) MRI with a triple-compartment phantom. (a) T2 maps of the triple-compartment phantom, as acquired using the conventional SE and the proposed FRESS SE sequences with different TRs. All T2 maps (in ms) are displayed at the same scale. Circular ROIs with the same size are drawn in the 2% agarose, 0.5% agarose and 3% bovine serum albumin (BSA) solutions for T2 measurements in Figure 3b. (b) Comparison of the measured T2 values of the triple-compartment phantom using the conventional SE and proposed sequences at different TRs, mono-exponential fitting (open markers) and bi-exponential fitting (filled markers).
Figure 4 shows pilot in vivo evaluation of FRESS-SE T2 MRI in a representative ischemic stroke animal model, 24 h after MCAO. The multi-slice T2 map obtained with long TR (6 s) was used as the reference T2 map, and compared with those obtained at short TR using both FRESS-SE and conventional SE MRI. It is important to note that whereas multi-slice MRI was obtained, only a representative middle slice is shown in Fig. 4 for illustration. Specifically, T2 measured with conventional SE sequence was found to be 56.3 ± 4.6 and 97.6 ± 13 ms for the contralateral normal and ipsilateral ischemic lesion, respectively, at long TR, while they decreased to 54.6 ± 4.8 ms and 93.8 ± 13.9 ms, respectively, when short TR is used (Fig. 4a). In comparison, the proposed FRESS-SE sequence yielded a T2 map similar to the reference T2 map, being 56.5 ± 4.8 and 99.0 ± 13.6 ms for the contralateral normal and ipsilateral ischemic lesion, respectively. In addition, the difference in T2 between the proposed FRESS-SE and conventional SE sequences (ΔT2 = T2_FRESS SE − T2_SE) of short TR was 2.0 ± 2.5 ms (p < 0.01) and 5.2 ± 6.8 ms (p < 0.01), for the con-tralateral normal and ischemic regions, respectively. The fact that T2 difference in the ischemic lesion is larger than that of contralateral normal area is attributable to its longer T2, consistent with simulation and phantom results (Fig. 2). In addition, T2 histograms obtained with SE MRI (TR = 1.6 s, green) showed clear shift to lower values from that of reference SE MRI (TR = 6 s, red) and FRESS-SE MRI (TR = 1.6 s, blue), while reference SE MRI and FRESS-SE overlapped reasonably well (Fig. 4b). Figure 4c shows the change of T2 histogram between conventional SE and FRESS-SE MRI, which confirmed significant underestimation of T2 when short TR is used for the conventional SE MRI, particularly in the ipsilateral ischemic lesion. Moreover, T2 maps of stroke animals acquired at 48 h exhibited similar results (data not shown). As such, our study confirmed that FRESS-SE MRI provides fast and accurate T2 measurement, superior to conventional SE MRI. In addition, by providing fast and accurate T2 measurement, the proposed FRESS-SE MRI may help characterize tissue metabolic status by determining measures such as altered oxygen extraction ratio (OER) during stroke, and thus may complement commonly used perfusion and diffusion scans (10).
Figure 4.

In vivo evaluation of the proposed fast radio-frequency enforced steady state spin echo (FRESS-SE) MRI. (a) T2 maps of a rat brain with chronic stroke (~24 h after onset of permanent MCAO) using conventional SE sequence with TR = 6 s (left) and TR = 1.6 s (second from left), and using the proposed FRESS SE sequence with TR = 1.6 s (third from left). All T2 maps (in ms) are displayed at the same scale. (b) T2 histogram of two regions of interest, one from ipsilateral ischemia area and another from the contralateral normal region. (c) T2 difference (proposed sequence – conventional sequence) map (in ms) is computed for TR = 1.6 s (bottom row).
DISCUSSION
Our study used EPI as image readout for both conventional SE and the proposed FRESS T2 MRI so T2 can be obtained using single echo technique within a reasonable amount of scan time. In addition, for FRESS MRI, TR can be significantly reduced without affecting the accuracy of T2. As such, the total scan time for T2 mapping using FRESS T2 MRI is relatively short. For instance, for a dual echo MRI with an image matrix size of 64 × 64, assuming a TR of 2 s, the imaging takes 128 s. With single-shot EPI readout, the same amount of acquisition time permits multi-slice/3-D acquisition and signal averaging. Here, we showed that for single compartment system, FRESS MRI eliminates the TR dependence. In addition, we obtained similar T2 values with bi-exponential fitting of signals combined from pseudo multi-compartments, suggesting its in vivo applicability. Whereas TR may affect the relative amplitudes of components, FRESS T2 MRI simplifies the TR-dependence for multi-pool system by removing TE-induced TR-dependent measurement errors, thereby limiting the TR- dependence to an amplitude modulation through relaxation recovery. It is likely that such an effect can be quantified by simultaneous T1 and T2 measurements. Nevertheless, it is important to note that the gel phantom we studied here is a relatively simple system, for which bi-exponential fitting worked reasonably well. For more complex biological systems such as muscle or brain tissue, it may take significantly more TE measurements in order to accurately quantify T2. In addition, it is expected that in vivo tissue is more susceptible to MT than the gel phantom investigated in our study, and further evaluation is needed before in vivo translation of FRESS T2 MRI.
It is worthwhile to point out that both the commonly used multi-echo and the proposed FRESS T2 MRI techniques have their advantages and limitations, and it is necessary to carefully evaluate and choose the most appropriate sequence for a given application. It is important to note that for conventional SE MRI, the long T2 component is more susceptible to underestimation when short TR is used. In addition, because the TE-dependent steady state varies with T1, it is expected that the T2 mapping error using conventional SE MRI is particularly severe when T2/T1 is large. Given that T2/T1 ratio is typically higher at lower field strength, routine clinical scans acquired at 1.5 T may be more susceptible to error than scans acquired at higher field strengths of 3 or 7 T (7,8,28,29). In addition, although conventionally long TR is necessary when a specimen of broad T2 distribution is imaged, the proposed FRESS-SE T2 MRI technique is capable of quantifying T2 with very short TR, hence, minimizes the scan time. Still, it is necessary to note that quantitative in vivo T2 imaging is complex. Although our study evaluated T2 measurement with both mono-exponential and bi-exponential decay functions, we did not consider magnetization exchange between compartments. In addition, there may be non-negligible partial volume effect for in vivo measurements, which may also affect T2 quantification (30). Nevertheless, such effects may be reasonably addressed by choosing multi-exponential fitting or imaging at higher spatial resolution (31–33).
CONCLUSIONS
We elucidated the phenomenon of TR dependence in T2 measurement for the conventional SE MRI, and developed a FRESS-SE MRI method that allows fast and accurate T2 mapping. The proposed FRESS-SE T2 MRI technique was validated both numerically and experimentally, and is suitable for in vivo applications.
Acknowledgments
This study was supported in part by grants from AHA/SDG 0835384 N, NIH/NIBIB 1K01EB009771-01, NIH/1R21NS061119, NIH/NCRR-P41RR14075, NSFC/30900365 and BNSF/7092038. The authors would like to thank Dr Kenneth Kwong and Dr Timothy Reese for stimulating discussions, and Ms Nichole Eusemann for editorial assistance.
Abbreviations used
- CPMG
Carr Purcell Meiboom Gill
- EPI
echo-planar imaging
- FRESS
fast radio-frequency enforced steady state
- NA
number of average
- RF
radio frequency
- SE
spin echo
- TE
echo time
- TR
repetition time
References
- 1.Ngo FQ, Bay JW, Kurland RJ, Weinstein MA, Hahn JF, Glassner BJ, Woolley CA, Dudley AW, Jr, Ferrario CM, Meaney TF. Magnetic resonance of brain tumors: considerations of imaging contrast on the basis of relaxation measurements. Magn Reson Imaging. 1985;3(2):145–155. doi: 10.1016/0730-725x(85)90251-6. [DOI] [PubMed] [Google Scholar]
- 2.Jackson GD, Connelly A, Duncan JS, Grunewald RA, Gadian DG. Detection of hippocampal pathology in intractable partial epilepsy: increased sensitivity with quantitative magnetic resonance T2 relaxometry. Neurology. 1993;43(9):1793–1799. doi: 10.1212/wnl.43.9.1793. [DOI] [PubMed] [Google Scholar]
- 3.Moseley ME, Cohen Y, Mintorovitch J, Chileuitt L, Shimizu H, Kucharczyk J, Wendland MF, Weinstein PR. Early detection of regional cerebral ischemia in cats: comparison of diffusion- and T2- weighted MRI and spectroscopy. Magn Reson Med. 1990;14(2):330–346. doi: 10.1002/mrm.1910140218. [DOI] [PubMed] [Google Scholar]
- 4.Duncan JS, Bartlett P, Barker GJ. Technique for measuring hippocampal T2 relaxation time. Am J Neuroradiol. 1996;17(10):1805–1810. [PMC free article] [PubMed] [Google Scholar]
- 5.Grohn O, Kettunen M, Penttonen M, Oja J, van Zijl P, Kauppinen R. Graded reduction of cerebral blood flow in rat as detected by the nuclear magnetic resonance relaxation time T2: a theoretical and experimental approach. J Cereb Blood Flow Metab. 2000;20(2):316–326. doi: 10.1097/00004647-200002000-00013. [DOI] [PubMed] [Google Scholar]
- 6.Whittall KP, MacKay AL, Li DKB, Vavasour IM, Jones CK, Paty DW. Normal-appearing white matter in multiple sclerosis has heterogeneous, diffusely prolonged T2. Magn Reson Med. 2002;47(2):403–408. doi: 10.1002/mrm.10076. [DOI] [PubMed] [Google Scholar]
- 7.Holland BA, Haas DK, Norman D, Brant-Zawadzki M, Newton TH. MRI of normal brain maturation. Am J Neuroradiol. 1986;7(2):201–208. [PMC free article] [PubMed] [Google Scholar]
- 8.Ding X-Q, Kucinski T, Wittkugel O, Goebell E, Grzyska U, Gorg M, Kohlschutter A, Zeumer H. Normal brain maturation characterized with age-related T2 relaxation times: an attempt to develop a quantitative imaging measure for clinical use. Invest Radiol. 2004;39 (12):740–746. doi: 10.1097/00004424-200412000-00005. [DOI] [PubMed] [Google Scholar]
- 9.Haacke EM, Cheng NYC, House MJ, Liu Q, Neelavalli J, Ogg RJ, Khan A, Ayaz M, Kirsch W, Obenaus A. Imaging iron stores in the brain using magnetic resonance imaging. Magn Reson Imaging. 2005;23 (1):1–25. doi: 10.1016/j.mri.2004.10.001. [DOI] [PubMed] [Google Scholar]
- 10.van Zijl P, Eleff S, Ulatowski J, Oja J, Uluğ A, Traystman R, Kauppinen R. Quantitative assessment of blood flow, blood volume and blood oxygenation effects in functional magnetic resonance imaging. Nat Med. 1998;4(2):159–167. doi: 10.1038/nm0298-159. [DOI] [PubMed] [Google Scholar]
- 11.Leppert IR, Almli CR, McKinstry RC, Mulkern RV, Pierpaoli C, Rivkin MJ, Pike GB. Brain Development Cooperative G. T2 relaxometry of normal pediatric brain development. J Magn Reson Imaging. 2009;29(2):258–267. doi: 10.1002/jmri.21646. [DOI] [PMC free article] [PubMed] [Google Scholar]
- 12.Carr HY, Purcell EM. Effects of diffusion on free precession in nuclear magnetic resonance experiments. Phys Rev. 1954;94(3):630. [Google Scholar]
- 13.Meiboom S, Gill D. Modified spin-echo method for measuring nuclear relaxation times. Rev Sci Instr. 1958;29(8):688–691. [Google Scholar]
- 14.Crawley AP, Henkelman RM. Errors in T2 estimation using multislice multiple-echo imaging. Magn Reson Med. 1987;4(1):34–47. doi: 10.1002/mrm.1910040105. [DOI] [PubMed] [Google Scholar]
- 15.Poon CS, Henkelman RM. Practical T2 quantitation for clinical applications. J Magn Reson Imaging. 1992;2(5):541–553. doi: 10.1002/jmri.1880020512. [DOI] [PubMed] [Google Scholar]
- 16.Foltz WD, Stainsby JA, Wright GA. T2 Accuracy on a whole-body imager. Magn Reson Med. 1997;38(5):759–768. doi: 10.1002/mrm.1910380512. [DOI] [PubMed] [Google Scholar]
- 17.Vold RL, Vold RR, Simon HE. Errors in measurements of transverse relaxation rates. J Magn Reson. 1973;11:283–298. [Google Scholar]
- 18.Sun PZ, Seland JG, Cory D. Background gradient suppression in pulsed gradient stimulated echo measurements. J Magn Reson. 2003;161(2):168–173. doi: 10.1016/s1090-7807(02)00199-4. [DOI] [PubMed] [Google Scholar]
- 19.Majumdar S, Orphanoudakis SC, Gmitro A, O’Donnell M, Gore JC. Errors in the measurements of T2 using multiple-echo MRI techniques. I. Effects of radiofrequency pulse imperfections. Magn Reson Med. 1986;3(3):397–417. doi: 10.1002/mrm.1910030305. [DOI] [PubMed] [Google Scholar]
- 20.Pell GS, Briellmann RS, Waites AB, Abbott DF, Lewis DP, Jackson GD. Optimized clinical T2 relaxometry with a standard CPMG sequence. J Magn Reson Imaging. 2006;23(2):248–252. doi: 10.1002/jmri.20490. [DOI] [PubMed] [Google Scholar]
- 21.Oh J, Han ET, Pelletier D, Nelson SJ. Measurement of in vivo multi-component T2 relaxation times for brain tissue using multi-slice T2 prep at 1.5 and 3T. Magn. Reson Imaging. 2006;24(1):33–43. doi: 10.1016/j.mri.2005.10.016. [DOI] [PubMed] [Google Scholar]
- 22.O’Donnell M, Gore J, Adams W. Toward an automated analysis system for nuclear magnetic resonance imaging. I. Efficient pulse sequences for simultaneous T1–T2 imaging. Med Phys. 1986;13 (2):182–190. doi: 10.1118/1.595943. [DOI] [PubMed] [Google Scholar]
- 23.Deichmann R, Hahn D, Haase A. Fast T1 mapping on a whole-body scanner. Magn Reson Med. 1999;42(1):206–209. doi: 10.1002/(sici)1522-2594(199907)42:1<206::aid-mrm28>3.0.co;2-q. [DOI] [PubMed] [Google Scholar]
- 24.Levitt M. Composite pulses. Prog NMR Spectrosc. 1986;18:61–122. [Google Scholar]
- 25.Sun PZ, Zhou J, Sun W, Huang J, van Zijl PCM. Detection of the ischemic penumbra using pH-weighted MRI. J Cereb Blood Flow Metab. 2006;27(6):1129–1136. doi: 10.1038/sj.jcbfm.9600424. [DOI] [PubMed] [Google Scholar]
- 26.Cunningham CH, Pauly JM, Nayak KS. Saturated double-angle method for rapid B1+ mapping. Magn Reson Med. 2006;55(6):1326–1333. doi: 10.1002/mrm.20896. [DOI] [PubMed] [Google Scholar]
- 27.Sun PZ, Farrar CT, Sorensen AG. Correction for artifacts induced by B0 and B1 field inhomogeneities in pH-sensitive chemical exchange saturation transfer (CEST) imaging. Magn Reson Med. 2007;58(6):1207–1215. doi: 10.1002/mrm.21398. [DOI] [PubMed] [Google Scholar]
- 28.Mainero C, Benner T, Radding A, van der Kouwe A, Jensen R, Rosen BR, Kinkel RP. In vivo imaging of cortical pathology in multiple sclerosis using ultra-high field MRI. Neurology. 2009;73(12):941–948. doi: 10.1212/WNL.0b013e3181b64bf7. [DOI] [PMC free article] [PubMed] [Google Scholar]
- 29.Kollia K, Maderwald S, Putzki N, Schlamann M, Theysohn JM, Kraff O, Ladd ME, Forsting M, Wanke I. First clinical study on ultra-high-field MR imaging in patients with multiple sclerosis: comparison of 1.5T and 7T. Am J Neuroradiol. 2009;30(4):699–702. doi: 10.3174/ajnr.A1434. [DOI] [PMC free article] [PubMed] [Google Scholar]
- 30.Dortch RD, Yankeelov TE, Yue Z, Quarles CC, Gore JC, Does MD. Evidence of multiexponential T2 in rat glioblastoma. NMR Biomed. 2009;22(6):609–618. doi: 10.1002/nbm.1374. [DOI] [PMC free article] [PubMed] [Google Scholar]
- 31.Whittall KP, MacKay AL, Li DK. Are mono-exponential fits to a few echoes sufficient to determine T2 relaxation for in vivo human brain? Magn Reson Med. 1999;41(6):1255–1257. doi: 10.1002/(sici)1522-2594(199906)41:6<1255::aid-mrm23>3.0.co;2-i. [DOI] [PubMed] [Google Scholar]
- 32.Deoni SCL, Peters TM, Rutt BK. High-resolution T1 and T2 mapping of the brain in a clinically acceptable time with DESPOT1 and DES-POT2. Magn Reson Med. 2005;53(1):237–241. doi: 10.1002/mrm.20314. [DOI] [PubMed] [Google Scholar]
- 33.Dula AN, Gochberg DF, Does MD. Optimal echo spacing for multi-echo imaging measurements of bi-exponential T2 relaxation. J Magn Reson. 2009;196(2):149–156. doi: 10.1016/j.jmr.2008.11.002. [DOI] [PMC free article] [PubMed] [Google Scholar]