

Abstract
Taste buds are aggregates of 50–100 cells, only a fraction of which express genes for taste receptors and intracellular signaling proteins. We combined functional calcium imaging with single-cell molecular profiling to demonstrate the existence of two distinct cell types in mouse taste buds. Calcium imaging revealed that isolated taste cells responded with a transient elevation of cytoplasmic Ca2+ to either tastants or depolarization with KCl, but never both. Using single-cell reverse transcription (RT)-PCR, we show that individual taste cells express either phospholipase C β2 (PLCβ2) (an essential taste transduction effector) or synaptosomal-associated protein 25 (SNAP25) (a key component of calcium-triggered transmitter exocytosis). The two functional classes revealed by calcium imaging mapped onto the two gene expression classes determined by single-cell RT-PCR. Specifically, cells responding to tastants expressed PLCβ2, whereas cells responding to KCl depolarization expressed SNAP25. We demonstrate this by two methods: first, through sequential calcium imaging and single-cell RT-PCR; second, by performing calcium imaging on taste buds in slices from transgenic mice in which PLCβ2-expressing taste cells are labeled with green fluorescent protein. To evaluate the significance of the SNAP25-expressing cells, we used RNA amplification from single cells, followed by RT-PCR. We show that SNAP25-positive cells also express typical presynaptic proteins, including a voltage-gated calcium channel (α1A), neural cell adhesion molecule, synapsin-II, and the neurotransmitter-synthesizing enzymes glutamic acid decarboxylase and aromatic amino acid decarboxylase. No synaptic markers were detected in PLCβ2 cells by either amplified RNA profiling or by immunocytochemistry. These data demonstrate the existence of at least two molecularly distinct functional classes of taste cells: receptor cells and synapse-forming cells.
Keywords: taste bud, cell type, afferent synapse, PLCβ2, SNAP25, response
Introduction
Specialized neuroepithelial cells in taste buds detect chemical stimuli in the oral cavity and send signals to the brain via afferent cranial nerves. Bitter, sweet, and umami tastes are transduced by G-protein-coupled receptors (GPCRs) for taste (Chandrashekar et al., 2000; Chaudhari et al., 2000; Nelson et al., 2001, 2002). A specific form of phospholipase C, PLCβ2, is found in many taste cells (Rossler et al., 1998). In a semi-intact slice preparation, responses to umami tastants were found in taste cells that express PLCβ2 (Maruyama et al., 2006). Knock-out of the PlCb2 gene leads to profound taste deficits (Zhang et al., 2003; Dotson et al., 2005). These and other findings indicate that chemosensory transduction for bitter, sweet, and umami is predominantly mediated through a shared signaling pathway that involves phosphoinositide-mediated release of stored intracellular Ca2+ (Akabas et al., 1988; Spielman et al., 1996; Caicedo and Roper, 2001).
Although many details of these initial events of taste transduction have been explained recently, aspects of signal processing in taste buds and signal transmission to gustatory afferent nerve terminals remain unresolved, especially regarding the functional specialization of the different cell types. Murray (1974) described three subtypes of taste cells (types I–III) based on their ultrastructural characteristics. More recent electron microscopic studies have documented that only type III cells form synapses with primary sensory afferent terminals and that the presynaptic plasma membrane synaptosomal-associated protein 25 (SNAP25) is associated with synaptic junctions between type III taste cells and nerve terminals (Yang et al., 2000a). Conversely, the taste-specific G-protein α-gustducin is expressed in type II cells (Yang et al., 2000b). These and related morphological and immunocytochemical data have led to the suggestion that there are at least three classes of cells within taste buds, one that possesses typical synapses (type III cells), another that expresses chemosensory transduction proteins (type II cells), and a third class that expresses none of these markers (type I cells) (Yee et al., 2001; Clapp et al., 2004).
The functional correlates of these three classes of taste cells are addressed in the present study. Specifically, we asked the following. Are the Snap25 and PLCb2 genes expressed in separate taste cell populations, as inferred from immunocytochemical studies? If so, do the cells expressing these proteins display functional properties expected for presynaptic cells and chemosensitive cells, respectively? Finally, does the expression of additional synapse-related genes support the designation of only one of these cell types as presynaptic to gustatory sensory afferent terminals? We used single-cell reverse transcription (RT)-PCR to examine the expression profiles of individual taste cells and correlated these findings with functional responses using calcium imaging. Our data confirm that there are two very distinct and separate classes of taste cells. We further show that one class has functional properties of gustatory receptor cells, whereas the other class has characteristics of presynaptic cells.
Materials and Methods
Physiological buffers, dyes, and reagents
Tyrode’s solution was composed of the following (in mm): 145 NaCl, 5 KCl, 2 CaCl2, 1 MgCl2, 10 HEPES, 5 NaHCO3, 10 Na pyruvate, and 10 glucose, pH 7.2. Low-Na/Ca buffer contained the following (in mm): 290 mannitol, 5 KCl, 3 MgCl2, 10 HEPES, 5 NaHCO3, 10 Na pyruvate, and 10 glucose, pH 7.2. Responses to 50 mm KCl were obtained using Tyrode’s solution with an equimolar substitution of KCl for NaCl. Tastants (cycloheximide and/or saccharin) were dissolved directly in Tyrode’s buffer. All imaging dyes were obtained from Invitrogen (Carlsbad, CA). Other reagents were obtained from Sigma (St. Louis, MO), unless otherwise indicated.
Tissues and cell collection
All procedures were approved by the University of Miami Animal Care and Use Committee. Adult C57BL/6J mice were killed with CO2 and cervical dislocation as recommended by the National Institutes of Health (www.grants.nih.gov/grants/olaw/references/phspol.htm). The tongue was removed, a protease mixture consisting of 3.2 mg/ml collagenase, type A (Roche Products, Indianapolis, IN), 8 mg/ml dispase (Roche Products), and 0.8 U/ml purified elastase (Worthington, Lakewood, NJ) was injected under the circumvallate papilla, and the epithelium was peeled away after 20 min. In some experiments, we injected an alternative enzyme, Protease XXIII (4 mg/ml; Sigma), dissolved in low-Na/Ca buffer (see above), and a small block of the tongue was incubated in the same buffer for 10–15 min before delamination. We did not observe a consistent difference between these enzyme mixtures with respect to the yield or health of isolated cells. The peeled epithelium was then redigested in the enzyme mixture for 2 min, followed by 1000 U/ml DNase I (Sigma) for 5 min. Isolated taste cells were then gently collected with a polished glass pipette (inner diameter, 80 μm) expelled into 5 μl drops of Tyrode’s buffer onto Cell-Tak (BD Biosciences, San Jose, CA)-coated coverslips and were allowed to settle before washing, harvesting, or recording.
Calcium imaging
Single-cell recordings.
To measure Ca2+ responses evoked by taste stimuli and/or by potassium depolarization, we adapted two different approaches to load taste cells with calcium-sensitive fluorescent dyes. In some cases, taste cells in the intact tongue were loaded iontophoretically with Calcium Green-1 dextran (3000 molecular weight) as described by Caicedo et al. (2002) and Richter et al. (2003). Dye-loaded taste cells were then isolated as outlined above. In other experiments, taste cells (not preloaded with dye) were collected and then incubated in Calcium Green-1 AM (10 μm) or fura-2 AM (10 μm) in Tyrode’s solution for 45–60 min before washing and recording. We used these alternative methods to test whether the dye-loading procedures had an impact on the integrity of cellular RNA. Functional data and RT-PCR results from either method for dye loading and for either calcium-sensitive dye did not differ significantly for the purposes of this report. Hence, data were pooled.
Lingual slice recordings.
To record taste cell responses in living isolated slices of lingual epithelium, vallate papillae were prepared and taste cells were loaded with Calcium Orange (CaO), as described fully by Richter et al. (2003). CaO was used to image functional responses because some of the taste cells in these experiments expressed green fluorescent protein (GFP) (see below). The use of appropriate excitation and emission filters eliminated spectral overlap between GFP and CaO, thereby allowing us to image calcium responses from taste cells expressing GFP.
Confocal imaging.
Calcium imaging was conducted using a Fluoview laser scanning confocal microscope and software (Olympus America, Melville, NY) for isolated cells loaded with Calcium Green dextran and for lingual slices (above). For isolated cells loaded with fura-2 AM, we used an imaging system based on an inverted microscope (IX70; Olympus America), cooled-CCD camera, and Imaging Workbench software (Indec Biosystems, Mountain View, CA). We recorded images at 3–5 s intervals. Stimuli were bath applied. The baseline period before stimulation was averaged to calculate Fo. For each time point, the change in fluorescence was calculated as ΔF/Fo and was considered a stimulus-evoked response if the ΔF/Fo was ≥5% for several successive data points. The average baseline signal fluctuation was ≤2%.
RT-PCR
To screen for expression of selected genes and to validate each pair of primers (supplemental Table 1, available at www.jneurosci.org as supplemental material), we performed RT-PCR on taste buds or delaminated nontaste lingual epithelium. RNA was purified from tissues using the RNA microprep kit and included a digestion with DNase I (Stratagene, La Jolla, CA). cDNA was synthesized using Superscript III reverse transcriptase (Invitrogen) as described previously (Richter et al., 2004). To validate the specificity of PCRs, we performed parallel reactions on cDNA from taste buds, nontaste lingual epithelium, and on water in place of template. In the case of the genes expressed at low abundance, such as the calcium channel subunits, we also verified the specificity of the single-cell RT-PCR by Southern blot hybridization with a previously sequenced DNA used as probe. Optimum annealing temperature for each primer pair was determined on a gradient in the iCycler (Bio-Rad, Hercules, CA). The template for each RT-PCR was limited to one taste bud equivalent of cDNA for 35 cycles only. PCR products obtained with taste cDNA for every primer pair were sequenced to further validate specificity. Primers were designed to span at least one intron and were positioned as close to the 3′ end as practical, unless there were known splice variants in the region. Primers of a pair were located within a single exon only in the case of synapsin II and calcium channel α1A (set B) because of unusually long final exons and, in the case of Tas2r105, an intronless gene.
Single-cell RT-PCR
Dissociated taste cells were individually collected under microscopic examination, either as “naive” cells (i.e., without dye loading and functional imaging) or after Ca2+ imaging. We verified under 200× magnification that only a single cell was collected in a minimum volume (≤20 nl) of Tyrode’s buffer, using 5- to 10-μm-diameter glass pipettes. Cells were expelled into a tube containing 50 μl of cell lysis buffer containing guanidine thiocyanate, β-mercaptoethanol, and 200 ng of polyinosinic acid, and the tip of the collection pipette was broken into the tube. Total cellular RNA was isolated using the Absolutely RNA Nanoprep kit (Stratagene). RNA was eluted from kit-supplied columns in 10 μl of Tris-HCl, pH 7.5, and was immediately denatured for 5 min at 65°C in the presence of oligo-dT(12–18) and dNTP. First-strand cDNA synthesis was then initiated with the addition of 8 μl of RT reaction mix and 200 U of Superscript III and then incubated for 60 min at 50°C. The resulting 20 μl of single-cell cDNA was divided as follows: 2 μl for β-actin and 5 μl each for SNAP25 and PLCβ2. Each PCR was performed in 20 μl for 45 cycles. The remaining 8 μl of each single-cell cDNA were used for preliminary screening PCRs for calcium channels and other genes (see Results, Genes expressed in presynaptic taste cells). Positive control reactions using cDNA from taste buds and negative controls (water substituted for cell sample before RNA purification) were run in parallel from master mixes.
RNA amplification followed by RT-PCR
T7 RNA amplification was performed using the MessageBOOSTER cDNA Synthesis kit for qPCR (MB051224; Epicentre, Madison, WI) essentially according to the instructions of the manufacturer. Briefly, single-cell RNA was purified as described above, and the volume of each eluted RNA sample was adjusted to 3 μl by evaporation in a Savant Speed-Vac (GMI, Ramsey, MN). First-strand cDNA was synthesized using a T7-oligo-dT anchor primer and Superscript III reverse transcriptase for 30 min at 50°C. Then, second-strand cDNA was synthesized with RNase H and DNA polymerase I, and the double-strand cDNA served as template in an in vitro transcription reaction using T7 RNA polymerase. The resulting amplified antisense RNA (aRNA) was treated with DNase I, purified in RNeasy MinElute spin columns (Qiagen, Valencia, CA), and reverse transcribed into first-strand cDNA using Superscript II and random hexamer primers for 1 h at 37°. Diluted cDNA (2–4% for each reaction) then served as a template in PCR analysis with primers for taste-specific markers (supplemental Table 1, available at www.jneurosci.org as supplemental material). The conditions for PCR were 94°C for 2 min, followed by 45 cycles of 94°C for 30 s, 57–60°C for 30 s, and 72°C for 30 s.
Immunostaining
We verified that GFP expression was an accurate marker for endogenous PLCβ2 expression in PLCβ2-GFP transgenic mice using immunofluorescence (Kim et al., 2006). Circumvallate papillae, fixed with 4% paraformaldehyde, were cryosectioned at 25 μm, and sections were incubated overnight with rabbit anti-PLCβ2 (1:1000; Santa Cruz Biotechnology, Santa Cruz, CA). We also immunostained tissues with rabbit anti-SNAP25 (1:500; AB1762; Chemicon, Temecula, CA), rabbit anti-neural cell adhesion molecule (NCAM) (1:500; AB5032; Chemicon), or rabbit anti-aromatic amino acid decarboxylase (AADC) (1:500; GTX30448; Genetex, San Antonio, TX). Thorough validation in taste tissue has been demonstrated previously for many of these antibodies, including anti-PLCβ2 (Kim et al., 2006), anti-NCAM (Yee et al., 2001), and anti-SNAP25 (Yang et al., 2000a). After three washes in buffer, sections immunostained for PLCβ2 were incubated in goat anti-rabbit IgG, conjugated to Alexa Fluor 594 (1:1000; Invitrogen). Immunostaining for SNAP25, NCAM, and AADC was amplified using tyramide following instructions provided with the kit [T-20925 (Invitrogen); 1:500 diluted goat anti-rabbit IgG, horseradish peroxidase conjugate, and Alexa Fluor 594–tyramide substrate, diluted 1:100]. Negative controls were processed in parallel in every experiment, with primary antibody omitted. No nonspecific fluorescence was detected (see Fig. 6D). Images were obtained with a Zeiss Microimaging (Thornwood, NY) Axioplan epifluorescence microscope using Axiovision version 3.0 software (for Nomarski differential interference contrast optics) and an Olympus America laser-scanning confocal microscope using Fluoview software (for GFP and immunofluorescence). We estimate a thickness of ∼3 μm for the optical sections taken from the confocal microscope.
Figure 6.

PLCβ2 protein is found in distinct cells from those expressing presynaptic proteins, SNAP25, NCAM, or AADC. A, B, PLCβ2 expression does not overlap significantly with SNAP25. In A, cryosections (25 μm) from circumvallate papillae from wild-type mice were double immunostained for SNAP25 (red, center) and PLCβ2 (green, left). The merged images (right) demonstrate lack of coexpression. In B, cryosections from a PLCβ2-GFP transgenic mouse were immunostained for SNAP25 (red). A similar lack of coexpression is evident (see merge, right). The apparent slight overlap at the apex of the taste bud in the merged image may be attributable to the convergence of the apical tips of several taste cells in the taste pore, combined with the ∼3 μm optical thickness of the confocal images. C, Nonoverlap of PLCβ2 and NCAM expression, revealed by immunostaining for NCAM on tissue from PLCβ2-GFP transgenic mice. Note that NCAM immunostaining of taste cells is punctate, as observed previously (Nolte and Martini, 1992). D, Nonoverlap of PLCβ2 and AADC expression, as in B and C. E, Negative control sections immunostained and photographed in parallel with B–D above but omitting the primary antibody. In B–E, the left column shows GFP fluorescence (from PLCβ2-GFP transgenic mice), superimposed on a Nomarski differential interference contrast micrograph of a taste bud. The middle column shows immunostaining for SNAP25, NCAM, or AADC. The right column shows GFP fluorescence and immunofluorescence merged. ab, Antibody. Scale bar, 10 μm.
Statistical analyses
Data on the expression of individual genes in single-cell aRNA/RT-PCR was compared between two cell populations using either a χ2 test or the more stringent two-tailed Fisher’s exact test. The same tests were also used on data comparing the occurrence of depolarization-triggered Ca2+ responses in GFP-expressing and GFP-lacking cells in lingual slices from transgenic mice. All statistics were calculated using Prism version 4.0 (GraphPad Software, San Diego, CA).
Results
Taste cells respond to either tastants or depolarization
We hypothesize that taste buds contain separate populations of chemosensory receptor cells and presynaptic cells (i.e., cells that form synapses with gustatory afferent nerve terminals). As a first step toward testing this hypothesis functionally, we applied Ca2+ imaging to analyze stimulus-evoked responses in individual isolated taste cells (Fig. 1A). We recorded responses to a mixture of prototypic taste stimuli and to potassium depolarization. From an estimated 1032 isolated, imaged cells, 53 responded to depolarization with 50 mm KCl with an increase in intracellular calcium and 34 to stimulation with a mixture of a sweet-tasting (2 mm saccharin) and a bitter-tasting (100 μm cycloheximide) compound (Fig. 1B,C). [Saccharin and cycloheximide were selected because they are effective in eliciting Ca2+ responses in taste cells in a semi-intact slice preparation (Caicedo et al., 2002) and in isolated taste buds and cells (Bernhardt et al., 1996; Huang et al., 2005).] None of the isolated cells responded to both KCl depolarization and taste stimulation (Fig. 1D). As noted, the majority of cells tested failed to generate responses to either stimuli. Because the C57BL/6J strain is known to be highly sensitive to both cycloheximide and saccharin (Bachmanov et al., 2001; Boughter et al., 2005), we considered what other factors might contribute to the low incidence of responses. First, a large fraction of cells in the taste bud are thought to function as glial-like or supporting cells and lack depolarization-activated Ca2+ fluxes [e.g., type I cells by Yee et al. (2001); Medler et al., (2003)]. Additionally, cells in our analysis may have not responded because our stimulus mixture was limited to only two tastants (saccharin and cycloheximide), the cell was unhealthy, or a combination of these factors. We interpreted that cells responding to the tastant mixture represent gustatory receptor cells, whereas cells responding to depolarization are putative presynaptic cells. This interpretation was tested further by gene expression profiling (below).
Figure 1.

Taste cells respond with a transient elevation of Ca2+ to potassium depolarization or to taste stimulation but not to both. A, An example of an isolated taste cell (arrow) loaded with Calcium Green-1 dextran and viewed in bright-field illumination (left) or epifluorescence (right) to image Ca2+. Scale bars, 20 μm. B, Summary of all data from functional testing. Five percent (53 of 1032) of cells responded to KCl depolarization with a Ca 2+ transient, whereas 3% (34 of 1032) responded to the tastant mix. Of all 1032 cells tested with KCl and the tastant mix, none generated a Ca2+ response to both stimuli. The two populations were distinct and nonoverlapping. Cells responding to KCl depolarization, provisionally identified as presynaptic cells in this report, are shown by a shaded bar. C, Representative trace from a cell in which a Ca2+ response was evoked by potassium depolarization (50 mm KCl) but not by tastant stimulation [2 mm saccharin (sac) plus 100 μm cycloheximide (chx)], shown as bars above the trace. Across the population, the order of stimulus presentation did not alter the result. D, Representative trace from a cell in which taste stimulation but not potassium depolarization evoked calcium responses. Stimuli were presented as in C.
Taste cells express either PLCβ2 or SNAP25
Because the functional responses of isolated taste cells fell into two distinct classes, we asked whether key molecular markers might also be expressed in two categories of cells. For the postulated presynaptic (i.e., KCl-responsive) cells, we selected SNAP25 because it is known to be associated with synapses in general and with taste cell afferent synapses in particular (Yang et al., 2000a). For receptor cells, we selected PLCβ2 because it is a downstream signaling enzyme shared by known taste GPCRs (Rossler et al., 1998; Zhang et al., 2003). We collected individual taste cells and processed the extracted RNA for single-cell RT-PCR for β-actin, SNAP25, and PLCβ2. Examples of harvested cells and the resulting RT-PCR data are shown in Figure 2, A and B. The presence of β-actin RT-PCR product from 10% of cell cDNA served as an indication that RNA of sufficient quality and quantity was recovered from individual cells. Of 51 β-actin-positive cells, 16 expressed SNAP25 (31%), whereas 10 expressed PLCβ2 (20%). Only one cell expressed both SNAP25 and PLCβ2 (Fig. 2C). These data demonstrate that most taste cells express SNAP25, PLCβ2, or neither. Coexpression of these markers is rare (∼2% of cells tested).
Figure 2.
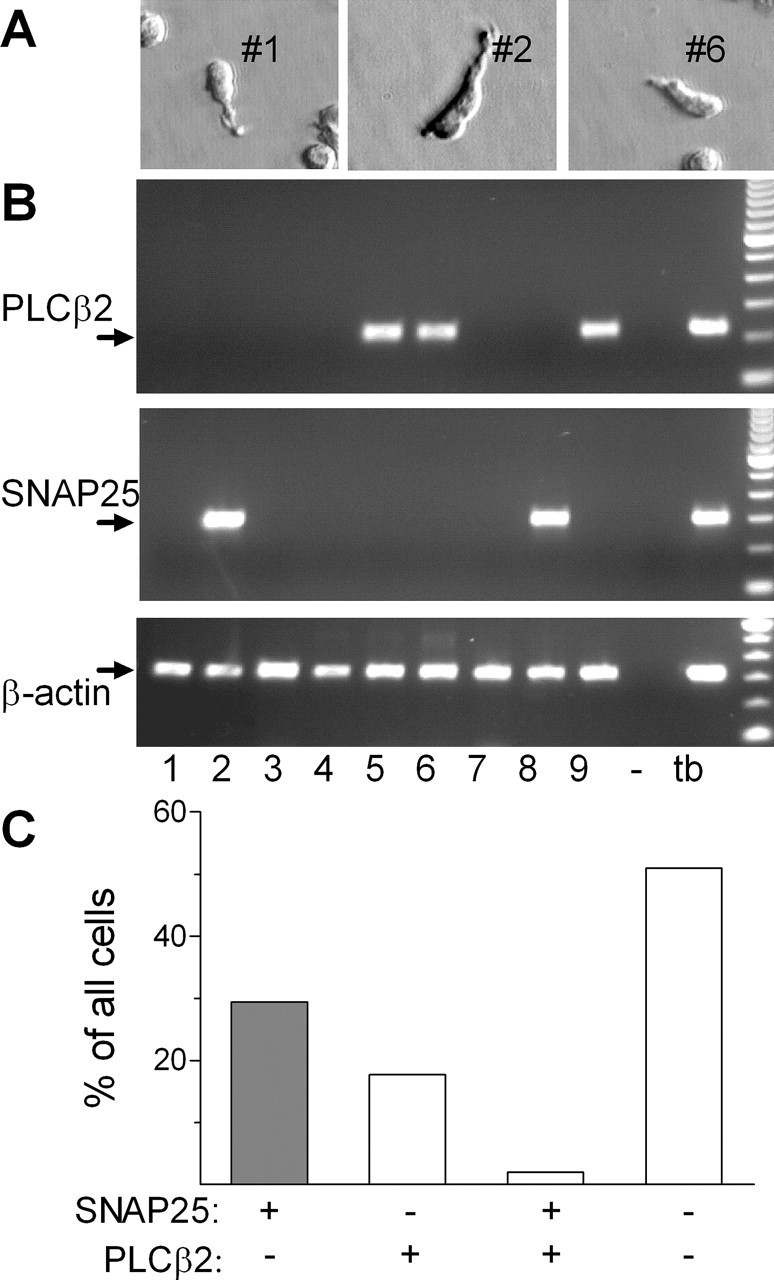
Single-cell RT-PCR reveals that individual taste cells express PLCβ2 or SNAP25, with little overlap between the two. A, Images of isolated single cells collected for RT-PCR analysis. Numbers next to cells correspond to those below the gels in B. B, Ethidium-stained agarose gels of RT-PCR for PLCβ2, SNAP25, and β-actin in nine individual cells (1–9). RT-PCR for β-actin served as a control to validate the quality of each sample. The lane marked with “–” was processed for all steps from RNA extraction to PCR but without including a cell. A positive control for RT-PCR was performed with taste bud cDNA (tb), which is expected to include sequences for all expressed genes. C, Summary of RT-PCR data from 51 taste cells, analyzed as above. Cells expressing SNAP25 and not PLCβ2, identified as presynaptic cells in this report, are shown by a shaded bar. Only a single cell showed RT-PCR product for both PLCβ2 and SNAP25. Approximately one-half of analyzed cells showed neither of these two taste-selective markers.
Physiological responses correlate with molecular expression
Our next step was to test whether the two classes of cells determined by functional imaging mapped onto the two categories determined by expression of SNAP25 and PLCβ2. We recorded calcium responses to 50 mm KCl and the tastant mix (2 mm saccharin plus 100 μm cycloheximide) from individual taste cells as described above, followed by single-cell RT-PCR for β-actin, SNAP25, and PLCβ2 from the same cells. Although the sample size was limited because of a low incidence of functional responses (as noted above), combined with the difficulty with degradation of RNA from taste cells during calcium imaging, the results nonetheless were clear-cut. From a total of 22 cells analyzed, every cell that expressed SNAP25 responded to KCl depolarization (n = 7), and every cell that expressed PLCβ2 responded to tastant stimulation (n = 3). [We noted that four KCl-responsive cells and eight tastant-responsive cells expressed neither SNAP25 nor PLCβ2. We expect that many of these apparent nulls were attributable to degradation of RNA during dye loading and functional imaging; however, we cannot rule out the possibility that these functionally identified cells may represent additional molecular classes of taste cells.] The results confirmed that there was no overlap in functional responses between KCl depolarization and taste stimulation, as observed in the first series of experiments and no overlap in expression of SNAP25 and PLCβ2 as in the second series. Furthermore, SNAP25 appeared to be expressed only in depolarization-responsive cells, whereas PLCβ2 expression appeared only in tastant-responsive cells.
To confirm this interpretation for a larger number of cells and with an independent methodology, we took advantage of transgenic mice in which cells expressing PLCβ2 were genetically tagged with GFP (Kim et al., 2006). Green fluorescent protein was expressed under the control of 2.9 kb of the mouse PlCb2 gene promoter. Immunocytochemical analysis of taste papillae from the 5288 line of transgenic mice (Kim et al., 2006) showed that PLCβ2 immunoreactivity and GFP expression showed near-perfect overlap (Fig. 3A) (i.e., the transgene was expressed identically to the endogenous gene). We then examined calcium responses in taste buds from the PLCβ2-GFP transgenic mice. By using a well established slice preparation in which taste cells are maintained in a more native environment (Caicedo et al., 2002), we avoided problems with cell viability after isolation. We loaded taste cells in circumvallate papillae with Calcium Orange (a calcium-sensitive fluorescent dye whose spectral characteristics allow imaging in cells expressing GFP), prepared 100 μm vibratome sections of taste papillae, and imaged taste cells with confocal microscopy (Fig. 3B). Bath-applied 50 mm KCl elicited a transient elevation of intracellular Ca2+ in 22% of CaO-loaded taste cells (Fig. 3C) (Caicedo and Roper, 2001; Richter et al., 2003). Importantly, responses to potassium depolarization were detected only in taste cells lacking GFP (31 of 100 cells), that is, in cells that do not express PLCβ2. No cells expressing GFP (0 of 31) responded to potassium depolarization, yielding a highly significant difference between the two populations (Fig. 3C) (p < 0.0001; two-tailed Fisher’s exact test). Cells expressing GFP did respond to stimulation with the bitter tastant cycloheximide (Fig. 3C), indicating that the presence of GFP, per se, does not occlude Ca2+ signals. These data confirm and extend the above studies on isolated single cells and show that potassium depolarization activates cells that express SNAP25 and lack PLCβ2. A separate population of taste cells that expresses PLCβ2 is sensitive to tastants.
Figure 3.

Taste cells expressing PLCβ2 (i.e., receptor cells) do not respond to KCl depolarization. A, Cryosections of fixed circumvallate papilla from a PLCβ2-GFP mouse demonstrate accurate expression of GFP. Sections were immunostained with anti-PLCβ2 (red). Confocal micrographs show the following: Aa, PLCβ2 immunofluorescence; Ab, GFP fluorescence; Ac, merged image, with near-perfect overlap (yellow–orange). B, Living tissue showing a lingual slice preparation from a PLCβ2-GFP mouse in which vallate taste cells were loaded with the Ca2+ indicator CaO. Superimposed fluorescence from CaO (red) and GFP (green) reveals one cell that expresses GFP and is also loaded with CaO dye (yellow, arrow). Other cells are either dye loaded but do not express GFP (red) or express GFP but are not dye-loaded (green). C, Taste cell responses (ΔCa2+) were recorded in lingual slice preparations of the circumvallate papilla from PLCβ2-GFP mice. Preparations were sequentially stimulated with the bitter tastant cycloheximide (chx) and depolarized with 50 mm KCl. The traces show superimposed responses from two cells lacking GFP (black) and two GFP-labeled taste cells (green). Bars below traces indicate the stimulation. Responses to depolarization were only observed in cells lacking GFP. We recorded from 131 CaO-loaded taste cells in 13 slices from four PLCβ2-GFP transgenic mice. None of the 31 dye-loaded cells that were GFP positive responded to K+ depolarization. In contrast, K+ depolarization evoked responses in 31 of 100 cells lacking GFP. The difference in the frequency of KCl responsivity between the GFP-expressing and nonexpressing cells is highly significant (p < 0.001; two-tailed Fisher’s exact test). pos, Positive; neg, negative.
Genes expressed in presynaptic taste cells
Considerable recent effort has focused on molecular characterization of tastant-responsive cells and the transduction pathways from molecular receptors to the production of tastant-evoked Ca2+ signals (Huang et al., 1999; Perez et al., 2002). However, much less is known about the cells in taste buds that possess synapses (i.e., those expressing SNAP25). To understand the significance of these presynaptic cells, we sought to identify additional genes expressed in them. To select appropriate candidates for gene expression profiling in single cells, we first screened a number of candidate genes using RT-PCR on whole taste buds as described next.
Voltage-gated calcium channels
The first class of genes that we examined consisted of the voltage-gated calcium channels because these typically are essential for neurotransmitter exocytosis and for producing the depolarization-evoked calcium transients that we and others have observed in taste cells. There are 10 known genes for the channel-forming (α1) subunits of voltage-gated calcium channels (Catterall, 2000; Yu and Catterall, 2004). We focused on the seven high-threshold activated channels (α1A–α1F, α1S) because low-threshold T-type channels (α1G–α1I) with their rapidly inactivating currents are less likely to be responsible for the major presynaptic calcium signal. We designed primer pairs for each of these and used them for RT-PCR on RNA extracted from taste buds and adjacent nontaste lingual epithelium. This initial screening indicated that sequences corresponding to α1A and α1B (typical presynaptic P/Q- and N-type channels, respectively) and α1C (a widespread L-type channel) were preferentially expressed in taste buds relative to nontaste lingual epithelium (Fig. 4A). The α1D subunit (a neuroendocrine L-type channel) was expressed in both taste and nontaste lingual epithelium. In contrast, α1E (the R-type channel), α1F (a retinal L-type channel), and α1S (the skeletal L-type channel) were expressed at very low levels or not at all (results not shown).
Figure 4.

RT-PCR for additional presynaptic genes expressed in taste buds. A, RT-PCR for three voltage-gated calcium channel α1 subunits. The templates used were cDNA from taste bud (tb), nontaste lingual epithelium (nt), water as a negative control (−), and brain (br) as a positive control. Bands of the expected sizes for each gene (430 bp for α1A; 688 bp for α1B; 596 bp for α1C) are indicated on the left. The last lane on the right is a 100 bp ladder. B, RT-PCR for NCAM, GAD1, and synapsin II using cDNA templates as in A. Bands of the expected sizes for each gene (228 bp for NCAM; 240 bp for GAD1; 268 bp for synapsin II) are indicated on the left. C, RT-PCR for the neuronal (490 bp) and non-neuronal (493 bp) isoforms of AADC, using cDNA templates as in A. In addition, we used kidney cDNA (K) as a positive control template for the non-neuronal (non-neuro) form. The neuronal form is not expressed in kidney (Jahng et al., 1996).
Next, we conducted a preliminary series of RT-PCRs on single-cell cDNAs (as in Fig. 2). One of the high-threshold calcium channels, α1A, was found to be expressed in many of the same cells as SNAP25. In contrast, α1B was detected in only 1 of 33 cells, and this cell expressed neither SNAP25 nor PLCβ2 (results not shown). We were unable to detect α1C in single-cell cDNA, suggesting that its expression level per cell may be low. Based on these findings, α1A was selected for the detailed analyses of amplified RNA from single taste cells (see below).
AADC
Physiological analyses have suggested that taste cells synthesize, take up, and release biogenic amine neurotransmitters, including serotonin and norepinephrine (Nagai et al., 1996; Herness et al., 2002; Kaya et al., 2004; Huang et al., 2005). Although the precise role of these neurotransmitters in taste signaling remains to be established, serotonin for one has been localized to synapses in taste buds (Takeda and Kitao, 1980). AADC (also called DOPA decarboxylase), is a biosynthetic enzyme common to the pathways for serotonin, dopamine, norepinephrine, and epinephrine. mRNA for AADC is expressed as neuronal and non-neuronal isoforms by transcription from two alternate promoters (Jahng et al., 1996). We screened whole taste buds by RT-PCR and found robust, taste-selective expression of the neuronal form. No RT-PCR product was detected for the non-neuronal form (Fig. 4C). Hence, AADC was included in the single-cell profiling from amplified RNA below.
Glutamic acid decarboxylase
Although the evidence is less strong than for the biogenic amines, the inhibitory neurotransmitter GABA has also been implicated in taste bud function (Nagai et al., 1998; Cao et al., 2005; Eram and Michel, 2005). GABA is synthesized through the action of one of the two isoforms of glutamic acid decarboxylase (GAD1 and GAD2). By RT-PCR on whole taste buds, we detected expression of one of these genes, GAD1, in a taste bud-selective manner (Fig. 4B) and thus this gene was also included in our profiling of amplified RNA from single cells.
NCAM and synapsin
Many neuronal cells and some taste cells (Nolte and Martini, 1992) express NCAM, a surface glycoprotein involved in homophilic adhesion. By RT-PCR, we detected robust expression of NCAM in taste buds, although it was not seen in nontaste lingual epithelium (Fig. 4B). Finally, we also selected one additional synapse-related protein, synapsin II, that is associated with the membrane of synaptic vesicles (Südhof, 2004). By RT-PCR, we detected robust expression of synapsin II in taste buds (Fig. 4G).
Taste transduction proteins
Finally, to confirm that cells expressing PLCβ2 were indeed taste receptor cells, as postulated, we tested for expression of several well characterized components of the taste transduction cascade. These included the following: T2R5, a bitter taste receptor (Chandrashekar et al., 2000), T1R3, a component of some sweet and umami receptors (Nelson et al., 2001, 2002), IP3R3, a calcium-release channel/inositol triphosphate receptor (Miyoshi et al., 2001), and TRPM5, a cell surface ion channel (Perez et al., 2002). Primers for each of these were validated with taste bud and nontaste cDNA (data not shown) and were then included in the profiling below.
Expression profiles of individual cells
We next wanted to determine whether the expression of any of the above synapse-related genes was associated specifically with the SNAP25-expressing cells that we defined functionally in this study. We used a strategy of single-cell isolation followed by RNA amplification (Kacharmina et al., 1999). This allowed us to analyze the expression of a much larger number of genes than was possible by the direct RT-PCR method used above. We isolated single taste cells, purified cellular RNA, converted it to double-strand cDNA, transcribed antisense RNA, and then again converted this to single-strand cDNA. The resulting cDNA was used as template in PCRs for β-actin, PLCβ2, and SNAP25. Of 53 individual cells that tested positive for β-actin, we selected 10 cells that were positive for PLCβ2 and another 10 that were positive for SNAP25. Only one cell in this series (1 of 53) expressed both PLCβ2 and SNAP25. We included this cell in the detailed analysis below. The aRNA from these 21 cells was then subjected to RT-PCR for the genes selected above. Figure 5A shows an example of aRNA/RT-PCR results from one cell, and a full compilation of results from the 21 cells is shown in Figure 5B.
Figure 5.

Gene expression profiling of aRNA from individual taste cells supports their classification as receptor cells and presynaptic cells. A, An example of RT-PCR data based on aRNA from a typical profiled cell. Each gene was tested using 4% of the single-cell cDNA. This cell, which is 12 in B, clearly expresses the presynaptic genes but none of the chemosensory transduction genes. B, Compilation of data from 21 cells: each row represents a single cell, and each column after the first represents a different gene. The table shows 10 cells that expressed PLCβ2 (1–10), 10 cells that expressed SNAP25 (12–21), and one cell that expressed both (11). · denotes that RT-PCR product was detected, and − denotes the apparent lack of expression in parallel reactions. C, Histogram of the incidence of expression of each profiled gene from single cells expressing PLCβ2 (white bars) and cells expressing SNAP25 (gray bars). The incidence of expression of genes across the two populations was nonrandom when evaluated in the two-tailed Fisher’s exact test. Statistical significances were ∗p ≤ 0.05, ∗∗p ≤ 0.01, or ∗∗∗p ≤ 0.001. (Expression patterns of SNAP25 and PLCβ2 are not included in the statistics because they define the two populations.) The single double-expressing cell (11 from table) is shown as a separate set of bars (hatched) and was not included in the statistics because of the low incidence of this type (≤2%).
As expected, PLCβ2-positive cells expressed IP3R3 (11 of 11 cells) and TRPM5 (10 of 11 cells). Furthermore, 6 of 11 of these cells also expressed a known taste receptor, either T1R3 or T2R5. Thus, we conclude that most or all PLCβ2-expressing cells can be designated “taste receptor cells” as postulated. None of the critical transduction genes, Trpm5, Tas1r3, or Tas2r105, was expressed in any of the SNAP25-positive/PLCβ2-negative cells. Conversely, IP3R3 was found in half of the SNAP25-positive cells.
In contrast to the above results on PLCβ2-positive taste receptor cells, 10 of 11 of the SNAP25-positive cells expressed the neuronal surface adhesion protein NCAM. Most SNAP25-positive cells also expressed the synthetic enzymes for biogenic amines and GABA neurotransmitters, AADC and GAD1, respectively. One-half or more of the SNAP25-positive cells also expressed the P/Q-type presynaptic voltage-gated calcium channel α1A and/or as the synaptic vesicle protein synapsin II. It is significant that none of these mRNAs was detected in any of the cells expressing PLCβ2. In summary, the gene expression profiles displayed two distinct cell types that we designate “receptor cells” and “presynaptic cells” (Fig. 5C, white and gray bars, respectively). The incidence of cells expressing both SNAP25 and PLCβ2 is low (overall, 2 of 104 cells).
As an additional test of the genetic profiling (presented in Fig. 5), we immunostained sections of circumvallate papillae to test whether protein expression also segregated into groups of taste cells. Specifically, we took advantage of the PLCβ2-GFP transgenic line of mice to test whether the receptor cell marker PLCβ2 was coexpressed with protein markers for presynaptic cells or whether they were truly expressed in separate cells. These mice allowed us to use robust, well characterized primary antibodies (raised in rabbit). The results were unambiguous: expression of GFP (and, by inference, PLCβ2) did not overlap with either SNAP25, NCAM, or AADC (Fig. 6). Antibodies to other protein markers from our genetic profiling results did not yield sufficiently distinct or specific immunostaining in taste buds to ascertain the extent of coexpression with PLCβ2.
Discussion
Our results demonstrate the existence of at least two separate classes of taste cells. One class expresses neuronal and synaptic proteins, including SNAP25, NCAM, synapsin II, and the presynaptic voltage-gated calcium channel α1A. These cells also express GAD1 and AADC, key enzymes in the synthesis of GABA and aminergic neurotransmitters, respectively. A separate class of taste bud cells expresses chemosensory signaling molecules, including taste receptors, PLCβ2, and TRPM5. In physiological tests using calcium imaging, taste cells positive for synaptic proteins responded to potassium depolarization but not tastants. Conversely, cells positive for PLCβ2 responded to tastant stimulation but not to depolarization. That is, the two classes of cells based on molecular and functional properties were separate and nonoverlapping. In the lexicon of taste cell morphotypes, receptor/PLCβ2-positive cells would be approximately equivalent to type II taste cells, whereas synaptic/SNAP25-positive cells would approximate type III taste cells (Yee et al., 2001). This concept extends a previous interpretation based on immunocytochemical and electron microscopic evidence (Yee et al., 2001, 2003; Clapp et al., 2004; Yang et al., 2004). Notably, the presence of synapses in electron micrographs was one of the identified characteristics of type III cells (Murray, 1974). Taste buds also contain one or more classes of supporting and progenitor cells.
Taste cells positive for PLCβ2 consistently expressed genes that have been tied previously to chemosensory transduction. These include TRPM5, a transient receptor potential ion channel that plays a critical but as yet poorly understood role in taste transduction for bitter, sweet, and umami tastants (Perez et al., 2002; Zhang et al., 2003; Damak et al., 2006). The taste receptors T1R3 and T2R5 were found in separate cells and always were coexpressed with PLCβ2, as suggested by previous immunocytochemical and in situ hybridization analyses (Adler et al., 2000; Miyoshi et al., 2001; Zhang et al., 2003). The intracellular channel IP3R3 links receptor-triggered PLCβ2 activation to calcium release from stores, and we detected it in all PLCβ2-positive cells. Expression of IP3R3 was also seen in half of the SNAP25-positive cells analyzed, suggesting that, in nonreceptor cells, IP3R3 may play additional roles, as suggested previously (Kataoka et al., 2004). In the rat, IP3R3 has been reported to be expressed in NCAM-expressing cells only infrequently (Clapp et al., 2004), whereas we find the incidence of this overlap substantial in the mouse.
We detected the P/Q-type voltage-gated calcium channel subunit α1A in half of the tested presynaptic cells but none of the receptor cells. High-threshold voltage-gated calcium channels, typically of the N, P/Q, or R types, are a major component of calcium-dependent transmitter release at presynaptic sites (Dunlap et al., 1995). Our failure to detect α1A in all presynaptic cells may be attributable to the existence of multiple subtypes of SNAP25-expressing cells. Alternatively, mRNA for α1A or other calcium channel transcripts may be expressed at lower copy number per cell, making them more difficult to detect. Our results are mostly consistent with those of Medler et al. (2003), who showed using patch-clamp analyses that voltage-activated calcium currents were present in cells immunopositive for NCAM. However, we found no molecular parallels with the subset of type II cells (presumably, receptor cells) reported to have voltage-activated calcium currents (Medler et al., 2003). It is possible that the antigen A immunoreactivity that was used in that previous study may have labeled some nonreceptor cells as well.
In the present study, we focused on receptor cells for sweet, bitter, and umami tastants. We showed previously (Richter et al., 2003, 2004) that Ca2+ responses elicited by sour tastants are consistently found in taste cells with voltage-gated calcium currents (i.e., presynaptic cells according to the present study). Thus, some of the presynaptic cells in taste buds may well be sour sensors. The present distinction between receptor versus presynaptic cells may need to be expanded to accommodate sour (and possibly salty) taste detection once evidence correlating function with molecular expression of diagnostic genes is available at the level of individual cells.
Our molecular profiling of the SNAP25-expressing taste cells provides some insights into their role(s) in taste buds. First, we noted that every one of these cells expressed NCAM, a glycoprotein member of the immunoglobulin superfamily. NCAM is associated with nerve-target recognition, synaptogenesis, and synaptic plasticity, processes that are critical in the continually renewing taste neuroepithelium (Smith et al., 1993). Second, we observed that SNAP25 cells very often express AADC and GAD1, enzymes essential in the biosynthesis of biogenic amine and GABA neurotransmitters, respectively. A considerable body of literature substantiates that small numbers of cells within taste buds selectively take up and accumulate the serotonin precursor 5-hydroxytryptophan and synthesize serotonin under physiological conditions (Takeda and Kitao, 1980; Nagai et al., 1998). Recent physiological studies using biosensors have demonstrated serotonin release from taste buds after stimulation with tastants (Huang et al., 2005). Sensitivity to serotonin may lie in the afferent nerve terminal or on other taste cells or both, as suggested by patch-clamp analyses (Kaya et al., 2004). Norepinephrine too has been implicated in taste bud function (Herness et al., 2002). Although direct evidence for GABA in taste bud function is limited (Cao et al., 2005), recent recordings from taste afferent nerves do suggest the possibility of inhibitory signals (Danilova et al., 2002; Frank et al., 2005). In summary, although many of these neurotransmitters have been implicated in some manner, we present the first evidence that biogenic amines and GABA may be synthesized and exocytosed from the same cells that have structural components of synapses, such as SNAP25 and synapsin II. Recently, it was shown ATP is a neurotransmitter essential for signaling to the taste afferent nerve (Finger et al., 2005). The mechanism for ATP release from taste buds is presently not known, but it will be important to search for molecular markers for this pathway among taste cell types.
Only 2 of 103 cells analyzed by single-cell RT-PCR showed overlapping expression of both SNAP25 and PLCβ2. It is possible that these infrequent cells are an artifact generated by collecting portions of two cells during cell harvesting. Alternatively, they may represent occasionally imprecise gene expression, possibly as a consequence of cell renewal in the taste bud. We cannot rule out the possibility that these rare examples represent cells transforming from one functional class into the other, as suggested previously (for review, see Yee et al., 2001). We conclude that, in the main, there are separate cells for sensing bitter, sweet, and umami taste stimuli (i.e., PLCβ2 receptor cells) and for transmitting signals to gustatory afferent fibers (i.e., SNAP25 synaptic cells), at least via conventional synapses. The existence of these two functional classes of taste cells leads to the question of how taste signals are transmitted to the gustatory afferent nerve. The simplest model would have a taste receptor cell form a synapse with an afferent nerve. However, as we show here, PLCβ2 cells lack synaptic vesicle proteins (SNAP25 and synapsin II), and we found no functional evidence for depolarization-induced Ca2+ influx, a hallmark of typical presynaptic cells. One possible resolution is that gustatory receptor cells directly excite sensory afferent fibers via nonconventional synapses, as proposed recently (Clapp et al., 2004). Such nonconventional synapses remain to be identified functionally and might use very different molecules and functional pathways than the ones we examined here. Alternatively, cells may communicate within the taste bud, for instance, transferring signals from receptor cells to presynaptic cells and then on to the nerve (Herness et al., 2002; Kaya et al., 2004). Mechanisms for such intragemmal communication remain an important but unresolved mystery. If indeed sensory information passes from receptor cells to presynaptic cells within taste buds, this presents the possibility that signals originating in receptor cells of different chemosensitivity (say, umami and bitter) may converge onto and thus be integrated in common presynaptic cells. Such an interpretation could resolve a major conundrum in the literature: whether taste cells are narrowly or broadly tuned (Gilbertson et al., 2001; Caicedo et al., 2002; Zhang et al., 2003). That is, receptor cells could be highly tuned, and presynaptic cells less so.
Note added in proof.
A parallel study using calcium imaging on taste cells from Trpm5-GFP mice was published recently and supports our findings (Clapp et al., 2006).
Footnotes
*R.A.D. and G.D. contributed equally to this work.
This work was supported by National Institutes of Health–National Institute on Deafness and Other Communication Disorders Grants 2R01 DC00374 (S.D.R.) and 1R21 DC05500 and 1R01 DC06308 (N.C.). We thank Naomi Rosenkranz and Kristina Trubey for help with early experiments in this project.
References
- Adler E, Hoon MA, Mueller KL, Chandrashekar J, Ryba NJ, Zuker CS (2000). A novel family of mammalian taste receptors. Cell 100:693–702. [DOI] [PubMed] [Google Scholar]
- Akabas MH, Dodd J, Al Awqati Q (1988). A bitter substance induces a rise in intracellular calcium in a subpopulation of rat taste cells. Science 242:1047–1050. [DOI] [PubMed] [Google Scholar]
- Bachmanov AA, Tordoff MG, Beauchamp GK (2001). Sweetener preference of C57BL/6ByJ and 129P3/J mice. Chem Senses 26:905–913. [DOI] [PMC free article] [PubMed] [Google Scholar]
- Bernhardt SJ, Naim M, Zehavi U, Lindemann B (1996). Changes in IP3 and cytosolic Ca2+ in response to sugars and non-sugar sweeteners in transduction of sweet taste in the rat. J Physiol (Lond) 490:325–336. [DOI] [PMC free article] [PubMed] [Google Scholar]
- Boughter JD Jr, Raghow S, Nelson TM, Munger SD (2005). Inbred mouse strains C57BL/6J and DBA/2J vary in sensitivity to a subset of bitter stimuli. BMC Genet 6:36. [DOI] [PMC free article] [PubMed] [Google Scholar]
- Caicedo A, Roper SD (2001). Taste receptor cells that discriminate between bitter stimuli. Science 291:1557–1560. [DOI] [PMC free article] [PubMed] [Google Scholar]
- Caicedo A, Kim KN, Roper SD (2002). Individual mouse taste cells respond to multiple chemical stimuli. J Physiol (Lond) 544:501–509. [DOI] [PMC free article] [PubMed] [Google Scholar]
- Cao Y, Zhao F, Herness MS (2005). GABA as an inhibitory transmitter in the taste bud. Chem Senses 30:A230. [DOI] [PubMed] [Google Scholar]
- Catterall WA (2000). Structure and regulation of voltage-gated Ca2+ channels. Annu Rev Cell Dev Biol 16:521–555. [DOI] [PubMed] [Google Scholar]
- Chandrashekar J, Mueller KL, Hoon MA, Adler E, Feng L, Guo W, Zuker CS, Ryba NJ (2000). T2Rs function as bitter taste receptors. Cell 100:703–711. [DOI] [PubMed] [Google Scholar]
- Chaudhari N, Landin AM, Roper SD (2000). A metabotropic glutamate receptor variant functions as a taste receptor. Nat Neurosci 3:113–119. [DOI] [PubMed] [Google Scholar]
- Clapp TR, Yang R, Stoick CL, Kinnamon SC, Kinnamon JC (2004). Morphologic characterization of rat taste receptor cells that express components of the phospholipase C signaling pathway. J Comp Neurol 468:311–321. [DOI] [PubMed] [Google Scholar]
- Clapp TR, Medler KF, Damak S, Margolskee RF, Kinnamon SC (2006). Mouse taste cells with G protein-coupled taste receptors lack voltage-gated calcium channels and SNAP-25. BMC Neurosci in press. [DOI] [PMC free article] [PubMed]
- Damak S, Rong M, Yasumatsu K, Kokrashvili Z, Perez CA, Shigemura N, Yoshida R, Mosinger B Jr, Glendinning JI, Ninomiya Y, Margolskee RF (2006). Trpm5 null mice respond to bitter, sweet, and umami compounds. Chem Senses 31:253–264. [DOI] [PubMed] [Google Scholar]
- Danilova V, Danilov Y, Roberts T, Tinti JM, Nofre C, Hellekant G (2002). Sense of taste in a new world monkey, the common marmoset: recordings from the chorda tympani and glossopharyngeal nerves. J Neurophysiol 88:579–594. [DOI] [PubMed] [Google Scholar]
- Dotson CD, Roper SD, Spector AC (2005). PLCβ2-independent behavioral avoidance of prototypical bitter-tasting ligands. Chem Senses 30:593–600. [DOI] [PMC free article] [PubMed] [Google Scholar]
- Dunlap K, Luebke JI, Turner TJ (1995). Exocytotic Ca2+ channels in mammalian central neurons. Trends Neurosci 18:89–98. [PubMed] [Google Scholar]
- Eram M, Michel WC (2005). Morphological and biochemical heterogeneity in facial and vagal nerve innervated taste buds of the channel catfish, Ictalurus punctatus. J Comp Neurol 486:132–144. [DOI] [PubMed] [Google Scholar]
- Finger TE, Danilova V, Barrows J, Bartel DL, Vigers AJ, Stone L, Hellekant G, Kinnamon SC (2005). ATP signaling is crucial for communication from taste buds to gustatory nerves. Science 310:1495–1499. [DOI] [PubMed] [Google Scholar]
- Frank ME, Formaker BK, Hettinger TP (2005). Peripheral gustatory processing of sweet stimuli by golden hamsters. Brain Res Bull 66:70–84. [DOI] [PubMed] [Google Scholar]
- Gilbertson TA, Boughter JD Jr, Zhang H, Smith DV (2001). Distribution of gustatory sensitivities in rat taste cells: whole-cell responses to apical chemical stimulation. J Neurosci 21:4931–4941. [DOI] [PMC free article] [PubMed] [Google Scholar]
- Herness S, Zhao FL, Kaya N, Lu SG, Shen T, Sun XD (2002). Adrenergic signalling between rat taste receptor cells. J Physiol (Lond) 543:601–614. [DOI] [PMC free article] [PubMed] [Google Scholar]
- Huang L, Shanker YG, Dubauskaite J, Zheng JZ, Yan W, Rosenzweig S, Spielman AI, Max M, Margolskee RF (1999). Ggamma13 colocalizes with gustducin in taste receptor cells and mediates IP3 responses to bitter denatonium. Nat Neurosci 2:1055–1062. [DOI] [PubMed] [Google Scholar]
- Huang YJ, Maruyama Y, Lu KS, Pereira E, Plonsky I, Baur JE, Wu D, Roper SD (2005). Mouse taste buds use serotonin as a neurotransmitter. J Neurosci 25:843–847. [DOI] [PMC free article] [PubMed] [Google Scholar]
- Jahng JW, Wessel TC, Houpt TA, Son JH, Joh TH (1996). Alternate promoters in the rat aromatic l-amino acid decarboxylase gene for neuronal and nonneuronal expression: an in situ hybridization study. J Neurochem 66:14–19. [DOI] [PubMed] [Google Scholar]
- Kacharmina JE, Crino PB, Eberwine J (1999). Preparation of cDNA from single cells and subcellular regions. Methods Enzymol 303:3–18. [DOI] [PubMed] [Google Scholar]
- Kataoka S, Toyono T, Seta Y, Ogura T, Toyoshima K (2004). Expression of P2Y1 receptors in rat taste buds. Histochem Cell Biol 121:419–426. [DOI] [PubMed] [Google Scholar]
- Kaya N, Shen T, Lu SG, Zhao FL, Herness S (2004). A paracrine signaling role for serotonin in rat taste buds: expression and localization of serotonin receptor subtypes. Am J Physiol Regul Integr Comp Physiol 286:R649–R658. [DOI] [PubMed] [Google Scholar]
- Kim JW, Roberts C, Maruyama Y, Berg S, Roper S, Chaudhari N (2006). Faithful Expression of GFP from the PLCβ2 promoter in a functional class of taste receptor cells. Chem Senses 31:213–219. [DOI] [PubMed] [Google Scholar]
- Maruyama Y, Pereira E, Margolskee RF, Chaudhari N, Roper SD (2006). Umami responses in mouse taste cells indicate more than one receptor. J Neurosci 26:2227–2234. [DOI] [PMC free article] [PubMed] [Google Scholar]
- Medler KF, Margolskee RF, Kinnamon SC (2003). Electrophysiological characterization of voltage-gated currents in defined taste cell types of mice. J Neurosci 23:2608–2617. [DOI] [PMC free article] [PubMed] [Google Scholar]
- Miyoshi MA, Abe K, Emori Y (2001). IP3 receptor type 3 and PLCβ2 are co-expressed with taste receptors T1R and T2R in rat taste bud cells. Chem Senses 26:259–265. [DOI] [PubMed] [Google Scholar]
- Murray RG (1974). The ultrastructure of sensory organs. In: The ultrastructure of taste buds (Friedmann I, ed.) pp. 1–81. North Holland, Amsterdam: North Holland.
- Nagai T, Kim DJ, Delay RJ, Roper SD (1996). Neuromodulation of transduction and signal processing in the end organs of taste. Chem Senses 21:353–365. [DOI] [PubMed] [Google Scholar]
- Nagai T, Delay RJ, Welton J, Roper SD (1998). Uptake and release of neurotransmitter candidates, [3H]serotonin, [3H]glutamate, and [3H]gamma-aminobutyric acid, in taste buds of the mudpuppy, Necturus maculosus. J Comp Neurol 392:199–208. [PubMed] [Google Scholar]
- Nelson G, Hoon MA, Chandrashekar J, Zhang Y, Ryba NJ, Zuker CS (2001). Mammalian sweet taste receptors. Cell 106:381–390. [DOI] [PubMed] [Google Scholar]
- Nelson G, Chandrashekar J, Hoon MA, Feng L, Zhao G, Ryba NJ, Zuker CS (2002). An amino-acid taste receptor. Nature 416:199–202. [DOI] [PubMed] [Google Scholar]
- Nolte C, Martini R (1992). Immunocytochemical localization of the L1 and N-CAM cell adhesion molecules and their shared carbohydrate epitope L2/HNK-1 in the developing and differentiated gustatory papillae of the mouse tongue. J Neurocytol 21:19–33. [DOI] [PubMed] [Google Scholar]
- Perez CA, Huang L, Rong M, Kozak JA, Preuss AK, Zhang H, Max M, Margolskee RF (2002). A transient receptor potential channel expressed in taste receptor cells. Nat Neurosci 5:1169–1176. [DOI] [PubMed] [Google Scholar]
- Richter TA, Caicedo A, Roper SD (2003). Sour taste stimuli evoke Ca2+ and pH responses in mouse taste cells. J Physiol (Lond) 547:475–483. [DOI] [PMC free article] [PubMed] [Google Scholar]
- Richter TA, Dvoryanchikov GA, Chaudhari N, Roper SD (2004). Acid-sensitive two-pore domain potassium (K2P) channels in mouse taste buds. J Neurophysiol 92:1928–1936. [DOI] [PubMed] [Google Scholar]
- Rossler P, Kroner C, Freitag J, Noe J, Breer H (1998). Identification of a phospholipase C beta subtype in rat taste cells. Eur J Cell Biol 77:253–261. [DOI] [PubMed] [Google Scholar]
- Smith DV, Akeson RA, Shipley MT (1993). NCAM expression by subsets of taste cells is dependent upon innervation. J Comp Neurol 336:493–506. [DOI] [PubMed] [Google Scholar]
- Spielman AI, Nagai H, Sunavala G, Dasso M, Breer H, Boekhoff I, Huque T, Whitney G, Brand JG (1996). Rapid kinetics of second messenger production in bitter taste. Am J Physiol 270:C926–C931. [DOI] [PubMed] [Google Scholar]
- Südhof TC (2004). The synaptic vesicle cycle. Annu Rev Neurosci 27:509–547. [DOI] [PubMed] [Google Scholar]
- Takeda M, Kitao K (1980). Effect of monoamines on the taste buds in the mouse. Cell Tissue Res 210:71–78. [DOI] [PubMed] [Google Scholar]
- Yang R, Crowley HH, Rock ME, Kinnamon JC (2000a). Taste cells with synapses in rat circumvallate papillae display SNAP-25- like immunoreactivity. J Comp Neurol 424:205–215. [DOI] [PubMed] [Google Scholar]
- Yang R, Tabata S, Crowley HH, Margolskee RF, Kinnamon JC (2000b). Ultrastructural localization of gustducin immunoreactivity in microvilli of type II taste cells in the rat. J Comp Neurol 425:139–151. [DOI] [PubMed] [Google Scholar]
- Yang R, Stoick CL, Kinnamon JC (2004). Synaptobrevin-2-like immunoreactivity is associated with vesicles at synapses in rat circumvallate taste buds. J Comp Neurol 471:59–71. [DOI] [PubMed] [Google Scholar]
- Yee CL, Yang R, Bottger B, Finger TE, Kinnamon JC (2001). “Type III” cells of rat taste buds: immunohistochemical and ultrastructural studies of neuron-specific enolase, protein gene product 9.5, and serotonin. J Comp Neurol 440:97–108. [DOI] [PubMed] [Google Scholar]
- Yee CL, Jones KR, Finger TE (2003). Brain-derived neurotrophic factor is present in adult mouse taste cells with synapses. J Comp Neurol 459:15–24. [DOI] [PubMed] [Google Scholar]
- Yu FH, Catterall WA (2004). The VGL-chanome: a protein superfamily specialized for electrical signaling and ionic homeostasis. Sci STKE 2004:re15. [DOI] [PubMed] [Google Scholar]
- Zhang Y, Hoon MA, Chandrashekar J, Mueller KL, Cook B, Wu D, Zuker CS, Ryba NJ (2003). Coding of sweet, bitter, and umami tastes: different receptor cells sharing similar signaling pathways. Cell 112:293–301. [DOI] [PubMed] [Google Scholar]