

Abstract
Although glucocorticoids (GCs) are known to exert numerous effects in the hippocampus, their chronic regulatory functions remain poorly understood. Moreover, evidence is inconsistent regarding the long-standing hypothesis that chronic GC exposure promotes brain aging/Alzheimer disease. Here, we adrenalectomized male F344 rats at 15 months of age, maintained them for 3 months with implanted corticosterone (CORT) pellets producing low or intermediate (glucocorticoid receptor–activating) blood levels of CORT, and performed microarray/pathway analyses in hippocampal CA1. We defined the chronic GC-dependent transcriptome as 393 genes that exhibited differential expression between intermediate and low CORT groups. Short-term CORT (4 days) did not recapitulate this transcriptome. Functional processes/pathways overrepresented by chronic CORT–up-regulated genes included learning/plasticity, differentiation, glucose metabolism, and cholesterol biosynthesis, whereas processes overrepresented by CORT–down-regulated genes included inflammatory/immune/glial responses and extracellular structure. These profiles indicate that GCs chronically activate neuronal/metabolic processes while coordinately repressing a glial axis of reactivity/inflammation. We then compared the GC transcriptome with a previously defined hippocampal aging transcriptome, revealing a high proportion of common genes. Although CORT and aging moved expression of some common genes in the same direction, the majority were shifted in opposite directions by CORT and aging (eg, glial inflammatory genes down-regulated by CORT are up-regulated with aging). These results contradict the hypothesis that GCs simply promote brain aging and also suggest that the opposite direction shifts during aging reflect resistance to CORT regulation. Therefore, we propose a new model in which aging-related GC resistance develops in some target pathways, whereas GC overstimulation develops in others, together generating much of the brain aging phenotype.
Glucocorticoids (GCs) are pleiotropic adrenal steroid hormones that affect nearly all tissues of the body and, in particular, regulate metabolic, developmental, and stress-related processes (1, 2). GCs also exert powerful anti-inflammatory actions, and synthetic analogs are the therapeutic agents of choice for many inflammatory/neuroinflammatory disorders (2–5). However, the long-term effectiveness of GCs is limited by severe metabolic side effects (3).
In the hippocampus, GCs exert a wide range of actions that depend on the duration and level of hormonal exposure (6–9). Although short-term effects are generally considered adaptive, long-term elevation of GCs (eg, as in chronic stress) has frequently been associated with cognitive deficits and/or neuropathological alterations (6–14), particularly at higher ranges of GCs (15). Moreover, a long-standing hypothesis links chronic GC exposure to unhealthy hippocampal aging/Alzheimer disease (AD) (16–20). Nevertheless, given the brain's continuous exposure to circulating adrenal steroids, it appears highly likely that, in addition to damaging effects, chronic exposure to GCs also mediates a number of biologically important brain functions.
Because of the complexity and extent of the GC signaling network (1, 7), however, elucidating chronic deleterious or adaptive processes has been difficult. GCs regulate hippocampal processes primarily via 2 nuclear receptors, the glucocorticoid receptor (GR), a ubiquitous transcription factor that mediates most GC-dependent transcription, and the mineralocorticoid receptor (MR), which has higher affinity for GCs and primarily mediates functions dependent on low corticosteroid concentrations (7, 21, 22). The GR has numerous isoforms and regulates transcription both via binding to specific DNA sequences (glucocorticoid response elements [GREs]) that positively (pGRE) or negatively (nGRE) modify transcription of adjacent target genes and via protein-protein interactions with other transcription factors, coactivators, and corepressors (1, 23–26). In addition, analogously to other steroids (27–29), GCs regulate various major physiological functions via nongenomic pathways (7, 8, 30–33). This diversity of isoforms and mechanisms enables GCs to regulate multiple pathways independently within the same tissue or cell.
One highly effective approach for dissecting complex systems such as hormonal target networks is gene expression profiling and associated pathway analysis (7, 34, 35). Microarrays or other expression profiling methods yield sets of differentially expressed genes that can be used to interrogate pathway databases and identify altered processes/pathways (36–40). Profiling techniques have been applied previously to analyze effects of stress or short-term exposure to GCs on gene expression in rodent hippocampal formation (41–47), but there have been no such studies on long-term exposure to normal-range levels of corticosterone (CORT), the naturally occurring GC in rodents. Consequently, neither the deleterious nor the adaptive processes mediated by chronic brain exposure to natural GCs are well understood.
Further, although it is clear that the effects of some steroids, including estrogen and progesterone, both change with aging and modify markers of brain aging (29, 48–51), evidence is inconsistent regarding the role of GCs in brain aging. Variations of the hypothesis that chronic exposure to GCs/stress promotes brain aging processes, especially in the hippocampus (16–19, 52), have garnered substantial support from studies showing that various biomarkers of brain aging can be accelerated or retarded by conditions that enhance or reduce GC impact, respectively (7, 10–12, 17, 18, 20, 53–56). Additional support has come from findings that GCs correlate with or accelerate markers of dysfunction in AD or AD models (57–61). However, other studies have found evidence that GCs do not accelerate brain aging and in fact can act in an apparent “antiaging” direction on some brain aging/AD markers (2, 13, 62–66). These contradictory results highlight the need for further tests of the general hypothesis, using a broader range of aging markers to control for anomalous indicators.
Here, we used microarray/pathway analyses to identify the chronic GC-dependent transcriptome and its associated functional processes in aging rat hippocampus. In addition, we analyzed the overlap of this GC transcriptome with a previously identified rat hippocampal aging transcriptome, to assess aging changes in the GC-dependent transcriptome and to test 2 implicit predictions of the hypothesis that GCs promote brain aging: (1) CORT-targeted genes should have a significantly higher probability of changing with aging than genes not targeted by CORT; and (2) most corticosterone- and aging-sensitive (CAS) genes should shift expression in the same direction with CORT and aging. The results reveal surprising effects of aging that indicate the need for new, more complex models of GC interactions with brain aging.
Materials and Methods
Animals and tissue preparation
All procedures were performed in accordance with federal animal care guidelines (Institutional Animal Care and Use Committee 00166M2000) at the University of Kentucky's Association for Assessment and Accreditation of Laboratory Animal Care–accredited animal facility.
Forty male Fischer 344 (F344) rats aged 14 to 15 months (late midage) were surgically prepared (sham operated, n = 10; adrenalectomized, n = 30) at Harlan, Inc (Indianapolis, Indiana) and shipped to the University of Kentucky 10 to 12 days after surgery. Upon arrival, adrenalectomized (ADX) subjects were maintained on isotonic saline (+1% sucrose) drinking fluid. Supplemental feed mash (standard chow mixed with water and warmed), apple chunks, and sc 1.25-mg corticosterone sulfate injections (Solu-Delta-Cortef; Pfizer, New York, New York) were provided. Pellet implant surgery was performed according to standard protocols. Sham animals received inert pellets. ADX animals were divided into 2 groups; low-dose animals (n = 20) received one 25-mg CORT pellet, whereas intermediate-dose animals (n = 10) received one 200-mg CORT pellet (slow release, catalog no. NG-111; Innovative Research of America, Sarasota, Florida). Incisions were closed with wound clips (removed after 10 days). Pellets were not presoaked, because the vendor's instructions stated that pellets are designed for continuous and even CORT release for 90 days, beginning with initial subcutaneous tissue contact. No evidence of major pellet embedding/impaction was noted at study completion and terminal plasma CORT levels confirmed that pellets were still releasing appropriate and anticipated amounts (Figure 1).
Figure 1.

CORT blood concentrations measured from sham intact (Sham Control) and adrenalectomized (ADX) F344 rats (with low [Low]or intermediate [Int] CORT replacement). Low-CORT (ADX) F344 rats exhibited significantly lower CORT concentrations than sham controls and intermediate-CORT (ADX) animals (P = 7.5 × 10⁻¹³, 1-way ANOVA; **, P < .001, Fisher protected least significant difference post hoc pairwise test). Sham and intermediate-CORT groups did not differ significantly (P > .4).
Animals were housed singly for 3 months after surgery and euthanized at ∼18 months of age. Low-CORT animals received saline/sucrose drinking water. One ADX animal was removed for declining health. During week 12, just before study termination, 9 of the ADX low-CORT subjects were assigned to a short-term, high-dose group (low-CORT/ST) and given daily sc CORT injections (5 mg/d for 4 days; a relatively high dose) (67). Final treatment groups (n = 9-10/group) consisted of the following: (1) sham (intact) control; (2) low-CORT (ADX); (3) intermediate-CORT (ADX); and (4) low-CORT/ST (ADX).
Animals were euthanized by deep CO2 anesthesia and decapitation between ∼8 and 10 am on the last days of the study. CORT was measured from trunk blood using an RIA kit (ICN Biomedicals, Costa Mesa, California), according to the manufacturer's directions. Duplicate readings were averaged and treated as single observations, and outlier values (>2 SD from the mean, with outliers included) were treated as missing values for statistical analysis.
Microarray procedures
Tissue preparation and quality control
Each animal's hippocampal CA1 region was dissected and processed for microarray analysis (RGU34A; Affymetrix, Santa Clara, California) as described previously (37). Scanned microarray images were analyzed using GCOS (Affymetrix). Quality control measures, scaling factor (2.31 ± 0.06), RawQ (2.37 ± 0.06), percent present (46.1 ± 2.2), and GAPDH 3′:5′ (1.40 ± 0.11), were within normal ranges and did not differ significantly with treatment (P > .1; 1-way ANOVA). No visual microarray hybridization defects (residual sign analysis) (68) were found. This study has been uploaded to the Gene Expression Omnibus (www.ncbi.nlm.nih.gov/geo/) under accession number GSE3761.
Prefiltering algorithm
A prefiltering algorithm was applied to reduce the number of multiple comparisons, as in prior studies (37, 69, 70). In brief, gene symbol–annotated, A grade probe sets (probe sets for which the manufacturer confirms most probes match the transcript perfectly) with sufficient signal intensity (>4 chips with ≥4.2 signal intensity) for reliable measurement were retained.
Statistical analysis
Filtered genes were analyzed by 1-way ANOVA (Figure 2), and significant results were evaluated with post hoc all-pairwise Fisher protected least significant difference testing. Multiple testing error (false-positive results) was estimated by the false discovery rate (FDR = expected/observed) (71) procedure, and median FDRs are reported.
Figure 2.

Microarray and pathway analysis. A, Filtering and statistical testing algorithm. Total probe sets were filtered to retain probe sets with at least 5 presence calls, and an A grade unique gene symbol level annotation. The retained 52% of probe sets were each tested by 1-way ANOVA (P ≤ .05) across the 4 treatment groups. The FDR for statistically significant genes is shown. B, Post hoc pairwise analysis (Fisher protected least significant difference, P ≤ .05) identified 393 genes that differed between low- and intermediate-CORT conditions (separated into up- and down-regulated categories), defining the GC-dependent transcriptome. C, Functional process analysis (DAVID; see Materials and Methods) revealed processes/pathways overrepresented by GC-dependent genes. For each overrepresented GO process, the number of GC-dependent genes identified for that process (#), and the overrepresentation P value (Overrep p-value) are shown. Underlined processes were added by the authors.
Identifying CAS genes
The GC-dependent transcriptome identified here was tested for overlap with an aging-dependent transcriptome constructed from 3 published microarray studies of aging male F344 rat hippocampus (Gene Expression Omnibus data deposition references): Ref. 37: GSE854, 3 months old (n = 9), 12 months old (n = 10), and 24 months old (n = 10); Ref. 72: GSE5666, 5 months old (n = 29) and 25 months old (n = 49); and Ref. 69: GSE9990, 3 months old (n = 9), 6 months old (n = 9), 9 months old (n = 9), 12 months old (n = 9), and 23 months old (n = 15). In total, this set comprised 158 individual microarray transcriptional profiles. The aging transcriptome was defined as all genes that differed significantly between young and aged animals in any 1 of the 3 studies. Common (overlapping) genes were defined as those genes present (identified) in both the aging- and the GC-dependent transcriptomes. Statistical comparison procedures (binomial tests) similar to those published previously (73–75) were used to find significant deviations from chance.
Biological process/pathway identification
Significantly overrepresented functional processes were identified using the Database for Annotation, Visualization and Integrated Discovery (DAVID) overrepresentation tool (76) on the Gene Ontology (GO) database (77). The table clustering option and streamlined GO-FAT subset of the GO were used for analysis. To reduce redundancy, a single process illustrative for each cluster (78), populated by between 3 and 50 genes (and significant at P < .05; κ statistic/EASE score), is reported (see Results). In addition, the GO database is still a work in progress, and there is some underassignment of genes to relevant functional categories. Consequently, based on a literature review, some identified genes and functional processes that appeared appropriate to the lists obtained by DAVID/GO analysis are added (additions are underlined in figures and tables).
Real-time quantitative (q) PCR
Twelve CORT-dependent genes identified by microarray were validated using real-time qPCR on an ABI Prism 7700 Sequence Detection System (Applied Biosystems, Foster City, California) in RNA samples from the contralateral hippocampi of the same experimental animals. One-step RT-PCR was performed on 50 ng of cellular RNA in a 30-μl PCR mix containing mRNA-specific primers and Taq Man probes for each gene. For each target gene, RNA samples from all animals in the 4 experimental groups were analyzed in duplicate on the same 96-well PCR plate. The mRNA levels were quantified by plotting on a standard RNA serial dilution curve run in parallel. All results are normalized to Gapdh.
Immunohistochemistry
Immunohistochemical analysis was performed as in the prior work (69). The following primary antibodies and concentrations were used for overnight incubation: rabbit GR (1:1000, sc-1004; Santa Cruz Technology, Santa Cruz, California) and mouse glial fibrillary acidic protein (GFAP) (1:1000, clone G-A-5; Sigma-Aldrich, St Louis, Missouri). For double staining after the incubation in primary antibodies, the tissues were incubated in donkey anti-rabbit Cy3 and donkey anti-mouse fluorescein isothiocyanate secondary antibodies (1:500; both from Jackson ImmunoResearch Laboratories, Inc, West Grove, Pennsylvania). To obtain comparable results, all sections were stained simultaneously in the same staining tray.
Results
Plasma corticosterone and body weight
Blood was collected between 8 and 10 am, near the trough of the rat CORT circadian cycle. However, CORT concentrations in sham intact animals (∼95 ng/mL) (Figure 1) were somewhat above the trough baseline generally reported for F344 male rats (79, 80). Therefore, the animals may have shown effects of mild stress or circadian disturbance from being transferred to the laboratory. Alternatively, the elevated values in sham rats may have reflected the aging-related increase in blood CORT reported in a number of rat studies (16, 56, 81–83). In ADX animals given low-CORT replacement, plasma CORT was severely reduced from normal levels (Figure 1). In contrast, ADX animals given intermediate-CORT replacement showed blood levels above those in sham controls (albeit nonsignificantly), in approximately the upper range of the normal circadian cycle (56, 79, 80, 82). This range activates GRs in hippocampus (21, 83).
Both low- and intermediate-CORT groups exhibited weight loss at the time of ADX surgery, and neither recovered to the level of sham animals (Table 1), consistent with previous long-term ADX studies (20, 84). However, these effects were not due to altered nutrient intake because both ADX groups showed food consumption similar to that of sham animals. In both ADX conditions, water intake remained elevated through the entire study, presumably related to a lack of adrenal mineralocorticoids. Unlike prior long-term ADX studies in which elevated CORT was administered in the drinking water (84) or by injection (15), the higher dose pellet–implanted animals in this study did not exhibit reduced food intake, additional weight loss, or general signs of physiological deterioration. The ADX-related modest weight loss apparently had little effect on gene expression regulation in the hippocampus, as indicated by the similar profiles of the ADX intermediate-CORT and the sham control groups. In addition, the major statistical comparisons were performed between the low- and intermediate-CORT groups (see below).
Table 1.
Body Weight, Food Intake, and Water Consumption
| 3 Wk |
12 Wk |
|||||
|---|---|---|---|---|---|---|
| Sham | Low | Intermediate | Sham | Low | Intermediate | |
| Weight, g* | 403 ± 9 | 350 ± 8 | 325 ± 12 | 399 ± 4 | 338 ± 9 | 331 ± 11 |
| Food, g/ 2 days | 37 ± 6 | 32 ± 1 | 40 ± 2 | 34 ± 1 | 31 ± 1 | 36 ± 2 |
| Water, mL/2 days)* | 45 ± 2 | 92 ± 6 | 146 ± 15 | 34 ± 2 | 89 ± 4 | 76 ± 17 |
Measurements obtained early (∼3 weeks after implant surgery) or late (final week) in the study, are shown for body weight, food intake, and water consumption. Data are means ± SEM.
Significant weight and water consumption differences: P < .01, 1-way ANOVA, for both time points).
Chronic CORT-dependent transcriptional profile
The algorithm used to identify the GC-dependent transcriptome (genes sensitive to long-term corticosterone exposure) is summarized in Figure 2A. First, total probe sets (8799) on the Affymetrix GeneChip array (RGU34A) were prestatistically filtered (see Materials and Methods) to select probe sets with a high-quality signal and an A grade gene symbol annotation (6685 genes). Of these, 2033 redundant probe sets were excluded, leaving 4652 gene probes for analysis. Each of the remaining 4652 gene probes was tested by 1-way ANOVA for significant difference (at P ≤ .05) across the 4 treatment groups. As shown, 641 genes were found to differ significantly across the groups, generating a reasonably low FDR (median FDR = 0.19) (71) and indicating that the error of multiple testing contributed comparatively few false-positive results to the identified significant genes.
Specific groups between which genes differed were determined by all-pairwise testing (Fisher protected least significant difference, at P ≤ .05) applied to ANOVA-significant genes. As expected, the sham vs intermediate-CORT pairwise comparison generated the smallest number of significantly different genes (135), whereas sham vs low-CORT (446) and intermediate-CORT vs low-CORT (393) comparisons yielded considerably more genes with differential expression. To exclude confounds from the nonspecific effects of ADX that might be present in comparisons between sham vs low-CORT (ADX) animals, we defined the CORT-dependent transcriptome as the 393 genes for which hippocampal expression differed significantly between the intermediate-CORT (ADX) and low-CORT (ADX) groups (47). These 393 genes were separated for DAVID pathway analysis according to whether expression was activated (n = 156; Figure 2B, white) or repressed (n = 237; Figure 2B, black) by chronic CORT (up-regulated or down-regulated, respectively, in the intermediate-CORT group relative to the low-CORT group). (All 393 genes that differed significantly between the intermediate- and low-CORT groups are listed in Supplemental Table 1 published on The Endocrine Society's Journals Online web site at http://endo.endojournals.org.)
Validation by qPCR
We validated accuracy of the microarray findings by performing qPCR on 12 genes identified as CORT-dependent in the microarray analysis (6 genes activated and 6 genes repressed). Of these 12, 11 were changed by CORT in the same direction (up or down) in both analyses (P = .0034, χ2 test). Moreover, a Spearman rank correlation test between the microarray and qPCR analyses of the relative magnitude of the CORT effect for each of the 12 genes (ranked from most repressed to most activated) was highly significant (Figure 3), indicating strong agreement in the relative degree of change between the 2 measures of expression.
Figure 3.

Correlation between microarray and RT-qPCR measures. Twelve genes identified by microarray analysis as chronic CORT dependent (6 up- and 6 down-regulated) were also assessed by RT-qPCR in extracted RNA from the same subjects (see Materials and Methods). Genes are ranked from the most significant decrease (1) to most significant increase (12) for both microarray (y-axis) and PCR (x-axis) data. A highly significant Spearmen rank correlation (P = .009) was found between datasets obtained with the 2 technologies, indicating strong validation of both direction and relative magnitude of expression change.
Functional pathways/processes overrepresented in the GC-dependent transcriptome
DAVID functional analysis revealed that genes whose expression was activated by CORT overrepresented several processes associated with neuronal plasticity and energy metabolism, including regulation of synaptic plasticity, learning, and memory (including immediate early genes [IEGs]), cholesterol biosynthesis, the glucose metabolic process, and response sto steroid hormone and cofactor binding (Figure 2C).
In contrast, genes repressed by CORT overrepresented processes associated with immune/inflammatory responses, cell damage, oxidative systems, apoptosis, and extracellular matrix organization (Figure 2C). Many inflammatory/immune genes are expressed primarily in microglia (85, 86), but CORT also repressed at least 12 additional glial marker genes, including Gfap and others linked to reactive astrogliosis (87). Although not identified by DAVID analysis, these genes were assigned by the authors to a glial activation/structure process in Figure 2C (underlined).
Localization and density of immunoreactive GR
Immunohistochemical analysis was used to assess the distribution and relative concentration of GRs among cell types in the hippocampal field CA1 and adjacent corpus callosum of intact F344 rats (Figure 4). Figure 4, A and B, illustrate that pyramidal neurons exhibited intense GR immunostaining compared with that of glial cells scattered throughout other layers and white matter, as reported previously for rats (88). Double-label immunohistochemical analysis of GR and GFAP showed that nuclei with low GR immunoreactivity were frequently localized adjacent to astroglial cytoplasmic GFAP structures (Figure 4D), identifying them as likely astrocyte nuclei or were not clearly associated with GFAP but instead were aligned in parallel to white matter fibers, identifying them as likely oligodendrocytes (Figure 4C). These findings are consistent with the interpretation that glial cell nuclei contain low concentrations of GR relative to those in neurons (81, 88).
Figure 4.

Immunohistochemical expression of GRs in dorsal hippocampal field CA1 of F344 rats. A, GR immunostaining showing dense GR nuclear concentration in pyramidal neurons of stratum pyramidale (sp), with less densely stained (predominantly glial) cells distributed throughout the corpus callosum (cc), stratum oriens (so), and stratum radiatum (sr). B, Higher magnification photomicrograph (calibration in C) of GR staining in sp, so, and alveus of the CA1 region, more clearly illustrating lighter staining of the generally smaller nuclei of glial cells compared with neurons of sp. C and D, Double-labeled immunofluorescent images of GR (red) and the specific astrocyte marker, GFAP (green), clarifying glial cell-type localization. C, Arrow points to examples of GR-positive nuclear staining in oligodendrocytes, identified by location and distribution in white matter and the paucity of adjacent GFAP (inset, lower right: magnification of example cells highlighted by the arrow). D, Arrow points to the low-intensity GR fluorescent nucleus in so, adjacent to a formation of GFAP, probably an astrocyte. GR staining here was almost entirely nuclear and because astrocytic GFAP is exclusively cytoplasmic, the 2 proteins exhibited little overlap in merged images (inset, lower right: magnification of an example cell highlighted by the arrow). Compared with glial nuclei, note the bright GR immunofluorescence of neurons in sp. Images have been contrast enhanced.
Insensitivity of chronic CORT-dependent genes to short-term CORT treatment
To determine whether long-term CORT exposure was in fact required for the manifestation of CORT dependence in the identified chronic transcriptome, we tested one of the low-CORT groups for sensitivity to a short-term high-dose CORT regimen (low-CORT/ST, 5 mg/rat injection for 4 days). Of the 393 genes found to differ between low-CORT and intermediate-CORT in the long-term study (Figure 2), only 124 (∼32%) also differed significantly between the low-CORT and the low-CORT/ST, 122 of which were shifted in the same direction by long-term and short-term CORT. Therefore, expression of most chronic CORT-dependent genes was not altered by short-term CORT exposure. The 122 genes that also exhibited short-term sensitivity may constitute a more responsive subset (short-term CORT sensitivity of chronic CORT-dependent genes is reported by yes or no designations in Supplemental Table 1).
Aging changes in CORT-dependent gene expression
We assessed overlap of the CORT-dependent transcriptome with an aging-dependent transcriptome generated by combining 3 prior microarray studies of rat hippocampal aging. These aging studies were performed by the same group using the same rat strain and similar methodology. Raw data from the studies (see Materials and Methods) were merged using the Affymetrix Best Match annotation file to align probe sets across the 2 array platforms (RGU34A and RAE230A) used in the studies. Probe sets annotated with a unique gene symbol and rated present in at least 1 study were included for analysis, resulting in 4652 candidate genes. For assignment to the aging-dependent transcriptome, a gene had to vary significantly in expression with age (at P ≤ .05) in at least 1 of the 3 aging studies. This was the case for 1384 of 4652 total genes tested (29.7%) (Figure 5).
Figure 5.
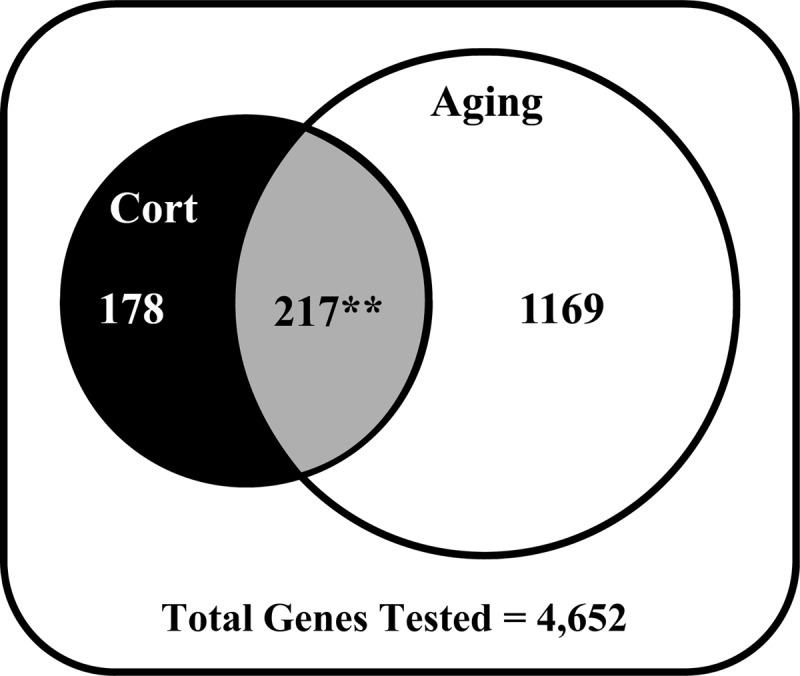
Venn diagram of CAS genes. All genes present and annotated in aging and CORT studies (4652) were partitioned into those sensitive only to CORT (black circle), only to aging (white circle) or to both CORT and aging (gray overlapping region). More than half of all CORT-sensitive genes (217 of 393, ∼55%) were also significantly altered with age, whereas only 117 (∼30%) dual-sensitive genes would be expected by chance, revealing a highly significant interaction of CORT regulation and aging change (P < .000001, binomial test).
If CORT and aging effects were independent, the probability that a gene in the total population would be both CORT- and aging-sensitive by chance would be the product of the independent probabilities of CORT sensitivity and aging sensitivity in that population. In the present case, given a 29.7% frequency of aging dependence (1384 of 4652) and an 8.4% frequency of CORT dependence (393 of 4652) (Figure 5), this expected product is 117 dual-sensitive genes ([29.7% aging-sensitive] × [8.4% CORT-sensitive] × [4652 total]). Of the 393 CORT-sensitive genes, however, 217 also change with aging (217 of 393, ∼55%), whereas only 117 (117 of 393, ∼30%) would be expected if the actions of CORT and aging on gene expression were independent (P < .000001; binomial test). Therefore, our data indicate a significant interaction between CORT regulation and aging changes in hippocampus, consistent with the first prediction of the hypothesis that GCs promote brain aging (Introduction). However, of these 217 CAS genes, a substantial majority (145 of 217, ∼67%, P = 1.97 × 10⁻⁷; binomial) were regulated in opposite directions by CORT and aging, contradicting the second prediction. That is, 98 were down-regulated by CORT but up-regulated by aging and 47 were up-regulated by CORT but down-regulated by aging (“opposite direction genes”), whereas 31 were up-regulated by both CORT and aging and 41 were down-regulated by both CORT and aging (“same direction genes”) (all dual-sensitive genes are listed by a combination of directional change in Supplemental Table 1). The 217 CAS genes were grouped according to the 4 combinations of CORT and aging directional change above, and each grouping was assessed separately by DAVID analysis to identify overrepresented functional pathways/processes. Results are shown in Table 2 and are considered in the Discussion.
Table 2.
Functional Processes/Pathways Overrepresented by Genes Sensitive to Both CORT and Aging.
| Processes/Pathways | No. | P Value |
|---|---|---|
| A. Activated by CORT and down-regulated by aging | ||
| Cholesterol synthesis: Fntb, Hmgcr, Lss, Sqle | 4 | |
| Cognition (learning or memory/ IEGs): Accn1, Cacnb2, Calb1, Crh, Egr1, Egr2, Fos, Hmgcr, Htt (Arc, Camk2a, Homer1, Nr4a1) | 9 | .00656 |
| Carboxylic acid catabolic process: Arg2, Cdo1, Faah, Got1 | 4 | .03504 |
| B. Activated by CORT and up-regulated by aging | ||
| Bioenergetic metabolism: Aldoc, Gpd1, Idh2, Insig1 | 4 | |
| Differentiation, process growth: Camkk1, Cd24, Gdp1, Insig1, Map1b, Ndrg2, S100a10 | 7 | |
| Response to steroid hormone stimulus: A2m, Cd24, Esr2, Il6ra, Insig1, Map1b, Ptpru, Sgk1, Sult1a1 | 9 | .00010 |
| Cellular cation homeostasis: Agt, Bud31, Cd24, Epor, Mt2A, Sgk1 | 6 | .00385 |
| Cytokine binding: A2m, Cd74, Epor, Il6ra | 4 | .00403 |
| Positive regulation of peptidyl-tyrosine phosphorylation: Agt, Cd24, Il6ra | 3 | .01789 |
| Serine-type endopeptidase inhibitor activity: A2m, Agt, Itih3 | 3 | .01894 |
| Regulation of cell growth: Agt, Map1b, S100a10, Sgk1 | 4 | .02343 |
| C. Repressed by CORT and down-regulated by aging | ||
| Extracellular structure: Agrn, Col1a1, Col3a1, Dcn, Glra2, Serpinh1 | 6 | 5.0 × 10⁻⁴ |
| Response to abiotic stimulus: Adrb3, Col1a1, Col3a1, Dcn, Igf1, Igf2, Jun, Lxn, Mgp, Tacr3 | 10 | 3.9 × 10⁻⁴ |
| Positive regulation of protein kinase cascade: Adrb3, Cdc42, Igf1, Igf2, Kdr, Pld2 | 6 | .00136 |
| Positive regulation of DNA replication: Cdc42, Igf1, Jun | 3 | .01730 |
| D. Repressed by CORT and up-regulated by aging | ||
| Glial activation/structure: Gfap, Grn, Hmox1, Klk6, Lgals3bp, Nf1, Pla2g4a, Pllp, Ptpn6, S100a4, Vcan, Vim | 12 | |
| Immune response (antigen processing and presentation/regulation of leukocyte mediated immunity): Apobec1, B2m, C1qb, C1s, C3, C4-2, Cyba, Fcgr2a, Il15, Il18, Psmb8, Psmb9, Ptpn6, Rsad2, RT1-CE12, RT1-CE16, RT1-DMb, RT1-EC2, Tap1, Tnfsf13 (Ctse, Psme1/Hmox1) | 20 | 8.9 × 10⁻⁹ |
| Heme binding: Cyba, Cyp11b1, Cyp27a1, Cyp2a3, Cyp2d1, Cyp4a1, Hmox1, Nos2, Ptgs1 | 9 | 3.4 × 10⁻⁴ |
| Eicosanoid metabolic process: Cyp4a1, Hpgds, Pdpn, Pla2g4a, Ptgs1 | 5 | .00777 |
| Vasculature development: Gpx1, Hmox1, Il15, Il18, Nf1, Nos2, Pdpn, Tgfa, Tgfbr1 | 9 | .00945 |
| Positive regulation of phagocytosis: C3, Fcgr2a, Pros1 | 3 | .01676 |
| Endopeptidase activity: C1r, C1s, Casp1, Ctse, Ctsh, Klk6, Pcsk6, Psmb8, Psmb9 | 9 | .01914 |
| Antiapoptosis: Bcl2l1, Gpx1, Hspb1, Serpinb9, Tgfa, Tgfbr1 | 6 | .02743 |
| Regulation of apoptosis: Bcl2l1, Casp1, Fcgr2a, Gpx1, Hmox1, Nf1, Pla2g4a, Ptpn6, Tgfbr1 | 9 | .04252 |
The 217 genes regulated by both long-term CORT exposure and aging (Figure 5) were sorted by combination of CORT- and aging-regulated directions and subjected to DAVID/GO functional process/pathway analysis. Significantly overrepresented functional processes are listed for each combination of regulated directions, according to the P value (DAVID score). No. represents the number of identified genes. Genes and processes added based on a literature review are underlined, and genes consolidated from multiple categories are listed in parentheses.
Discussion
In this study, we defined a chronic glucocorticoid-dependent transcriptome comprising 393 genes in aging rat hippocampus and interrogated the GO database to identify the biological processes and pathways overrepresented by this transcriptome. Our results revealed that chronic GC exposure activated genes encoding multiple neuronal and metabolic processes, while concomitantly repressing genes encoding an apparent “glial axis” of reactivity (including inflammation/immune response and astrogliosis). In addition, to assess how the GC-dependent transcriptome changes with brain aging, we determined its overlap (genes in common) with a previously identified hippocampal aging transcriptome. These analyses were used to test 2 implicit quantitative predictions of the hypothesis that chronic GCs advance brain aging, namely, 1) that genes comprising the GC transcriptome should be more likely than non-GC targets to change with aging and 2) that GCs and aging should regulate expression of common target genes in the same direction (19). Our findings supported the first prediction. However, they clearly contradicted the second, because a substantial majority (∼67%) of genes common to both transcriptomes changed expression in opposite directions with CORT and aging. Thus, rather than promoting aging, the effect of CORT opposed the aging change for many of its targets and can be viewed as “antiaging.”
GC-dependent transcriptome
The GC-dependent transcriptome was defined by differential expression between the intermediate- and low-CORT groups. Because the GR is bound by ligand only at the higher plasma CORT levels present in the intermediate-CORT group (Figure 1), it is likely that most differentially expressing genes comprising this transcriptome were regulated primarily by the GR (47, 83). This conclusion is consistent with findings that hippocampal gene expression induced at higher concentrations of CORT is blocked selectively by a GR antagonist (89). Nevertheless, these observations do not preclude the possibility that some identified genes were regulated via nongenomic GC signaling pathways (8, 90) or secondarily by primary target genes (83).
Functional processes/pathways overrepresented by genes of the GC-dependent transcriptome
Processes identified by genes activated by chronic CORT included synaptic plasticity, learning (IEGs), cholesterol biosynthesis, glucose metabolism, neurite outgrowth, and differentiation (Figure 2 and Supplemental Table 1). Although it is well established that acute CORT treatment or stressful conditions associated with learning paradigms can activate expression of some IEGs, notably Arc and Egr1 (64, 72, 91, 92), the present results show that chronic GC exposure activates a much broader genomic network important for learning/plasticity than recognized previously. The cholesterol biosynthetic pathway also is important for learning/plasticity because of its role in generating membrane for neurite outgrowth and because it provides isoprenoids that modulate long-term potentiation (90, 93). It should be noted, however, that some synaptic and plasticity genes also respond to shorter GC exposures (46, 94, 95) (also see Short-Term CORT Sensitivity column in Supplemental Table 1).
Conversely, processes identified by genes repressed by chronic CORT included inflammatory/immune and reactive glial responses, proteasomal/lysosomal proteolysis, apoptosis, proliferation, protein kinase cascades, extracellular matrix (ECM), and cytoskeletal structure. Approximately 50% more genes were down-regulated than up-regulated by chronic CORT, an effect related primarily to the large number of repressed inflammatory/immune genes (Figure 2). Based on prior studies of cell-specific expression (69, 85, 87, 96, 97), most target genes repressed by CORT are expressed primarily in glial cells. Moreover, many of these repressed genes play important roles in reactive responses of different glial cell types to injury/pathology, including inflammatory/immune genes in microglia, Gfap and other genes (Pla2g4a, S100a4, Vcam, and Vim) in astrocytes, and Plip in remyelinating oligodendrocytes (Table 2D and Supplemental Table 1). Taken together, these data suggest that a major function of GCs is to coordinately suppress a “glial axis of reactivity.”
However, CORT also repressed some genes in neurons and activated others expressed primarily in glia. For example, glycolytic pathway genes were activated by CORT (Figure 2), and increasing evidence suggests that glycolysis in the brain may occur largely within astrocytes (98, 99). By virtue of the diversity of its isoforms and regulatory mechanisms, the GR can activate and repress different sets of genes within the same cell (1, 78). Ligand-activated GRs regulate target genes by direct binding of GR homodimers to positive (activating) or negative (repressing) GREs (the “direct” mode or cis-regulation) and by tethering to other transcription factors at non-GRE binding sites (the “indirect” mode or trans-regulation), as well as by recruiting chromatin-modifying coactivators or corepressors (23, 100–103). Moreover, GR-mediated transcriptional regulation can be modulated by posttranslational modifications or by concurrent expression of dominant negative splice variants and other isoforms. In particular, GRβ, a major splice variant of the primary human gene (GRα), forms heterodimers with GRα and acts as a dominant negative inhibitor of GRα function (1, 104). Therefore, the ratio of GRα to GRβ, which varies substantially among cell types and conditions, can modulate the GC sensitivity of specific gene targets and cell types. In addition, the GR can form heterodimers with the MR (105) and the androgen receptor (105) that inhibit GR function.
Furthermore, GR-mediated indirect-mode repression via protein-protein interactions may occur at lower GC concentrations than activation/repression via direct-mode GR dimer binding to GREs (1, 3, 23, 100, 101). Considering that GR immunoreactivity is lower in glia than in CA1 neurons (Figure 4 and Ref. 88) and that inflammatory gene expression is predominantly localized in glia, our results raise the interesting possibility that GC repression of inflammatory/immune genes (Figure 2) is mediated by indirect-mode GR mechanisms in glia. Similar indirect mechanisms are used by GCs in repressing peripheral inflammatory responses (1, 3).
Thus, the present results indicate that a major action of GCs in the hippocampus is the broad coordination of differential activation between neuronal and glial compartments. The functional role of this neuronal-glial imbalance is not fully clear, but it could reflect processes required for adequate allocation of bioenergetic resources to energy-expensive neuronal plasticity or, alternatively, for maintaining neuronal systems in states of biochemical readiness, enabling rapid responses to incoming stimuli.
Aging-related expression shifts of GC-dependent genes
As shown in Figure 5, of the 393 genes identified as the chronic CORT-dependent transcriptome, 217 also shifted expression with aging (Supplemental Table 1) and are referred to here as CAS genes. One likely interpretation of an aging shift in expression of a CORT-sensitive gene appears to be a change in the efficacy of CORT signaling. Specifically, if CORT signaling were strengthened during aging, the gene's expression should shift in the same direction promoted by CORT. Conversely, if CORT signaling were weakened during aging, the gene's expression should shift in the direction opposite that promoted by CORT. Of the 217 CAS genes, the majority (67%) shifted expression during aging in the direction opposite that promoted by CORT, consistent with aging-related weakening of or resistance to the regulatory actions of CORT. The remaining 33% of CAS genes shifted expression during aging in the same direction promoted by CORT, consistent with strengthening of the regulatory actions of CORT in aging.
Although additional studies will, of course, be needed to confirm these interpretations, development of GC target resistance is a well-recognized pathogenic mechanism in a number of clinical disorders. In particular, resistance to GC-mediated inflammatory gene repression, possibly resulting from diminished availability of corepressors or elevated expression of the dominant negative isoform, GRβ, is implicated in major inflammatory diseases such as severe asthma and chronic obstructive pulmonary disease (2, 3, 104, 107, 108). Conceivably, similar mechanisms might underlie aging-related alterations in GC signaling in selective hippocampal genomic networks. Regardless of the mechanisms, however, the effects of CORT opposed, rather than promoted, aging changes for most CAS genes. Therefore, these data clearly contradict the long-standing basic hypothesis that GCs primarily promote brain aging changes (see Figure 2 in Ref. 19).
Functional consequences of aging changes in GC-dependent pathways
With aging, plasticity gene expression declines (Table 2A) and inflammatory gene expression increases (Table 2D). Both of these shifts are in the direction opposite that promoted by CORT, suggesting potential age-related weakening of CORT actions (eg, possible GC resistance). Moreover, these opposite direction aging changes reflect a relative reversal during aging of the maintenance of neuronal over glial activation by chronic CORT (Figure 2). Interestingly, the impaired activation of plasticity and metabolic processes (37, 49, 72, 91, 92, 94, 95, 109) and excessive activation of glial reactivity/inflammation (16, 69, 85, 110, 116) represent canonical biomarkers of the aging brain, suggesting that alterations in GC signaling may have an important contribution to the brain aging phenotype.
Similarly, a number of processes and CAS genes that shift expression during aging in the same direction promoted by CORT also seem likely to induce established components of the brain aging phenotype. These include metabolic dysregulation, apoptosis, and aberrant growth (Table 2B) and ECM degradation, protein catabolism, and neuronal atrophy (Table 2C). Furthermore, same direction up-regulation of CORT-activated metabolic genes during aging (eg, Table 2B) might play a role in an aging-related shift in bioenergetic gene and protein expression that is seen consistently in the brains of female (49, 109) and male (69, 72) animal models of aging and in female models of Alzheimer disease (117). Therefore, these results suggest the striking conclusion that multiple phenotypic hallmarks of brain aging are generated by aging-related modifications (weakening or strengthening) of selective GC signaling pathways.
New model of GC interactions with brain aging: alterations in GC signaling (Figure 6)
Figure 6.

Proposed model of GC actions in brain aging. N1, Direct-mode GC regulation of gene expression is mediated by binding of GR homodimers to pGREs and nGREs. During aging, elevated GCs increase GR binding to GREs, overstimulating selective pathways in neurons and resulting in excessive activation of differentiation and reduced synthesis of cytoskeletal/ECM components, among other changes. N2, Indirect-mode GC regulation in neurons activates plasticity genes but develops resistance with aging, resulting in impaired plasticity and cognitive function. G1, Direct-mode regulation in glial cells is also amplified with aging, resulting in altered glucose and lipid metabolism. G2, Indirect-mode regulation is prominent in glia, where it primarily mediates repression of glial reactivity and neuroinflammatory genes; as in neurons, indirect-mode regulation develops GC resistance with aging, resulting in emergence of the reactive/inflammatory glial profile. Thus, direct-mode GC regulation pathways in hippocampus are strengthened (resulting in same direction gene shifts), whereas selective indirect-mode GC regulation pathways are weakened (resulting in opposite direction gene shifts), together accounting for much of the brain aging phenotype.
As noted, the basic hypothesis that chronic GCs primarily promote brain aging (19) no longer appears tenable. Accordingly, we propose a new, more complex working model of GC-brain aging interactions. In this view, rather than GCs promoting brain aging, aging modifies GC signaling, and the resulting altered functions of GC regulatory pathways generate much of the brain aging phenotype (Figure 6).
We suggest that aging processes modify GC regulation of expression in selective pathways in 2 general ways: (1) strengthening of GR direct-mode signaling and (2) GC resistance to indirect-mode signaling. Strengthening of the direct-mode results from increased binding of GR dimers to both pGREs and nGREs. Several aging-related changes that could lead to such increased ligand-activated GR binding to GREs have been described, including an increase in circulating GCs, found in many, but not all, rodent and human studies (16, 56, 79, 82, 118), a rise in the 11β-hydroxysteroid dehydrogenase type I to type II ratio (54, 119, 120), or increased expression of GRs and/or epigenetic cofactors (53, 54, 74, 81, 121, 122). (The genes encoding the MR [Nr3C2] and the GR [Nr3C1] were repressed by CORT, but only Nr3C2 was changed [down-regulated] with age as shown in Supplemental Table 1.)
Concurrently, GC resistance develops to the indirect GC regulatory mode, possibly resulting from aging-dependent decreased availability of coregulators (3, 102, 103) or increased expression of dominant negative isoforms that can form heterodimers with GRα (83, 104). Given the diversity of GC signaling pathways, it appears highly feasible that parallel strengthening and weakening of different gene regulatory pathways could develop within the same region or cell type, even in an environment of elevated GCs/GRs. Thus, in this model, dissimilar and largely independent aging changes in direct and indirect GC regulatory pathways combine to generate much of the canonical brain aging phenotype. Clearly, alternative models are possible. Nevertheless, the present model incorporates newly uncovered complexity of hippocampal aging-GC interactions and, therefore, may inform future studies aimed to identify novel therapeutic targets in unhealthy brain aging/AD.
Supplementary Material
Acknowledgments
This work was supported by National Institute of Aging grants AG034605, AG010836, and AG037868.
Disclosure Summary: The authors have nothing to disclose.
Footnotes
- AD
- Alzheimer disease
- ADX
- adrenalectomized
- CAS
- corticosterone- and aging-sensitive
- CORT
- corticosterone
- DAVID
- Database for Annotation, Visualization and Integrated Discovery
- ECM
- extracellular matrix
- FDR
- false discovery rate
- GC
- glucocorticoid
- GFAP
- glial fibrillary acidic protein
- GO
- Gene Ontology
- GR
- glucocorticoid receptor
- GRE
- glucocorticoid response element
- IEG
- immediate early gene
- MR
- mineralocorticoid receptor
- q
- quantitative.
References
- 1. Oakley RH, Cidlowski JA. Cellular processing of the glucocorticoid receptor gene and protein: new mechanisms for generating tissue-specific actions of glucocorticoids. J Biol Chem. 2011;286:3177–3184 [DOI] [PMC free article] [PubMed] [Google Scholar]
- 2. Chrousos GP, Kino T. Glucocorticoid signaling in the cell. Expanding clinical implications to complex human behavioral and somatic disorders. Ann NY Acad Sci. 2009;1179:153–166 [DOI] [PMC free article] [PubMed] [Google Scholar]
- 3. Barnes PJ. Mechanisms and resistance in glucocorticoid control of inflammation. J Steroid Biochem Mol Biol. 2010;120:76–85 [DOI] [PubMed] [Google Scholar]
- 4. Adcock IM, Ito K, Barnes PJ. Glucocorticoids: effects on gene transcription. Proc Am Thorac Soc. 2004;1:247–254 [DOI] [PubMed] [Google Scholar]
- 5. Tischner D, Reichardt HM. Glucocorticoids in the control of neuroinflammation. Mol Cell Endocrinol. 2007;275:62–70 [DOI] [PubMed] [Google Scholar]
- 6. McEwen BS. Central effects of stress hormones in health and disease: Understanding the protective and damaging effects of stress and stress mediators. Eur J Pharmacol. 2008;583:174–185 [DOI] [PMC free article] [PubMed] [Google Scholar]
- 7. de Kloet ER, Karst H, Joëls M. Corticosteroid hormones in the central stress response: quick-and-slow. Front Neuroendocrinol. 2008;29:268–272 [DOI] [PubMed] [Google Scholar]
- 8. Joëls M, Sarabdjitsingh RA, Karst H. Unraveling the time domains of corticosteroid hormone influences on brain activity: rapid, slow, and chronic modes. Pharmacol Rev. 2012;64:901–938 [DOI] [PubMed] [Google Scholar]
- 9. McEwen BS. Physiology and neurobiology of stress and adaptation: central role of the brain. Physiol Rev. 2007;87:873–904 [DOI] [PubMed] [Google Scholar]
- 10. Kerr DS, Campbell LW, Applegate MD, Brodish A, Landfield PW. Chronic stress-induced acceleration of electrophysiologic and morphometric biomarkers of hippocampal aging. J Neurosci. 1991;11:1316–1324 [DOI] [PMC free article] [PubMed] [Google Scholar]
- 11. Lupien SJ, Gaudreau S, Tchiteya BM, et al. Stress-induced declarative memory impairment in healthy elderly subjects: relationship to cortisol reactivity. J Clin Endocrinol Metab. 1997;82:2070–2075 [DOI] [PubMed] [Google Scholar]
- 12. Meaney MJ, Aitken DH, van Berkel C, Bhatnagar S, Sapolsky RM. Effect of neonatal handling on age-related impairments associated with the hippocampus. Science. 1988;239:766–768 [DOI] [PubMed] [Google Scholar]
- 13. Swaab DF, Bao AM, Lucassen PJ. The stress system in the human brain in depression and neurodegeneration. Ageing Res Rev. 2005;4:141–194 [DOI] [PubMed] [Google Scholar]
- 14. Dallman MF, Pecoraro NC, La Fleur SE, et al. Glucocorticoids, chronic stress, and obesity. Prog Brain Res. 2006;153:75–105 [DOI] [PubMed] [Google Scholar]
- 15. Sapolsky RM, Krey LC, McEwen BS. Prolonged glucocorticoid exposure reduces hippocampal neuron number: implications for aging. J Neurosci. 1985;5:1222–1227 [DOI] [PMC free article] [PubMed] [Google Scholar]
- 16. Landfield PW, Waymire JC, Lynch G. Hippocampal aging and adrenocorticoids: quantitative correlations. Science. 1978;202:1098–1102 [DOI] [PubMed] [Google Scholar]
- 17. Sapolsky RM, Krey LC, McEwen BS. The neuroendocrinology of stress and aging: the glucocorticoid cascade hypothesis. Endocr Rev. 1986;7:284–301 [DOI] [PubMed] [Google Scholar]
- 18. McEwen BS. Re-examination of the glucocorticoid hypothesis of stress and aging. Prog Brain Res. 1992;93:365-381; discussion 382–363 [DOI] [PubMed] [Google Scholar]
- 19. Porter NM, Landfield PW. Stress hormones and brain aging: adding injury to insult? Nat Neurosci. 1998;1:3–4 [DOI] [PubMed] [Google Scholar]
- 20. Landfield PW, Baskin RK, Pitler TA. Brain aging correlates: retardation by hormonal-pharmacological treatments. Science. 1981;214:581–584 [DOI] [PubMed] [Google Scholar]
- 21. Reul JM, de Kloet ER. Two receptor systems for corticosterone in rat brain: microdistribution and differential occupation. Endocrinology. 1985;117:2505–2511 [DOI] [PubMed] [Google Scholar]
- 22. Cidlowski JA. Glucocorticoids and their actions in cells. Retina. 2009;29:S21−S23 [DOI] [PubMed] [Google Scholar]
- 23. Dostert A, Heinzel T. Negative glucocorticoid receptor response elements and their role in glucocorticoid action. Curr Pharm Des. 2004;10:2807–2816 [DOI] [PubMed] [Google Scholar]
- 24. Simons SS., Jr Glucocorticoid receptor cofactors as therapeutic targets. Curr Opin Pharmacol. 2010;10:613–619 [DOI] [PMC free article] [PubMed] [Google Scholar]
- 25. Lonard DM, Lanz RB, O'Malley BW. Nuclear receptor coregulators and human disease. Endocr Rev. 2007;28:575–587 [DOI] [PubMed] [Google Scholar]
- 26. Rosenfeld MG, Lunyak VV, Glass CK. Sensors and signals: a coactivator/corepressor/epigenetic code for integrating signal-dependent programs of transcriptional response. Genes Dev. 2006;20:1405–1428 [DOI] [PubMed] [Google Scholar]
- 27. Kelly MJ, Rønnekleiv OK. Control of CNS neuronal excitability by estrogens via membrane-initiated signaling. Mol Cell Endocrinol. 2009;308:17–25 [DOI] [PMC free article] [PubMed] [Google Scholar]
- 28. Zhao L, Brinton RD. Estrogen receptor α and β differentially regulate intracellular Ca2+ dynamics leading to ERK phosphorylation and estrogen neuroprotection in hippocampal neurons. Brain Res. 2007;1172:48–59 [DOI] [PubMed] [Google Scholar]
- 29. Simpkins JW, Richardson TE, Yi KD, Perez E, Covey DF. Neuroprotection with non-feminizing estrogen analogues: an overlooked possible therapeutic strategy. Horm Behav. 2013;63:278–283 [DOI] [PMC free article] [PubMed] [Google Scholar]
- 30. Samarasinghe RA, Witchell SF, DeFranco DB. Cooperativity and complementarity: synergies in non-classical and classical glucocorticoid signaling. Cell Cycle. 2012;11:2819–2827 [DOI] [PMC free article] [PubMed] [Google Scholar]
- 31. Tasker JG, Herman JP. Mechanisms of rapid glucocorticoid feedback inhibition of the hypothalamic-pituitary-adrenal axis. Stress. 2011;14:398–406 [DOI] [PMC free article] [PubMed] [Google Scholar]
- 32. Dallman MF, Akana SF, Strack AM, et al. Chronic stress-induced effects of corticosterone on brain: direct and indirect. Ann NY Acad Sci. 2004;1018:141–150 [DOI] [PubMed] [Google Scholar]
- 33. Song IH, Buttgereit F. Non-genomic glucocorticoid effects to provide the basis for new drug developments. Mol Cell Endocrinol. 2006;246:142–146 [DOI] [PubMed] [Google Scholar]
- 34. Walker DM, Juenger TE, Gore AC. Developmental profiles of neuroendocrine gene expression in the preoptic area of male rats. Endocrinology. 2009;150:2308–2316 [DOI] [PMC free article] [PubMed] [Google Scholar]
- 35. Nogueira EF, Bollag WB, Rainey WE. Angiotensin II regulation of adrenocortical gene transcription. Mol Cell Endocrinol. 2009;302:230–236 [DOI] [PMC free article] [PubMed] [Google Scholar]
- 36. Dennis G, Jr, Sherman BT, Hosack DA, et al. DAVID: database for annotation, visualization, and integrated discovery. Genome Biol. 2003;4:P3. [PubMed] [Google Scholar]
- 37. Blalock EM, Chen KC, Sharrow K, et al. Gene microarrays in hippocampal aging: statistical profiling identifies novel processes correlated with cognitive impairment. J Neurosci. 2003;23:3807–3819 [DOI] [PMC free article] [PubMed] [Google Scholar]
- 38. Draghici S, Khatri P, Bhavsar P, Shah A, Krawetz SA, Tainsky MA. Onto-Tools, the toolkit of the modern biologist: Onto-Express, Onto-Compare, Onto-Design and Onto-Translate. Nucleic Acids Res. 2003;31:3775–3781 [DOI] [PMC free article] [PubMed] [Google Scholar]
- 39. Zhang B, Kirov S, Snoddy J. WebGestalt: an integrated system for exploring gene sets in various biological contexts. Nucleic Acids Res. 2005;33:W741–748 [DOI] [PMC free article] [PubMed] [Google Scholar]
- 40. Miller JA, Oldham MC, Geschwind DH. A systems level analysis of transcriptional changes in Alzheimer's disease and normal aging. J Neurosci. 2008;28:1410–1420 [DOI] [PMC free article] [PubMed] [Google Scholar]
- 41. Kajiyama Y, Iijima Y, Chiba S, et al. Prednisolone causes anxiety- and depression-like behaviors and altered expression of apoptotic genes in mice hippocampus. Prog Neuropsychopharmacol Biol Psychiatry. 2010;34:159–165 [DOI] [PubMed] [Google Scholar]
- 42. Liu Y, Yang N, Zuo P. cDNA microarray analysis of gene expression in the cerebral cortex and hippocampus of BALB/c mice subjected to chronic mild stress. Cell Mol Neurobiol. 2010;30:1035–1047 [DOI] [PMC free article] [PubMed] [Google Scholar]
- 43. Weaver IC, Meaney MJ, Szyf M. Maternal care effects on the hippocampal transcriptome and anxiety-mediated behaviors in the offspring that are reversible in adulthood. Proc Natl Acad Sci USA. 2006;103:3480–3485 [DOI] [PMC free article] [PubMed] [Google Scholar]
- 44. Datson NA, Speksnijder N, Mayer JL, et al. The transcriptional response to chronic stress and glucocorticoid receptor blockade in the hippocampal dentate gyrus. Hippocampus. 2012;22:359–371 [DOI] [PubMed] [Google Scholar]
- 45. Qin Y, Nair S, Karst H, Vreugdenhil E, Datson N, Joëls M. Gene expression changes in single dentate granule neurons after adrenalectomy of rats. Brain Res Mol Brain Res. 2003;111:17–23 [DOI] [PubMed] [Google Scholar]
- 46. Datson NA, Morsink MC, Meijer OC, de Kloet ER. Central corticosteroid actions: search for gene targets. Eur J Pharmacol. 2008;583:272–289 [DOI] [PubMed] [Google Scholar]
- 47. Morsink MC, Steenbergen PJ, Vos JB, et al. Acute activation of hippocampal glucocorticoid receptors results in different waves of gene expression throughout time. J Neuroendocrinol. 2006;18:239–252 [DOI] [PubMed] [Google Scholar]
- 48. Sohrabji F, Bake S. Age-related changes in neuroprotection: is estrogen pro-inflammatory for the reproductive senescent brain? Endocrine. 2006;29:191–197 [DOI] [PubMed] [Google Scholar]
- 49. Brinton RD. The healthy cell bias of estrogen action: mitochondrial bioenergetics and neurological implications. Trends Neurosci. 2008;31:529–537 [DOI] [PMC free article] [PubMed] [Google Scholar]
- 50. Woolley CS, Weiland NG, McEwen BS, Schwartzkroin PA. Estradiol increases the sensitivity of hippocampal CA1 pyramidal cells to NMDA receptor-mediated synaptic input: correlation with dendritic spine density. J Neurosci. 1997;17:1848–1859 [DOI] [PMC free article] [PubMed] [Google Scholar]
- 51. Yin W, Wu D, Noel ML, Gore AC. Gonadotropin-releasing hormone neuroterminals and their microenvironment in the median eminence: effects of aging and estradiol treatment. Endocrinology. 2009;150:5498–5508 [DOI] [PMC free article] [PubMed] [Google Scholar]
- 52. Conrad CD. Chronic stress-induced hippocampal vulnerability: the glucocorticoid vulnerability hypothesis. Rev Neurosci. 2008;19:395–411 [DOI] [PMC free article] [PubMed] [Google Scholar]
- 53. Wei Q, Hebda-Bauer EK, Pletsch A, et al. Overexpressing the glucocorticoid receptor in forebrain causes an aging-like neuroendocrine phenotype and mild cognitive dysfunction. J Neurosci. 2007;27:8836–8844 [DOI] [PMC free article] [PubMed] [Google Scholar]
- 54. Seckl JR, Meaney MJ. Glucocorticoid programming. Ann NY Acad Sci. 2004;1032:63–84 [DOI] [PubMed] [Google Scholar]
- 55. Kerr DS, Campbell LW, Hao SY, Landfield PW. Corticosteroid modulation of hippocampal potentials: increased effect with aging. Science. 1989;245:1505–1509 [DOI] [PubMed] [Google Scholar]
- 56. Issa AM, Rowe W, Gauthier S, Meaney MJ. Hypothalamic-pituitary-adrenal activity in aged, cognitively impaired and cognitively unimpaired rats. J Neurosci. 1990;10:3247–3254 [DOI] [PMC free article] [PubMed] [Google Scholar]
- 57. Lupien SJ, McEwen BS, Gunnar MR, Heim C. Effects of stress throughout the lifespan on the brain, behaviour and cognition. Nat Rev Neurosci. 2009;10:434–445 [DOI] [PubMed] [Google Scholar]
- 58. Green KN, Billings LM, Roozendaal B, McGaugh JL, LaFerla FM. Glucocorticoids increase amyloid-β and tau pathology in a mouse model of Alzheimer's disease. J Neurosci. 2006;26:9047–9056 [DOI] [PMC free article] [PubMed] [Google Scholar]
- 59. Sotiropoulos I, Catania C, Pinto LG, et al. Stress acts cumulatively to precipitate Alzheimer's disease-like tau pathology and cognitive deficits. J Neurosci. 2011;31:7840–7847 [DOI] [PMC free article] [PubMed] [Google Scholar]
- 60. Csernansky JG, Dong H, Fagan AM, et al. Plasma cortisol and progression of dementia in subjects with Alzheimer-type dementia. Am J Psychiatry. 2006;163:2164–2169 [DOI] [PMC free article] [PubMed] [Google Scholar]
- 61. Carroll JC, Iba M, Bangasser DA, et al. Chronic stress exacerbates tau pathology, neurodegeneration, and cognitive performance through a corticotropin-releasing factor receptor-dependent mechanism in a transgenic mouse model of tauopathy. J Neurosci. 2011;31:14436–14449 [DOI] [PMC free article] [PubMed] [Google Scholar]
- 62. O'Callaghan JP, Brinton RE, McEwen BS. Glucocorticoids regulate the concentration of glial fibrillary acidic protein throughout the brain. Brain Res. 1989;494:159–161 [DOI] [PubMed] [Google Scholar]
- 63. Nichols NR, Finch CE. Gene products of corticosteroid action in hippocampus. Ann NY Acad Sci. 1994;746:145-154; discussion 154–146 [DOI] [PubMed] [Google Scholar]
- 64. McReynolds JR, Donowho K, Abdi A, McGaugh JL, Roozendaal B, McIntyre CK. Memory-enhancing corticosterone treatment increases amygdala norepinephrine and Arc protein expression in hippocampal synaptic fractions. Neurobiol Learn Mem. 2010;93:312–321 [DOI] [PMC free article] [PubMed] [Google Scholar]
- 65. Beeri MS, Schmeidler J, Lesser GT, et al. Corticosteroids, but not NSAIDs, are associated with less Alzheimer neuropathology. Neurobiol Aging. 2012;33:1258–1264 [DOI] [PMC free article] [PubMed] [Google Scholar]
- 66. Landfield PW, Blalock EM, Chen KC, Porter NM. A new glucocorticoid hypothesis of brain aging: implications for Alzheimer's disease. Curr Alzheimer Res. 2007;4:205–212 [DOI] [PMC free article] [PubMed] [Google Scholar]
- 67. Makino S, Schulkin J, Smith MA, Pacák K, Palkovits M, Gold PW. Regulation of corticotropin-releasing hormone receptor messenger ribonucleic acid in the rat brain and pituitary by glucocorticoids and stress. Endocrinology. 1995;136:4517–4525 [DOI] [PubMed] [Google Scholar]
- 68. Bolstad BM, Collin F, Simpson KM, Irizarry RA, Speed TP. Experimental design and low-level analysis of microarray data. Int Rev Neurobiol. 2004;60:25–58 [DOI] [PubMed] [Google Scholar]
- 69. Kadish I, Thibault O, Blalock EM, et al. Hippocampal and cognitive aging across the lifespan: a bioenergetic shift precedes and increased cholesterol trafficking parallels memory impairment. J Neurosci. 2009;29:1805–1816 [DOI] [PMC free article] [PubMed] [Google Scholar]
- 70. Buechel HM, Popovic J, Searcy JL, Porter NM, Thibault O, Blalock EM. Deep sleep and parietal cortex gene expression changes are related to cognitive deficits with age. PLoS One. 2011;6:e18387. [DOI] [PMC free article] [PubMed] [Google Scholar]
- 71. Hochberg Y, Benjamini Y. More powerful procedures for multiple significance testing. Stat Med. 1990;9:811–818 [DOI] [PubMed] [Google Scholar]
- 72. Rowe WB, Blalock EM, Chen KC, et al. Hippocampal expression analyses reveal selective association of immediate-early, neuroenergetic, and myelinogenic pathways with cognitive impairment in aged rats. J Neurosci. 2007;27:3098–3110 [DOI] [PMC free article] [PubMed] [Google Scholar]
- 73. Blalock EM, Buechel HM, Popovic J, Geddes JW, Landfield PW. Microarray analyses of laser-captured hippocampus reveal distinct gray and white matter signatures associated with incipient Alzheimer's disease. J Chem Neuroanat. 2011;42:118–126 [DOI] [PMC free article] [PubMed] [Google Scholar]
- 74. Blalock EM, Grondin R, Chen KC, et al. Aging-related gene expression in hippocampus proper compared with dentate gyrus is selectively associated with metabolic syndrome variables in rhesus monkeys. J Neurosci. 2010;30:6058–6071 [DOI] [PMC free article] [PubMed] [Google Scholar]
- 75. Blalock EM, Chen KC, Stromberg AJ, et al. Harnessing the power of gene microarrays for the study of brain aging and Alzheimer's disease: statistical reliability and functional correlation. Ageing Res Rev. 2005;4:481–512 [DOI] [PubMed] [Google Scholar]
- 76. Huang da W, Sherman BT, Lempicki RA. Systematic and integrative analysis of large gene lists using DAVID bioinformatics resources. Nat Protoc. 2009;4:44–57 [DOI] [PubMed] [Google Scholar]
- 77. Ashburner M, Ball CA, Blake JA, et al. Gene ontology: tool for the unification of biology. The Gene Ontology Consortium. Nat Genet. 2000;25:25–29 [DOI] [PMC free article] [PubMed] [Google Scholar]
- 78. Huang da W, Sherman BT, Tan Q, et al. The DAVID Gene Functional Classification Tool: a novel biological module-centric algorithm to functionally analyze large gene lists. Genome Biol. 2007;8:R183. [DOI] [PMC free article] [PubMed] [Google Scholar]
- 79. Sonntag WE, Goliszek AG, Brodish A, Eldridge JC. Diminished diurnal secretion of adrenocorticotropin (ACTH), but not corticosterone, in old male rats: possible relation to increased adrenal sensitivity to ACTH in vivo. Endocrinology. 1987;120:2308–2315 [DOI] [PubMed] [Google Scholar]
- 80. Dhabhar FS, McEwen BS, Spencer RL. Adaptation to prolonged or repeated stress—comparison between rat strains showing intrinsic differences in reactivity to acute stress. Neuroendocrinology. 1997;65:360–368 [DOI] [PubMed] [Google Scholar]
- 81. Kasckow J, Xiao C, Herman JP. Glial glucocorticoid receptors in aged Fisher 344 (F344) and F344/Brown Norway rats. Exp Gerontol. 2009;44:335–343 [DOI] [PMC free article] [PubMed] [Google Scholar]
- 82. Sapolsky RM. Do glucocorticoid concentrations rise with age in the rat? Neurobiol Aging. 1992;13:171–174 [DOI] [PubMed] [Google Scholar]
- 83. De Kloet ER, Vreugdenhil E, Oitzl MS, Joëls M. Brain corticosteroid receptor balance in health and disease. Endocr Rev. 1998;19:269–301 [DOI] [PubMed] [Google Scholar]
- 84. Landfield PW. Modulation of brain aging correlates by long-term alterations of adrenal steroids and neurally-active peptides. Prog Brain Res. 1987;72:279–300 [DOI] [PubMed] [Google Scholar]
- 85. Dinapoli VA, Benkovic SA, Li X, et al. Age exaggerates proinflammatory cytokine signaling and truncates signal transducers and activators of transcription 3 signaling following ischemic stroke in the rat. Neuroscience. 2010;170:633–644 [DOI] [PMC free article] [PubMed] [Google Scholar]
- 86. O'Keefe GM, Nguyen VT, Benveniste EN. Regulation and function of class II major histocompatibility complex, CD40, and B7 expression in macrophages and microglia: Implications in neurological diseases. J Neurovirol. 2002;8:496–512 [DOI] [PubMed] [Google Scholar]
- 87. Zamanian JL, Xu L, Foo LC, et al. Genomic analysis of reactive astrogliosis. J Neurosci. 2012;32:6391–6410 [DOI] [PMC free article] [PubMed] [Google Scholar]
- 88. Cintra A, Bhatnagar M, Chadi G, et al. Glial and neuronal glucocorticoid receptor immunoreactive cell populations in developing, adult, and aging brain. Ann NY Acad Sci. 1994;746:42-61; discussion 61–43 [DOI] [PubMed] [Google Scholar]
- 89. Morsink MC, Van Gemert NG, Steenbergen PJ, Joëls M, De Kloet ER, Datson NA. Rapid glucocorticoid effects on the expression of hippocampal neurotransmission-related genes. Brain Res. 2007;1150:14–20 [DOI] [PubMed] [Google Scholar]
- 90. Kotti T, Head DD, McKenna CE, Russell DW. Biphasic requirement for geranylgeraniol in hippocampal long-term potentiation. Proc Natl Acad Sci USA. 2008;105:11394–11399 [DOI] [PMC free article] [PubMed] [Google Scholar]
- 91. Guzowski JF, Setlow B, Wagner EK, McGaugh JL. Experience-dependent gene expression in the rat hippocampus after spatial learning: a comparison of the immediate-early genes Arc, c-fos, and zif268. J Neurosci. 2001;21:5089–5098 [DOI] [PMC free article] [PubMed] [Google Scholar]
- 92. Penner MR, Roth TL, Chawla MK, et al. Age-related changes in Arc transcription and DNA methylation within the hippocampus. Neurobiol Aging. 2011;32:2198–2210 [DOI] [PMC free article] [PubMed] [Google Scholar]
- 93. Mans RA, McMahon LL, Li L. Simvastatin-mediated enhancement of long-term potentiation is driven by farnesyl-pyrophosphate depletion and inhibition of farnesylation. Neuroscience. 2012;202:1–9 [DOI] [PMC free article] [PubMed] [Google Scholar]
- 94. Vreugdenhil E, de Kloet ER, Schaaf M, Datson NA. Genetic dissection of corticosterone receptor function in the rat hippocampus. Eur Neuropsychopharmacol. 2001;11:423–430 [DOI] [PubMed] [Google Scholar]
- 95. Hansson AC, Fuxe K. Time-course of immediate early gene expression in hippocampal subregions of adrenalectomized rats after acute corticosterone challenge. Brain Res. 2008;1215:1–10 [DOI] [PMC free article] [PubMed] [Google Scholar]
- 96. Sofroniew MV. Molecular dissection of reactive astrogliosis and glial scar formation. Trends Neurosci. 2009;32:638–647 [DOI] [PMC free article] [PubMed] [Google Scholar]
- 97. Petanceska SS, DeRosa S, Sharma A, et al. Changes in apolipoprotein E expression in response to dietary and pharmacological modulation of cholesterol. J Mol Neurosci. 2003;20:395–406 [DOI] [PubMed] [Google Scholar]
- 98. Magistretti PJ. Neuron-glia metabolic coupling and plasticity. J Exp Biol. 2006;209:2304–2311 [DOI] [PubMed] [Google Scholar]
- 99. Rinholm JE, Hamilton NB, Kessaris N, Richardson WD, Bergersen LH, Attwell D. Regulation of oligodendrocyte development and myelination by glucose and lactate. J Neurosci. 2011;31:538–548 [DOI] [PMC free article] [PubMed] [Google Scholar]
- 100. Gross KL, Cidlowski JA. Tissue-specific glucocorticoid action: a family affair. Trends Endocrinol Metab. 2008;19:331–339 [DOI] [PMC free article] [PubMed] [Google Scholar]
- 101. Nixon M, Andrew R, Chapman KE. It takes two to tango: dimerisation of glucocorticoid receptor and its anti-inflammatory functions. Steroids. 2013;78:59–68 [DOI] [PubMed] [Google Scholar]
- 102. Chinenov Y, Gupte R, Dobrovolna J, et al. Role of transcriptional coregulator GRIP1 in the anti-inflammatory actions of glucocorticoids. Proc Natl Acad Sci USA. 2012;109:11776–11781 [DOI] [PMC free article] [PubMed] [Google Scholar]
- 103. Uhlenhaut NH, Barish GD, Yu RT, et al. Insights into negative regulation by the glucocorticoid receptor from genome-wide profiling of inflammatory cistromes. Mol Cell. 2013;49:158–171 [DOI] [PMC free article] [PubMed] [Google Scholar]
- 104. Lewis-Tuffin LJ, Cidlowski JA. The physiology of human glucocorticoid receptor β (hGRβ) and glucocorticoid resistance. Ann NY Acad Sci. 2006;1069:1–9 [DOI] [PubMed] [Google Scholar]
- 105. Savory JG, Préfontaine GG, Lamprecht C, et al. Glucocorticoid receptor homodimers and glucocorticoid-mineralocorticoid receptor heterodimers form in the cytoplasm through alternative dimerization interfaces. Mol Cell Biol. 2001;21:781–793 [DOI] [PMC free article] [PubMed] [Google Scholar]
- 106. Chen Sy, Wang J, Yu Gq, Liu W, Pearce D. Androgen and glucocorticoid receptor heterodimer formation. A possible mechanism for mutual inhibition of transcriptional activity. J Biol Chem. 1997;272:14087–14092 [DOI] [PubMed] [Google Scholar]
- 107. Farrell RJ, Kelleher D. Glucocorticoid resistance in inflammatory bowel disease. J Endocrinol. 2003;178:339–346 [DOI] [PubMed] [Google Scholar]
- 108. Webster JI, Sternberg EM. Role of the hypothalamic-pituitary-adrenal axis, glucocorticoids and glucocorticoid receptors in toxic sequelae of exposure to bacterial and viral products. J Endocrinol. 2004;181:207–221 [DOI] [PubMed] [Google Scholar]
- 109. Yao J, Hamilton RT, Cadenas E, Brinton RD. Decline in mitochondrial bioenergetics and shift to ketogenic profile in brain during reproductive senescence. Biochim Biophys Acta. 2010;1800:1121–1126 [DOI] [PMC free article] [PubMed] [Google Scholar]
- 110. Dilger RN, Johnson RW. Aging, microglial cell priming, and the discordant central inflammatory response to signals from the peripheral immune system. J Leukoc Biol. 2008;84:932–939 [DOI] [PMC free article] [PubMed] [Google Scholar]
- 111. Gemma C, Bickford PC. Interleukin-1β and caspase-1: players in the regulation of age-related cognitive dysfunction. Rev Neurosci. 2007;18:137–148 [DOI] [PubMed] [Google Scholar]
- 112. McGeer PL, McGeer EG. Inflammation and the degenerative diseases of aging. Ann NY Acad Sci. 2004;1035:104–116 [DOI] [PubMed] [Google Scholar]
- 113. Mrak RE, Griffin WS. Potential inflammatory biomarkers in Alzheimer's disease. J Alzheimers Dis. 2005;8:369–375 [DOI] [PubMed] [Google Scholar]
- 114. Prolla TA, Mattson MP. Molecular mechanisms of brain aging and neurodegenerative disorders: lessons from dietary restriction. Trends Neurosci. 2001;24:S21–S31 [DOI] [PubMed] [Google Scholar]
- 115. Terry RD, DeTeresa R, Hansen LA. Neocortical cell counts in normal human adult aging. Ann Neurol. 1987;21:530–539 [DOI] [PubMed] [Google Scholar]
- 116. Griffin WS. Neuroinflammatory cytokine signaling and Alzheimer's disease. N Engl J Med. 2013;368:770–771 [DOI] [PubMed] [Google Scholar]
- 117. Yao J, Irwin RW, Zhao L, Nilsen J, Hamilton RT, Brinton RD. Mitochondrial bioenergetic deficit precedes Alzheimer's pathology in female mouse model of Alzheimer's disease. Proc Natl Acad Sci USA. 2009;106:14670–14675 [DOI] [PMC free article] [PubMed] [Google Scholar]
- 118. Wilkinson CW, Petrie EC, Murray SR, Colasurdo EA, Raskind MA, Peskind ER. Human glucocorticoid feedback inhibition is reduced in older individuals: evening study. J Clin Endocrinol Metab. 2001;86:545–550 [DOI] [PubMed] [Google Scholar]
- 119. Gottfried-Blackmore A, Sierra A, McEwen BS, Ge R, Bulloch K. Microglia express functional 11β-hydroxysteroid dehydrogenase type 1. Glia. 2010;58:1257–1266 [DOI] [PubMed] [Google Scholar]
- 120. Yau JL, Seckl JR. Local amplification of glucocorticoids in the aging brain and impaired spatial memory. Front Aging Neurosci. 2012;4:24. [DOI] [PMC free article] [PubMed] [Google Scholar]
- 121. Meaney MJ, Szyf M. Maternal care as a model for experience-dependent chromatin plasticity? Trends Neurosci. 2005;28:456–463 [DOI] [PubMed] [Google Scholar]
- 122. Wang Q, Joëls M, Swaab DF, Lucassen PJ. Hippocampal GR expression is increased in elderly depressed females. Neuropharmacology. 2012;62:527–533 [DOI] [PubMed] [Google Scholar]
Associated Data
This section collects any data citations, data availability statements, or supplementary materials included in this article.