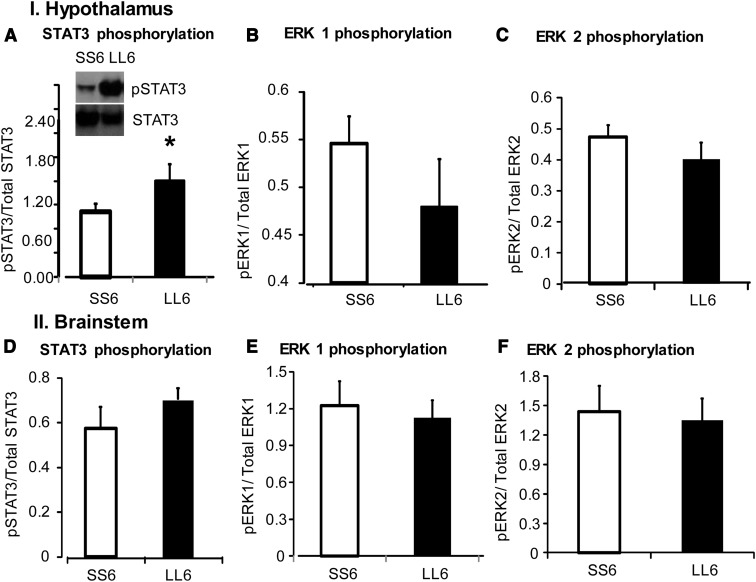
Figure 5.
Western blot analysis of total STAT3 expression and phosphorylation (p) of leptin signaling proteins STAT3 and ERK1 and -2 in hypothalamic and brainstem tissue of saline-infused (SS6) and double ventricle leptin-infused rats (LL6) for 6 days in experiment 2. Data are means ± SEM for 8 rats. *, Significant difference between saline and LL rats at P < .05.

