Abstract
Understanding the conformation of antibodies, especially those of therapeutic value, is of great interest. Many of the current analytical methods used to probe protein conformation face issues in the analysis of antibodies, either due to the nature of the antibody itself or the limitations of the method. One method that has recently been utilized for conformational analysis of antibodies is hydrogen/deuterium exchange mass spectrometry (H/DX MS). H/DX MS can be used to probe the conformation and dynamics of proteins in solution, requires small sample quantities, is compatible with many buffer systems, and provides peptide-level resolution. The application of H/DX MS to immunoglobulin gamma 1 (IgG1) recombinant monoclonal antibodies can provide information about IgG1 conformation, dynamics, and changes to conformation as a result of protein modification(s), changes in storage conditions, purification procedures, formulation, and many other parameters. In this article we provide a comprehensive HD/X MS protocol for the analysis of an antibody.
Keywords: immunoglobin, deuterium, conformation, protein structure, antibody, hydrogen exchange
1. Introduction
Recombinant monoclonal antibodies (mAbs) are valuable biopharmaceuticals that can be used to treat a wide range of illnesses (1–5). The specificity and diversity of antibodies, along with manufacturing compatibility, have made mAbs dominant players in the development pipelines and clinical programs of many biopharmaceutical companies (5–6). A major class of therapeutic mAbs is immunoglobulin gamma 1 (IgG1), a large globular glycoprotein with approximately 1330 amino acids and a molecular weight approaching 150 kilodaltons. Intact IgG1 is a homodimer containing 2 heavy chains (~440 residues each) and 2 light chains (~215 residues each) tethered together with inter-chain disulfide linkages. In total, there are 16 disulfide bonds in an IgG1 (4 inter-chain and 12 intra-chain), in addition to one conserved but heterogeneous N-linked glycan on each heavy chain (7–8).
Characterizing the conformation and structural dynamics of an antibody (or any protein for that matter) can be a major analytical challenge. Many available structural techniques are either extremely sophisticated, requiring very specialized skills and large amounts of sample (> μM quantities), or are of low resolution, making detailed structural analysis difficult. As a result, it is highly desirable to have techniques available that can probe protein structure with low sample requirements, good resolution, and relatively fast turnaround time. We have explored (9–10) the suitability of hydrogen/deuterium exchange mass spectrometry (H/DX MS) for this purpose and found that it provides a great number of analytical advantages for the conformational analysis of antibodies.
Hydrogen/deuterium exchange is a phenomenon whereby hydrogen atoms, at labile positions in proteins, spontaneously change places with hydrogen atoms in the surrounding solvent (11). Backbone amide hydrogens are particularly of interest in this process and due to variations in their chemical and physical environment induced by protein structure, exchange rates of these hydrogens in a folded protein can vary over many orders of magnitude (11–13). Information about protein conformation and, most importantly, differences in protein conformation between two or more forms of the same protein can be extracted by monitoring the exchange reaction. An analytical method sensitive to the differences between the isotopes of hydrogen is required to observe hydrogen exchange. Nuclear magnetic resonance (NMR), infrared spectroscopy (FTIR) and mass spectrometry (MS) have been all utilized to make the measurement; hydrogen exchange measured by mass spectrometry will be described here.
The combination of hydrogen exchange with mass spectrometry has been extensively reviewed [e.g., Refs (13–21)]. Upon introduction of >95% D2O to a protein in an all H2O buffer at physiological pH (7.0–8.0), the exchange reaction itself is catalyzed primary by a base-driven mechanism, but is dramatically slowed (by at least four orders of magnitude) when the pH is reduced to 2.5 (11). The exchange reaction is also temperature dependent: by lowering the temperature to 0 °C, the rate of exchange is slowed by another order of magnitude. Coupling low pH with low temperature (quench conditions) reduces the rate of exchange such that the incorporation of deuterium can be measured with modern liquid chromatography and mass spectrometry. As hydrogen has a mass of 1.008 Da and deuterium (the second isotope of hydrogen) has a mass of 2.014 Da, hydrogen exchange can be followed by measuring the mass of a protein with a mass spectrometer. By incorporating proteolytic digestion between the quench step and the mass analysis (22), the location of the deuterium in the labeled protein can be resolved to short stretches of the protein backbone.
While an H/DX MS experiment can be applied to mAbs, particularly an IgG1, this experiment is not without its challenges. On the following pages, we describe our detailed protocol for making these measurements and provide helpful tips we have discovered in the process of optimizing the protocol for H/DX MS analysis of an IgG1.
2. Materials
In general, approximately 50 μL of a 3 mg/mL protein solution is required to carry out these experiments for a whole, intact IgG1. The protein concentration required may be less if the protein being investigated, such as scFV’s, antibody fragments (i.e., Fc’s and Fab’s), nanobodies etc., is <50 kDa. In the case of smaller proteins, at least 100 μL of a 1 mg/mL protein solution would be ideal. As an example, the following protocol will focus on the analysis of a recombinant monoclonal IgG1 antibody. This example has been specifically optimized for the final amount of protein (in pmoles) that is needed for a high quality MS signal. Other volumes, concentrations and amounts of protein can be used, but the key variable is the amount loaded into the mass spectrometer. Should deviation from the following be used, the volumes and concentrations at each step must be determined.
2.1 Antibody Sample
The recombinant monoclonal IgG1 antibody sample used in this protocol was formulated at approximately 3 mg/mL in 50 mM sodium phosphate, 100 mM NaCl, pH 6.0 (see Note 1).
2.2 Buffers and solutions
Sodium phosphate (Sigma, St. Louis, MO).
Sodium chloride (NaCl) (Sigma, St. Louis, MO).
Hydrochloric acid (HCl) (Sigma, St. Louis, MO).
Sodium hydroxide (NaOH) (Arcos, Morris Plains, NJ).
Acetonitrile (ACN) optima (Fisher, Pittsburgh, PA).
Water, optima W6 (Fisher, Pittsburgh, PA).
Formic Acid ~98% (Fluka, St. Louis, MO).
Deuterium oxide (D2O), (D 99.96%), low paramagnetic (Cambridge Isotope Laboratories, Andover, MA). (see Note 2)
Deuterium chloride (DCl), 20% in D2O (D 99.96%) (Cambridge Isotope Laboratories, Andover, MA).
Sodium deuteroxide (NaOD) 40% in D2O (D 99.5%) (Cambridge Isotope Laboratories, Andover, MA).
Guanidine hydrochloride (GndHCl) (Pierce, Rockford, IL).
TCEP (Tris(2-carboxyethyl)phosphine) (Pierce, Rockford, IL).
pH 4.00, 7.00, and 10.00 standard buffer solutions (Fisher, Pittsburgh, PA).
[Glu1]-Fibrinopeptide B human (GFP), product #F3261 > 90% (HPLC) (Sigma, St. Louis, MO).
Mobile phase A: Water and 0.05% formic acid
Mobile phase B: ACN and 0.05% formic acid
Mobile phase C (digestion buffer): Water and 0.05% formic acid
Lockmass solution: 400 fmol/μL GFP, 50% ACN and water, 0.1% formic acid
Equilibration buffer: 50 mM sodium phosphate, 100 mM NaCl, H2O, pH 6.00 (see Note 3)
Labeling buffer: 50 mM sodium phosphate, 100 mM NaCl, D2O, pD 6.00 (see Note 4).
Quench buffer: 200 mM sodium phosphate, 0.5 M TCEP, 4 M GndHCl, H2O, pH 2.35 (see Note 5)
2.3 Equipment
pH meter capable of accuracy to 0.01 units and 3-point calibration (e.g., Accumet Basic, AB15 plus, Fisher, Pittsburgh, PA).
pH micro probe capable of pH measurements in 50 μL solution (e.g., Mettler Toledo, Schwerzenbach, Switzerland).
Timer (Fisher, Pittsburgh, PA).
10 K MWCO Amicon Biomax centrifugal membrane filters (0.5, 4, or 15 mL) (Millipore, Billerica, MA).
Porozyme pepsin digestion column (Applied Biosystems, Carlsbad, CA).
UPLC system able to control at least three mobile phase solutions simultaneously, along with a cooled chamber capable of maintaining 0 ± 0.5 °C or equivalent (See Note 6).
UPLC separation column, nanoACQUITY BEH C18, 1.7 μm, 1 mm X 100 mm (Waters, Milford, MA), or equivalent.
UPLC guard column (peptide trap), nanoACQUITY BEH C18, 1.7 μm, 2.1 mm X 5 mm (Waters, Milford, MA), or equivalent (See Note 7).
Mass Spectrometer with electrospray ionization (ESI) capable of tandem MS, Waters Synapt MS (Milford, MA) or equivalent.
Excel-based macro HX Express (23), freely available from www.hxms.com.
Syringe for sample injection, 50 μL gastight syringe or equivalent (Hamilton, Reno, NV).
3. Methods
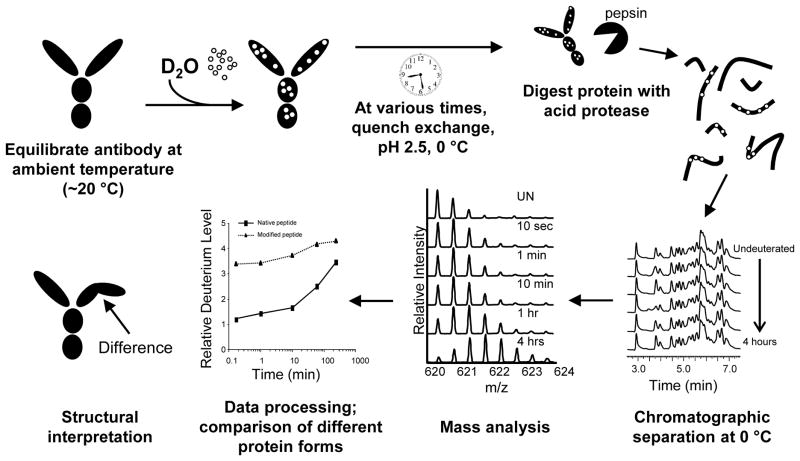
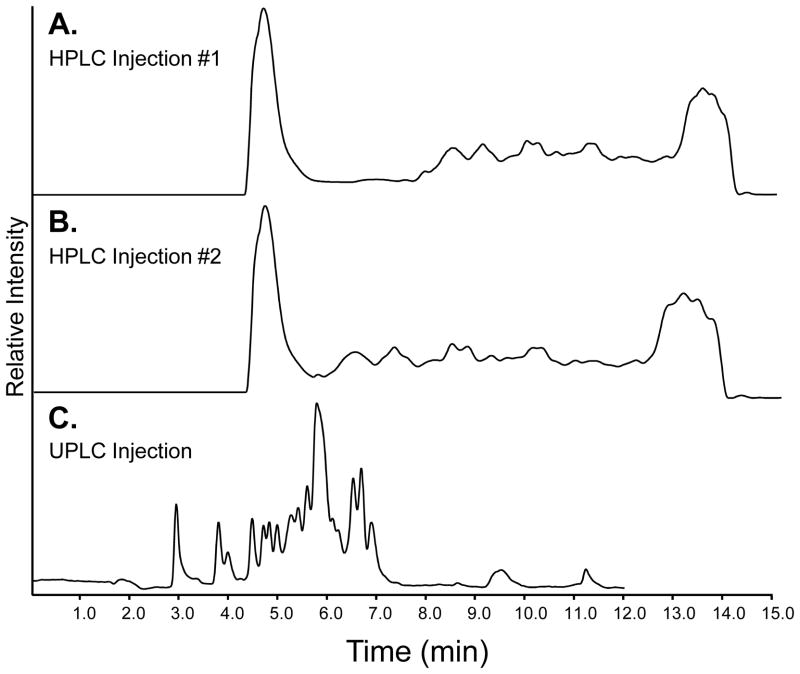
Localizing conformational information for an antibody by H/DX MS involves several steps: labeling the protein with deuterium, quenching the reaction, digesting the protein, chromatographically separating the peptides, and mass analysis. Figure 1 shows the workflow of a typical continuous labeling H/DX MS experiment. The details of each step are described below in Section 3.1. At the start of each experiment, an undeuterated control is often analyzed several times (at least 3 times) to ensure that the proteolytic digestion and peptide identification are reproducible. While H/DX MS experiments can be conducted on essentially any chromatographic system, we have found that UPLC offers many benefits over traditional HPLC (24–25), including lower sample requirements, higher sensitivity, and better reproducibility (9). Figure 2 shows a representative chromatographic separation of a pepsin digested IgG1 using HPLC (Figure 2A and B) and UPLC (Figure 2C). To promote the efficient pepsin digestion of the protein, the quench buffer contains a denaturant (guanidine hydrochloride) and a reducing agent (TCEP) (26) to break disulfide bonds (see Notes 8–9). The reducing agent is necessary only if the protein contains disulfide bonds, which is the case for IgG1.
Figure 1.
Workflow of a hydrogen exchange mass spectrometry experiment. This schematic represents a continuous labeling experiment, with arrows indicating the direction of the experiment. The antibody is incubated at ambient temperature and in formulation buffer. The protein is diluted ~20 fold with deuterated formulation buffer. The antibody is incubated for predetermined amounts of time before the reaction is quenched by dropping the pH to ~2.5 and the temperature to 0 °C. The quenched antibody is digested with an acid protease (pepsin) and peptides are separated by UPLC at 0 °C before being introduced into the mass spectrometer. The mass of each peptide is determined for each deuterium time point and the deuterium incorporation is plotted versus time. A structural interpretation can then be made if the structure is known or a structural model is available.
Figure 2.
Total ion chromatograms of IgG1 peptic peptides separated by HPLC and UPLC. (A) HPLC injection #1, ~100 μg of pepsin digested IgG1. (B) HPLC injection #2, a replicate using the same sample as in HPLC injection #1. (C) UPLC separation of ~15 μg of pepsin digested IgG1. See section 3.7.3 for gradient program.
3.1 UPLC and MS system set up
For on-line digestion the LC system must be capable of handling 3 mobile phases (see Note 6). Mobile phases A and B are for separating peptides and mobile phase C is for the on-line digestion (27) and desalting the peptides. The system should also contain a cooling apparatus capable of maintaining 0 ±0.5 °C and valves able to divert solvent flow for antibody digestion, desalting, and separation (24, 27).
Before preparing antibody samples for analysis, ensure that the UPLC system mobile phases are in place and all lines have been purged of air bubbles.
The UPLC system should be equilibrated at initial gradient conditions for at least 30 minutes before sample analysis. For the Waters nanoACQUITY HDX system, mobile phases A and B operating at 40 μL/min should produce a back pressure between 8500–9500 psi when connected to the nanoACQUITY BEH C18 1.7 μm guard and separation columns and running at 0 °C. At room temperature the back pressure is approximately 5000–6000 psi.
Mobile phase C, the digestion buffer, is most often set at a flow rate of 100 μL/min. At this flow rate, the operating back pressure should be 700 to 1100 psi at 10 °C. The pressure of the column under non-injection conditions will be approximately 700 psi, while during an injection the pressure will increase to approximately 1000 psi. These pressures primarily result from the UPLC lines (see Note 10).
The cooling system should be turned on and set to 0 °C. Let the system run for at least 60 minutes to equilibrate the temperature before analysis. This will ensure that the entire thermal mass of the system has reached 0 ± 0.5 °C.
Before sample analysis begins, the mass spectrometer should be tuned and calibrated with an appropriate standard, such as Glu-fib (GFP) (see Note 11). GFP is a common peptide standard and recommended for calibration by MS/MS fragmentation. GFP will fragment into several ions, at least 10 of these ions should be found to make the calibration curve such that the average mass accuracy is at least 3 ppm.
3.2 Antibody Sample Preparation
Measure antibody concentration. Concentrations can be calculated from the absorbance measured at 280 nm using an experimentally determined or theoretical extinction coefficient (e.g., ε = 218,292 M−1 cm−1) (28–29) or with a Bradford or similar assay (30).
Bring the antibody to the right starting concentration, in this example 3 mg/mL (see Note 1).
3.3 Label Antibody and Quench Each Reaction
The steps outlined below describe labeling of individual time points, one at a time. If multiple time points are desired, an alternative is to make them all from a larger “master solution” by multiplying the volumes in step 1 by the number of samples desired. Aliquots are then removed from the master labeling solution at each labeling timepoint and quenched as described in steps 3–4.
Add 19 μL of labeling buffer to 1 μL of 3 mg/mL antibody solution (the resulting solution is ~95% D2O). Adding a larger volume to a smaller volume will result in better sample mixing. Allow labeling to proceed at ambient temperature (20 ± 1 °C), or any desired temperature, for 10 seconds, 1, 10, 60 and 240 minutes (or for any desired time course).
An undeuterated control (0 time point) is created by substituting the 19 μL of labeling buffer with 19 μL of equilibration buffer.
Once each labeling time has been reached, quench the reaction by diluting the deuterated antibody sample 1:1 with quench buffer (20 μL of quench buffer + 20 μL of deuterated antibody sample). Other volumes of quench buffer could also be used. Vortex or mix the solution for 20–30 30 seconds, some antibodies may require a longer mixing time.
If quenched samples are not to be analyzed immediately, they can be flash-frozen and stored at −80 °C for less than 14 days before mass analysis (see Note 12).
3.5 Sample Injection
For this example, the UPLC system should be equipped with a sample loop to accommodate up to 40 μL of injected sample (see Note 13).
Quenched samples (~20 pmoles or 3 μg) are injected directly onto the pepsin column. If quenched samples were frozen prior to analysis, these samples should take no more than 20 seconds to thaw (see Note 14).
3.6 Antibody Digestion
Antibody samples are digested with the on-line pepsin column in water and 0.05% formic acid. 0.05% formic acid has a pH of approximately 2.5, which is optimal for preserving the deuterium label (11).
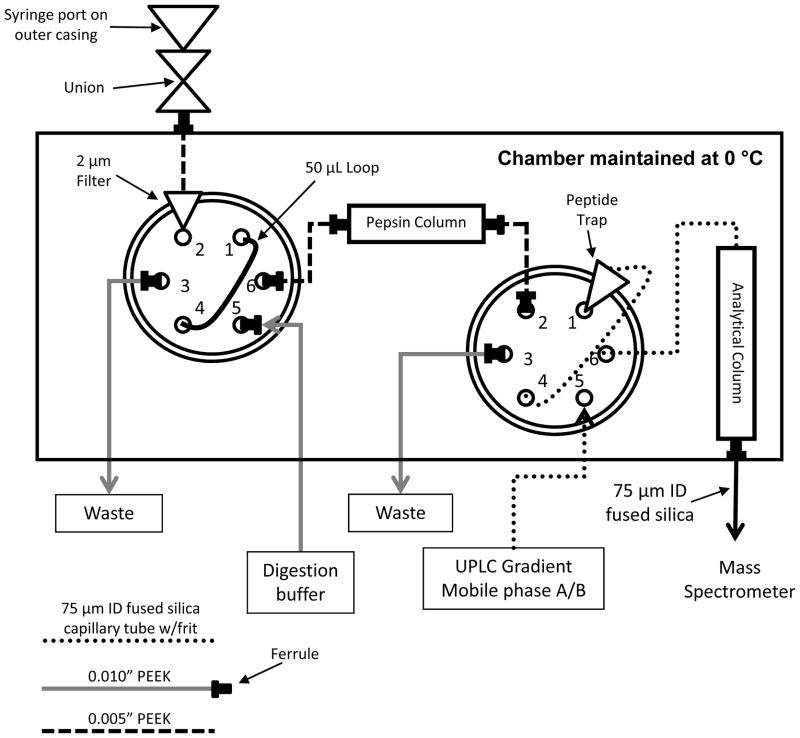
Here, the valve system is set up (Figure 3) so that after the antibody sample is injected onto the sample loop, it is transferred into the pepsin column for digestion (27). The digestion typically lasts 30 seconds for a 50 μL sample loop with mobile phase C flowing at 100 μL/min. The antibody peptides produced in the pepsin column are collected on the UPLC BEH C18 peptide trap and subsequently desalted by mobile phase C for 2–3 minutes before separation begins.
A digestion and trapping time of 3 minutes is often sufficient to completely digest the antibody and desalt the antibody peptides (See Note 15).
Figure 3.
Schematic representation of UPLC valve setup for an H/DX MS experiment (based on Ref. (27)). The injection valve is on the left in this diagram and the switching valve is on the right. The valves and columns are cooled to 0 °C for digestion, desalting and separation prior to MS analysis. The UPLC solvents are typically held at ambient temperature but are chilled by the Waters HDX system before entering the cold chamber.
3.7 Chromatographic Separation and Mass Analysis
During the antibody digestion, the valve system (Figure 3) isolates the analytical separation column from the on-line digestion. Once the digestion is complete, a switching valve switches, enabling mobile phases A and B to access the UPLC BEH C18 peptide trap.
The acetonitrile gradient from pumps A and B elutes the peptic peptides from the peptide trap onto the separation column.
-
A representative chromatographic gradient (see Note 16) is below, and the resulting separation of IgG1 peptic peptides is shown in Figure 4.
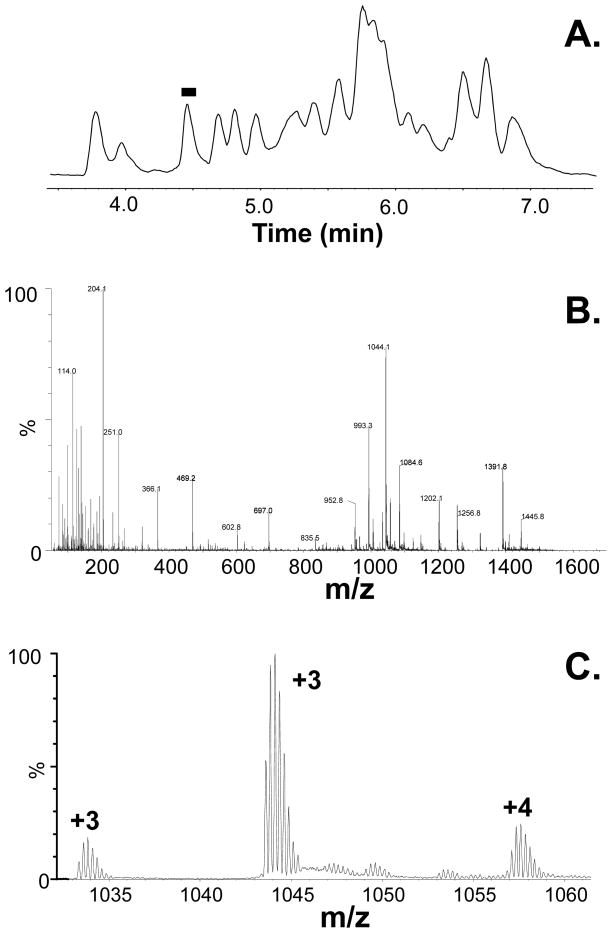
Time (min) Flow (μL/min) %A (water) %B (acetonitrile) 0.0 40 95 5 8.0 40 70 30 10.0 40 60 40 10.5 40 5 95 13.0 40 5 95 14.0 40 95 5 Instrument Parameter Value Polarity ESI+ Analyzer V mode Capillary (kV) 3.2 Sampling Cone (V) 40 Source Temp (°C) 80 Desolvation Temp (°C) 175 Survey Start m/z 255 Survey End m/z 1800 Product High CE (V) 30 Parent Survey Low CE (V) 6 Cone Gas Flow (L/hr) 0 Desolvation Gas Flow (L/hr) 600 Survey Scan Time (sec) 0.25 Survey Interscan Time (sec) 0.02 Survey Data Format Continuum Figure 5A shows the total ion chromatogram of the pepsin fragments from digestion of an IgG1, as obtained from a typical H/DX MS experiment. Mass spectra of the peptide ions at elution time ~4.5 minutes are shown in Figure 5B. A zoomed in trace of Figure 5B is shown in Figure 5C, illustrating the m/z region from approximately 1030 to 1060.
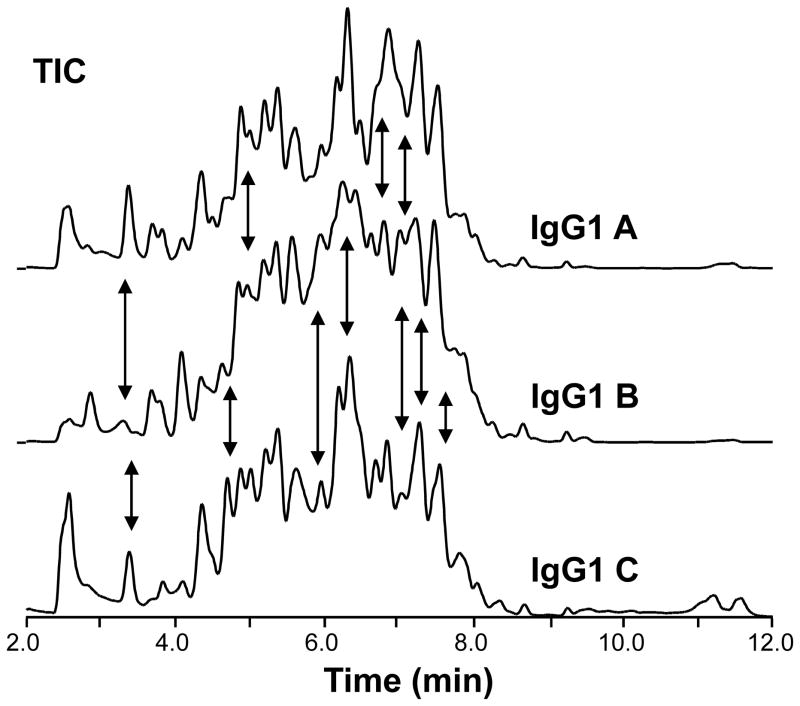
Figure 4.
Total ion chromatograms of the peptic digests of three different IgG1s. Separation was performed at 0 °C on a Waters UPLC system designed for hydrogen exchange (24). The three IgG1s share >97% amino acid sequence similarity. The black arrows indicate differences in the chromatographic profiles.
Figure 5.
Representative data from a hydrogen exchange run. (A) Total ion chromatogram of the peptic peptides from the pepsin digestion of an IgG1. (B) The mass spectrum under the black bar at ~4.5 mins shown panel A. (C) A zoom in of the mass spectrum in panel B, showing the m/z range from 1030 to 1060.
3.8 Data Processing
A labor intensive component of H/DX MS is data processing. While there are currently various software programs (31–36) and specialized applications (23) available that semiautomate the processing steps and help to accelerate data processing, some of the analysis still relies on manual processing and intervention, at least at this time. When analyzing the deuterium levels of peptides generated from proteins as large as antibodies, there are a lot of peptides. Maintaining high chromatographic resolution for all these peptides is challenging under the constraints of the quench conditions. Overlapping peptides can confuse some automatic processing algorithms and ions of different intensities may require manual processing.
Processing peptide level exchange data involves identifying each pepsin peptide, extracting the raw chromatographic profile for each peptide, determining the centroid mass for each peptide at each deuterium labeling time point, and determining the deuterium incorporation per labeling time. In the example shown here, all peptides in an undeuterated control sample were identified using CID-based tandem mass spectrometry (see Notes 17–18). In our experience, an unambiguous peptide identification requires mass accuracy of <3 ppm on the accurate mass measurement of the precursor ion and identification of 4 product ions for peptides under 12 residues in length and at least 6 product ions for peptides over 12 residues in length. We do not trust peptide maps and conclusions derived from maps when the MS quality is poor (i.e., unit mass resolution, accuracy of >10 ppm). In addition, the same peptide identification must be made in two out of three replicate experiments. It is for this reason that we perform at least three replicates of the undeuterated control sample.
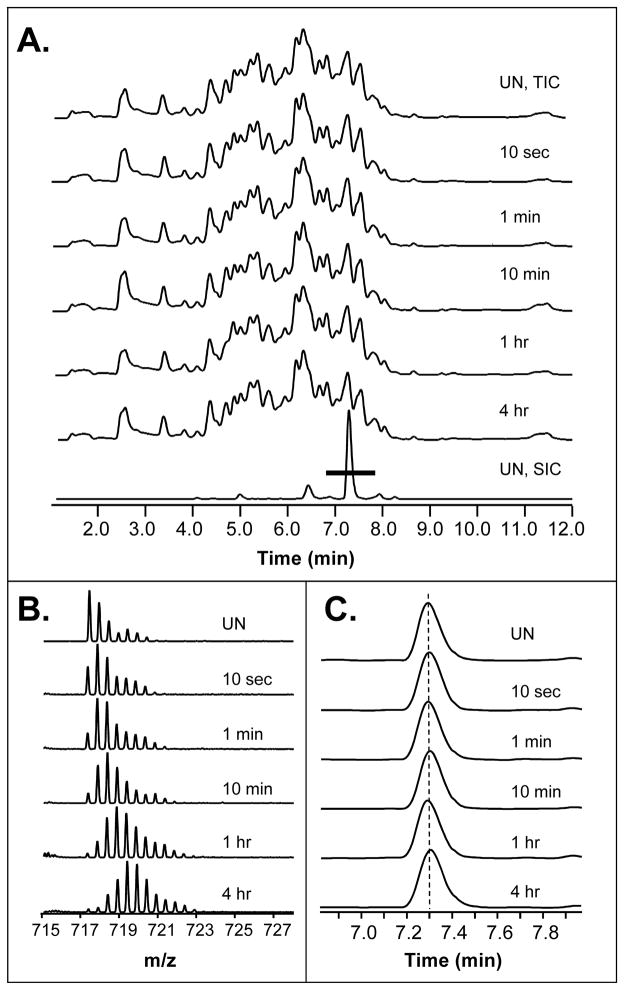
During peptide identification, the retention time of each peptide is recorded either automatically through the software or manually. Since incubation with deuterium changes the peptide mass, knowing the retention time is a critical parameter that helps locate each peptide in the digestions of deuterated samples. Deuterium incorporation does not change chromatographic retention time for IgG1 peptides (or peptides from any other proteins we have worked with). Figure 6 shows the total ion chromatograms for the IgG1 undeuterated control sample and five exchange time points. The reproducibility of the chromatograms is again typical of what is seen using the setup described (see also Figures 4, 5A). As an example, the +2 charge state of the peptide representing residues 242–253 from the heavy chain of the IgG1 is shown in Figure 6B. The selected ion chromatogram of the two most intense peaks in the isotope distributions for the peptide shown in Figure 6B are shown in Figure 6C and indicate that there is no change to retention time as a result of deuterium incorporation.
Figure 6.
Deuterium incorporation does not change the retention time of peptides. (A) UPLC separations of peptides from an IgG1 digestion are shown, with the total ion chromatogram for the unlabeled sample on top and the total ion chromatograms (TICs) for five deuterium exchange time points just below the undeuterated sample. The bottom trace in panel A is the selected ion chromatogram (SIC) for the +2 charge state (m/z = 717.40) of the IgG1 peptide that covers heavy chain residues 242–253. The mass spectra for each exchange time point for this ion are shown in (B). The two most intense peaks of the isotope distributions for this ion, in each sample, were used to generate the selected ion chromatograms shown in (C). The elution time of this ion does not change with increasing deuterated (dotted line). The black bar at ~7.0 to 8.0 minutes on the bottom trace of panel A indicates the retention time window that is shown in panel C.
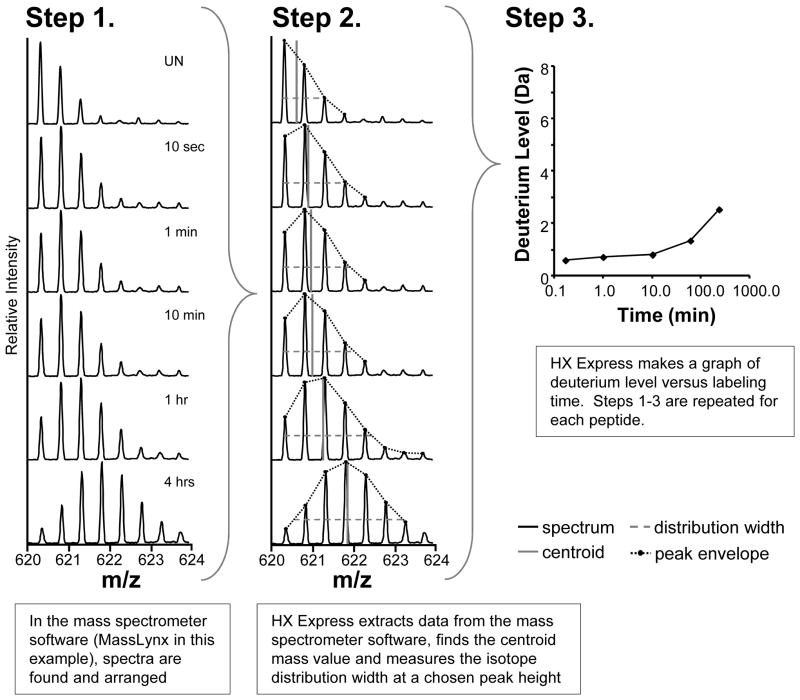
Since each deuterium incorporation time point is a separate chromatographic trace, data for each peptide must be extracted from each trace to generate a deuterium incorporation curve. Knowing the retention time of each peptide ion makes it easier to search through the chromatograms and extract the necessary data; many automated H/DX processing applications rely on this property. For each peptide, we generally select a representative ion (typically a +1 through +4 charge state) to follow for each peptide. Sometimes nearby ions dictate which charge state to select, and often we will process two or more charge states for the same peptide. The mass spectrometer processing software, in our case Waters MassLynx, is used to visualize and extract the data for each ion (Figure 7). For each peptide ion, all deuterium incorporation time points are shown in order of increasing deuterium exposure (top to bottom), see Figure 7 Step 1. The Excel application HX Express (23) is used to extracted the spectral list (x,y data where x is m/z and y is intensity) for each ion at each exchange time point. Other software packages (31–36) can also be used for this purpose, but HX Express was designed to interface with Waters MassLynx (see Note 6). The HX Express settings, which include charge state and centroid distribution width, have been previously described (23); shown below is what was used for IgG1 analysis.
Figure 7.
Processing peptide level hydrogen exchange data. Step 1. Mass spectra from a single peptide ion charge state are found and displayed using the MS instrument software (e.g., MassLynx). The spectra are arranged vertically with increasing deuterium exposure time going from top to bottom. Step 2. Peptide specific processing parameters are entered into HX Express. HX Express determines the center of mass of each distribution. Step 3. The deuterium incorporation graph for the peptide is made, based on the values from Step 2.
The HX Express settings were input: charge state for each ion and centroid distribution width of 30% peak height.
Check the box labeled, “Use isotopic peak detection”. This will enable the macro to detect and identify the individual isotopic peaks related to each peptide ion.
Peak tolerances can be left at HX Express default settings.
The Output tab can be used to change the data reporting format as desired.
Once all preferred settings are in place, select OK and run the application.
HX Express determines the centroid mass of every peptide for each deuterium time point (Figure 7 Step 2), based on the set distribution width, step 1 above.
The centroid mass at each deuterium time point is then plotted versus deuterium labeling time (on a log scale) (Figure 7 Step 3).
This process is repeated for each peptide and sometimes for all peptide charge states that are observed. Again, software can automate this part of the experiment. We always manually inspect the processing to ensure quality.
3.9 Data Interpretation
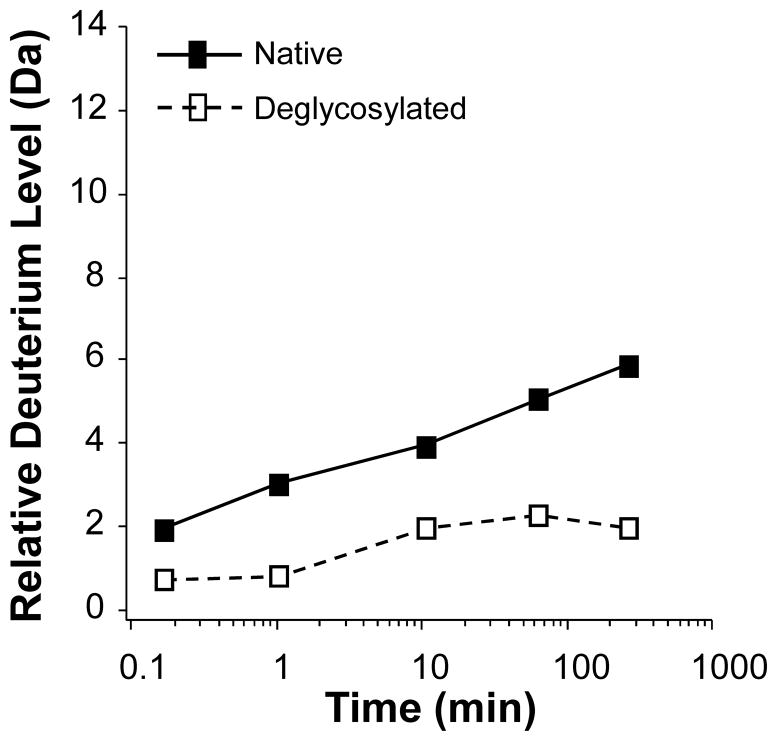
Deuterium content in each peptide can then be compared for another species of the same protein, (i.e., an IgG1 with and without carbohydrates). Recall that all the information about protein conformation of the fully-active and folded molecule was captured in the deuterium pattern found in each peptide. The main feature monitored in a comparison study is the location of where differences in deuterium up-take occur and at what rate. Some peptides will have the same amount of deuterium in normal and modified forms of the protein, while others will have more or less deuterium upon modification. Figure 8 shows the effect of deuterium incorporation on IgG1 heavy chain residues 279–294 as a result of deglycosylation. Such results provide information concerning changes to the conformation as a result of a modification (i.e., deglycosylation, oxidation, deamidation, etc.). In this example, deglycosylation of the IgG1 resulted in a decrease to the amount of deuterium that was incorporated into residues 279–294. The meaning of this can then be deciphered in light of the structure of the protein, the location of the deglycosylation relative the region that was affected, etc., can be determined.
Figure 8.
Hydrogen exchange data for IgG1 heavy chain residues 279–294. See Note 18.
Acknowledgments
We would like to thank Dr. Steven A. Berkowitz for his advice and encouragement, Dr. Rohin Mhatre, Dr. Helena Madden and Dr. Geoff Gerhardt for their support of H/DX MS, and Dr. Thomas E. Wales, Dr. Keith Fadgen, Dr. Martha Stapels, and Dr. Michael Eggertson for their technical assistance. This work was supported in part by funding from the NIH (GM-086507) and a research collaboration with Waters Corporation. This is contribution 974 from the Barnett Institute.
Footnotes
If the protein sample concentration is below 3 mg/mL, use a centrifugal MWCO filter to concentrate the sample. Be sure to prewet and wash the membrane with at least 2 volumes of protein buffer before concentrating the protein.
There are several commercial suppliers of deuterated solvents. In our experience Cambridge Isotope Laboratories delivers the purest and most consistent product and is what we recommend.
The experimental procedure will be demonstrated using PBS buffer (50 mM sodium phosphate, 100 mM sodium chloride, pH 6.00). Any buffer that is free from high concentrations of detergents, which are not MS friendly in later steps of the protocol, will work. We have had success with HEPES, TRIS, histidine, arginine, succinate, and citrate buffer systems.
The pH of all solutions was determined with a hydrogen glass electrode that is designed for reporting H+ -ion concentrations (pH). Since the average lab does not have a deuterium electrode, the concentration of D+ -ion (pD) in the labeling solution was determined with the correction equation pD = pH* + 0.40 where pH* is the reading obtained with a hydrogen electrode (37).
The strength of the quench buffer is critical. The quench buffer must be able to reduce the pH of the solution from the labeling pH (usually around 6.00–8.30) to the quench pH (2.50–2.60) reliably and very reproducibly. We recommend buffers for this practice as they are more reproducible. Some experiments have been performed where concentrated acid is used for the quench step, but this not as reliable (in terms of pH) a method for quenching as is a quench buffer. The rate of backbone amide hydrogen exchange is at a minimum at pH 2.5–2.6 (11). The effectiveness of lowering the pH of the quench buffer should be tested by diluting the quench buffer 1:1 with deuterated labeling buffer. The resultant pH should read between 2.5 and 2.6, adjust accordingly if the criteria are not met. Quench buffer pH may need to be varied as much as ± 0.3 pH units depending on the buffer strength and pH of the labeling and sample buffers. These pH tests can be made in solutions of the buffer that do not contain protein.
The specific instrumentation discussed [i.e., Waters nanoACQUITY UPLC as described first in Ref. (24) and now fully commercialized] is not required, but is recommended due to the superior performance of UPLC separation, the integrated cooling chamber for temperature control, the ease of peptic peptide identification using MSE and the integration of Waters data analysis software (MassLynx) with tools designed for processing H/DX MS data.
For optimal peptide retention and separation, the column and trap should consist of the same stationary phase.
Other denaturants could be used such as urea or guanidine isothiocynate but guanidine hydrochloride has proven to be very effective. Other reducing agents could be also used, such as dithiothreitol (DTT); however, TCEP is a more effective reducing agent at low pH. It should be noted that TCEP is not stable in phosphate buffers for more than 24 hours and should be prepared fresh before the start of a labeling experiment.
TCEP gives a very strong molecular ion peak at ~251 m/z, thus the low m/z in the acquisition m/z range is 255 m/z in both the precursor (survey) and product ion experiments.
During pepsin digestion, if the pressure of the digestion column rises over 1100 psi during the non-injection phase of the analysis, it is likely that pepsin column may be getting clogged. The pepsin column can be cleaned with 1% formic acid and no more than 5% acetonitrile. If this does not resolve the issue a new pepsin column may be required. The life of an individual pepsin column will vary. In our experience, a column should last for more than 600 injections; however, this will depend on how the column was cared for and what samples the column was exposed to. Never expose the pepsin column to pH above 5.0 as pepsin will be irreversibly denatured and the column will be ruined. We typically perform the digestion at 10 °C, which in the Waters HDX system is facilitated by a small column heater inside the cooled chamber.
Other mass calibrants can be used. We prefer to calibrate on the MS/MS fragments of GFP. GFP theoretical fragment ion list:
| Fragment ion | m/z |
|---|---|
| 1 | 72.0813 |
| 2 | 120.0813 |
| 3 | 175.1195 |
| 4 | 187.0719 |
| 5 | 246.1566 |
| 6 | 333.1886 |
| 7 | 480.2570 |
| 8 | 627.3254 |
| 9 | 684.3469 |
| 10 | 813.3895 |
| 11 | 942.4321 |
| 12 | 1056.4750 |
| 13 | 1171.5020 |
| 14 | 1285.5448 |
Many proteins, including some antibodies, can be sensitive to multiple freeze thaw cycles. Avoid multiple freeze thaw cycles if the stability of the antibody is not known. We prefer to prepare samples and immediately analyze them without a freeze-thaw cycle.
Depending upon the set up of the sample loop, there may be a dead volume of approximately 10 μL before the sample loop. If needed, ensure that the sample loop is full by injecting a sample volume equal to the size of the sample loop + 10 μL.
Avoid large final volumes of quenched protein if possible. If samples have been frozen, thawing large volumes (i.e., >100 μL) may take too long and will result in inconsistency and more experimental variability.
Pepsin is a nonspecific enzyme; however, given the same experimental conditions pepsin digestion is reproducible. Because of pepsin’s lack of specificity, predicting what peptides will be produced based solely on the amino acid sequence of a protein is not possible. All peptides produced during digestion must be identified, see Note 17.
Chromatography in H/DX MS is typically performed in less than 10 minutes. The chromatographic gradient should be optimized for each protein. The gradient shown in section 3.7.3 is a good representative gradient and is sufficient for differentiating the peptides of an IgG1. Figure 4 shows an overlay of representative TICs from three different IgG1 antibodies with > 97% amino acid sequence similarity. Chromatographic carryover can become an issue in these experiments (38). To avoid misinterpretation of hydrogen exchange data, blank injections or wash methods may be required before each sample injection to ensure that all columns and lines are clean and free of material from prior injections.
All peptides in our work are identified using a combination of exact mass (<3 ppm accuracy) and Waters MSE technology. MSE is CID (collision-induced dissociation) fragmentation that works by alternating the energy in the collision cell between a low (~6V) to a high (~30V) energy (alternating every 0.25 seconds) (39). All ions in the cell at the time the high energy cycle starts are fragmented and then algorithms and software are used to determine which product ions go with which precursor ions. The average peak width for each peptide identified was approximately 6 seconds wide, which results in about 12 MS and 12 MS/MS points per peptide peak. MSE is, in our experience, ideal for identifying peptic peptides in H/DX MS experiments. Because all of the ions can be identified under the identical separation conditions that were used for the analysis of deuterium incorporation, there is no need for data-dependent switching and precursor ion selection. The Waters PLGS software used to interpret peptide fragmentation has been optimized for the analysis of non-specific pepsin digestion. However, we always visually inspect all MS/MS spectra to verify the quality of the fragmentation and validity of each peptide assignment.
The error of each data point should be determined with replicate analyses. In our experience, the greatest source of error in determination of the deuterium level comes from inconsistencies in the pH of labeling and quenching. The overall error in a well controlled experiment is on the order of ±0.5 Da per data point, but this can partially depend on the experimental conditions. At least 3 replicates of an experiment should be performed to determine this error and to allow addition of error bars or tolerance values to each deuterium incorporation graph. See also Ref. (40).
References
- 1.Chan AC, Carter PJ. Therapeutic antibodies for autoimmunity and inflammation. Nat Rev Immunol. 2010;10:301–316. doi: 10.1038/nri2761. [DOI] [PubMed] [Google Scholar]
- 2.Reichert JM, Valge-Archer VE. Development trends for monoclonal antibody cancer therapeutics. Nat Rev Drug Discov. 2007;6:349–356. doi: 10.1038/nrd2241. [DOI] [PubMed] [Google Scholar]
- 3.Weiner LM, Surana R, Wang S. Monoclonal antibodies: versatile platforms for cancer immunotherapy. Nat Rev Immunol. 2010;10:317–327. doi: 10.1038/nri2744. [DOI] [PMC free article] [PubMed] [Google Scholar]
- 4.Brekke OH, Sandlie I. Therapeutic antibodies for human diseases at the dawn of the twenty-first century. Nat Rev Drug Discov. 2003;2:52–62. doi: 10.1038/nrd984. [DOI] [PubMed] [Google Scholar]
- 5.Walsh G. Biopharmaceutical benchmarks 2010. Nat Biotechnol. 2010;28:917–924. doi: 10.1038/nbt0910-917. [DOI] [PubMed] [Google Scholar]
- 6.Leavy O. Therapeutic antibodies: past, present and future. Nat Rev Immunol. 2010;10:297. doi: 10.1038/nri2763. [DOI] [PubMed] [Google Scholar]
- 7.Davies DR, Padlan EA, Segal DM. Three-Dimensional Structure of Immunoglobulins. Annu Rev Biochem. 1975;44:639–667. doi: 10.1146/annurev.bi.44.070175.003231. [DOI] [PubMed] [Google Scholar]
- 8.Saphire EO, Parren PW, Pantophlet R, Zwick MB, Morris GM, Rudd PM, Dwek RA, Stanfield RL, Burton DR, Wilson IA. Crystal structure of a neutralizing human IGG against HIV-1: a template for vaccine design. Science. 2001;293:1155–1159. doi: 10.1126/science.1061692. [DOI] [PubMed] [Google Scholar]
- 9.Houde D, Arndt J, Domeier W, Berkowitz S, Engen JR. Characterization of IgG1 conformation and conformational dynamics by hydrogen/deuterium exchange mass spectrometry. Anal Chem. 2009;81:2644–2651. doi: 10.1021/ac802575y. [DOI] [PMC free article] [PubMed] [Google Scholar]
- 10.Houde D, Peng Y, Berkowitz SA, Engen JR. Post-translational modifications differentially affect IgG1 conformation and receptor binding. Mol Cell Proteomics. 2010;9:1716–1728. doi: 10.1074/mcp.M900540-MCP200. [DOI] [PMC free article] [PubMed] [Google Scholar]
- 11.Englander SW, Kallenbach NR. Hydrogen exchange and structural dynamics of proteins and nucleic acids. Q Rev Biophys. 1983;16:134. doi: 10.1017/s0033583500005217. [DOI] [PubMed] [Google Scholar]
- 12.Smith DL, Deng Y, Zhang Z. Probing the Non-covalent Structure of Proteins by Amide Hydrogen Exchange and Mass Spectrometry. J Mass Spectrom. 1997;32:135–146. doi: 10.1002/(SICI)1096-9888(199702)32:2<135::AID-JMS486>3.0.CO;2-M. [DOI] [PubMed] [Google Scholar]
- 13.Wales TE, Engen JR. Hydrogen exchange mass spectrometry for the analysis of protein dynamics. Mass Spectrom Rev. 2006;25:158–170. doi: 10.1002/mas.20064. [DOI] [PubMed] [Google Scholar]
- 14.Hoofnagle AN, Resing KA, Ahn NG. Protein analysis by hydrogen exchange mass spectrometry. Annu Rev Biophys Biomol Struct. 2003;32:1–25. doi: 10.1146/annurev.biophys.32.110601.142417. [DOI] [PubMed] [Google Scholar]
- 15.Brier S, Engen JR. Hydrogen exchange mass spectrometry: Principles and capabilities. In: Chance M, editor. Mass spectrometry analysis for protein-protein interactions and dynamics. Wiley-Blackwell; New York: 2008. pp. 11–43. [Google Scholar]
- 16.Engen JR. Analysis of protein conformation and dynamics by hydrogen/deuterium exchange MS. Anal Chem. 2009;81:7870–7875. doi: 10.1021/ac901154s. [DOI] [PMC free article] [PubMed] [Google Scholar]
- 17.Maier CS, Deinzer ML, Burlingame AL. Methods Enzymol. Academic Press; 2005. Protein Conformations, Interactions, and H/D Exchange; pp. 312–360. [DOI] [PubMed] [Google Scholar]
- 18.Yan X, Maier CS. Hydrogen/deuterium exchange mass spectrometry. Methods Mol Biol. 2009;492:255–271. doi: 10.1007/978-1-59745-493-3_15. [DOI] [PubMed] [Google Scholar]
- 19.Konermann L, Tong X, Pan Y. Protein structure and dynamics studied by mass spectrometry: H/D exchange, hydroxyl radical labeling, and related approaches. J Mass Spectrom. 2008;43:1021–1036. doi: 10.1002/jms.1435. [DOI] [PubMed] [Google Scholar]
- 20.Morgan CR, Engen JR. Investigating solution-phase protein structure and dynamics by hydrogen exchange mass spectrometry. In: Coligan John E, et al., editors. Current protocols in protein science. Unit 17 16. Chapter 17. 2009. pp. 11–17. [DOI] [PMC free article] [PubMed] [Google Scholar]
- 21.Smith DL, Deng Y, Zhang Z. Probing the non-covalent structure of proteins by amide hydrogen exchange and mass spectrometry. J Mass Spectrom. 1997;32:135–146. doi: 10.1002/(SICI)1096-9888(199702)32:2<135::AID-JMS486>3.0.CO;2-M. [DOI] [PubMed] [Google Scholar]
- 22.Zhang Z, Smith DL. Determination of amide hydrogen exchange by mass spectrometry: a new tool for protein structure elucidation. Protein Sci. 1993;2:522–531. doi: 10.1002/pro.5560020404. [DOI] [PMC free article] [PubMed] [Google Scholar]
- 23.Weis DD, Engen JR, Kass IJ. Semi-automated data processing of hydrogen exchange mass spectra using HX-Express. J Am Soc Mass Spectrom. 2006;17:1700–1703. doi: 10.1016/j.jasms.2006.07.025. [DOI] [PubMed] [Google Scholar]
- 24.Wales TE, Fadgen KE, Gerhardt GC, Engen JR. High-speed and high-resolution UPLC separation at zero degrees Celsius. Anal Chem. 2008;80:6815–6820. doi: 10.1021/ac8008862. [DOI] [PMC free article] [PubMed] [Google Scholar]
- 25.Wu Y, Engen JR, Hobbins WB. Ultra performance liquid chromatography (UPLC) further improves hydrogen/deuterium exchange mass spectrometry. J Am Soc Mass Spectrom. 2006;17:163–167. doi: 10.1016/j.jasms.2005.10.009. [DOI] [PubMed] [Google Scholar]
- 26.Woods VL, Jr, Hamuro Y. High resolution, high-throughput amide deuterium exchange-mass spectrometry (DXMS) determination of protein binding site structure and dynamics: utility in pharmaceutical design. J Cell Biochem Suppl Suppl. 2001;37:89–98. doi: 10.1002/jcb.10069. [DOI] [PubMed] [Google Scholar]
- 27.Wang L, Pan H, Smith DL. Hydrogen exchange-mass spectrometry: optimization of digestion conditions. Mol Cell Proteomics. 2002;1:132–138. doi: 10.1074/mcp.m100009-mcp200. [DOI] [PubMed] [Google Scholar]
- 28.Gill SC, von Hippel PH. Calculation of protein extinction coefficients from amino acid sequence data. Anal Biochem. 1989;182:319–326. doi: 10.1016/0003-2697(89)90602-7. [DOI] [PubMed] [Google Scholar]
- 29.Pace CN, Vajdos F, Fee L, Grimsley G, Gray T. How to measure and predict the molar absorption coefficient of a protein. Protein Sci. 1995;4:2411–2423. doi: 10.1002/pro.5560041120. [DOI] [PMC free article] [PubMed] [Google Scholar]
- 30.Noble JE, Bailey MJ. Quantitation of protein. Methods Enzymol. 2009;463:73–95. doi: 10.1016/S0076-6879(09)63008-1. [DOI] [PubMed] [Google Scholar]
- 31.Pascal B, Chalmers M, Busby S, Mader C, Southern M, Tsinoremas N, Griffin P. The Deuterator: software for the determination of backbone amide deuterium levels from H/D exchange MS data. BMC Bioinformatics. 2007;8:156. doi: 10.1186/1471-2105-8-156. [DOI] [PMC free article] [PubMed] [Google Scholar]
- 32.Pascal BD, Chalmers MJ, Busby SA, Griffin PR. HD Desktop: An Integrated Platform for the Analysis and Visualization of H/D Exchange Data. J Am Soc Mass Spectom. 2009;20:601–610. doi: 10.1016/j.jasms.2008.11.019. [DOI] [PMC free article] [PubMed] [Google Scholar]
- 33.Slysz G, Baker C, Bozsa B, Dang A, Percy A, Bennett M, Schriemer D. Hydra: software for tailored processing of H/D exchange data from MS or tandem MS analyses. BMC Bioinformatics. 2009;10:162. doi: 10.1186/1471-2105-10-162. [DOI] [PMC free article] [PubMed] [Google Scholar]
- 34.Hotchko M, Anand G, Komives E, Ten Eyck L. Automated extraction of backbone deuteration levels from amide H/(2) H mass spectrometry experiments. Protein Sci. 2006;15:583–601. doi: 10.1110/ps.051774906. [DOI] [PMC free article] [PubMed] [Google Scholar]
- 35.Nikamanon P, Pun E, Chou W, Koter M, Gershon P. “TOF2H”: A precision toolbox for rapid, high density/high coverage hydrogen-deuterium exchange mass spectrometry via an LC-MALDI approach, covering the data pipeline from spectral acquisition to HDX rate analysis. BMC Bioinformatics. 2008;9:387. doi: 10.1186/1471-2105-9-387. [DOI] [PMC free article] [PubMed] [Google Scholar]
- 36.Lou X, Kirchner M, Renard BY, Kothe U, Boppel S, Graf C, Lee CT, Steen JA, Steen H, Mayer MP, Hamprecht FA. Deuteration distribution estimation with improved sequence coverage for HX/MS experiments. Bioinformatics. 2010;26:1535–1541. doi: 10.1093/bioinformatics/btq165. [DOI] [PubMed] [Google Scholar]
- 37.Glasoe P, Long F. Use of glass electrodes to measure acidities in deuterium oxide. J Phys Chem. 1960;64:188–193. [Google Scholar]
- 38.Fang J, Rand KD, Beuning PJ, Engen JR. False EX1 signatures caused by sample carryover during HX MS analyses. Int J Mass Spectrom. 2010 doi: 10.1016/j.ijms.2010.1006.1039. In Press. [DOI] [PMC free article] [PubMed] [Google Scholar]
- 39.Silva JC, Gorenstein MV, Li G-Z, Vissers JPC, Geromanos SJ. Absolute Quantification of Proteins by LCMSE: A Virtue of Parallel ms Acquisition. Mol Cell Proteomics. 2006;5:144–156. doi: 10.1074/mcp.M500230-MCP200. [DOI] [PubMed] [Google Scholar]
- 40.Houde D, Berkowitz SA, Engen JR. The utility of Hydrogen/Deuterium exchange mass spectrometry in biopharmaceutical comparibility studies. J Pharm Sci. 2010 doi: 10.1002/jps.22432. [DOI] [PMC free article] [PubMed] [Google Scholar]


