

Abstract
Objective
Examining covariate balance is the prescribed method for determining when propensity score methods are successful at reducing bias. This study assessed the performance of various balance measures, including a proposed balance measure based on the prognostic score (also known as the disease-risk score), to determine which balance measures best correlate with bias in the treatment effect estimate.
Study Design and Setting
The correlations of multiple common balance measures with bias in the treatment effect estimate produced by weighting by the odds, subclassification on the propensity score, and full matching on the propensity score were calculated. Simulated data were used, based on realistic data settings. Settings included both continuous and binary covariates and continuous covariates only.
Results
The standardized mean difference in prognostic scores, the mean standardized mean difference, and the mean t-statistic all had high correlations with bias in the effect estimate. Overall, prognostic scores displayed the highest correlations of all the balance measures considered. Prognostic score measure performance was generally not affected by model misspecification and performed well under a variety of scenarios.
Conclusion
Researchers should consider using prognostic score–based balance measures for assessing the performance of propensity score methods for reducing bias in non-experimental studies.
Keywords: Causal inference, Confounding, Disease risk score, Matching methods, Non-experimental study, Propensity Score Diagnostics
Introduction
The primary challenge facing non-experimental studies is a lack of comparability of units in the various treatment conditions. Consequently, differences in outcomes may be due either to the treatments under consideration or to pre-existing differences. Propensity score methods, a key tool of comparative effectiveness research (CER), help address this problem by ensuring that the groups being compared are as similar as possible on observed characteristics. Moreover, propensity score methods often yield more reliable estimates of treatment effects than traditional methods, such as regression adjustment [1].
Current guidelines advocate examining balance on baseline characteristics – how similar the treatment groups are to one another – to gauge the performance of a propensity score approach [2]. The theory underlying propensity scores implies that under certain distributional settings and outcome models, better balance will yield less bias in treatment effect estimates. However, in practice, there are two challenges to this theory. First, better covariate balance (at least by some measures) does not always yield less biased effect estimates [3]. Second, given the variety of balance measures available, assessing balance is not straightforward, either in terms of the measures for each covariate or in how to summarize across covariates. We also stress that of course a limitation of balance measures is that they cannot assess balance on unobserved confounders, and thus cannot help diagnose potential bias due to unobserved confounders.
In this paper we propose a simple new balance measure based on disease risk scores, also known as “prognostic scores” [4,5]. Fundamentally, this new balance measure attempts to ensure that the groups being compared are similar on their baseline risk for the outcome (their “prognosis”). Prognostic scores are estimated by modeling the outcome as a function of observed covariates in one of the treatment groups (usually the “control” or less active treatment condition). Predicted outcomes under that condition are then obtained for everyone in the sample and become the “prognostic scores.” In this study, we use the standardized difference in mean prognostic scores between treatment groups as a measure of balance.
The incorporation of prognostic scores or related concepts in propensity score diagnostics has been proposed previously [6]. Patrick et al. [7] suggest using information on the strength of the covariate-outcome relationship to inform variable selection in propensity score methods, and the high dimensional propensity score method of Schneeweiss et al. [8] uses a similar strategy. Prognostic scores, or related ideas, have also been used in matching [5,9,10]. However, the use of prognostic scores as balance measures has not been investigated empirically.
This paper presents two simulation studies investigating the correlation of various balance measures with bias in the treatment effect estimate. For simplicity we adopt the common terms “treatment” and “control” to refer to the two groups being compared but recognize that in many CER studies these will be two active treatments under comparison.
Methods
Propensity Scores
The propensity score is defined as the probability of receiving treatment, given the observed covariates [11]. The properties of the propensity score enable the formation of groups similar to one another on all observed covariates that went into the propensity score, by matching, subclassifying, or weighting using the propensity score [2]. Although propensity scores are often estimated using logistic regression, the diagnostics are not standard model diagnostics [12,13]. The key diagnostic for propensity score methods is the resulting similarity (balance) of the covariate distributions between the treatment and control groups.
In the spirit of separating the design and analysis stages of a study, traditional propensity score methods are conducted without use of the outcome variable. The rationale behind this separation is that a given study design or analysis will not be selected simply because it yields the desired result. This separation also means that one propensity score procedure can be used for multiple outcomes, just as one randomized clinical trial can be used to examine multiple outcomes. However, a consequence of ignoring outcome information during propensity score estimation and use is that propensity scores prioritize variables by their importance in predicting treatment received, not outcome. As a result, variables that are strongly related to treatment assignment but unrelated to outcome, such as an instrumental variable, may have undue influence in the propensity score, which can lead to decreased precision and increased bias [13,14].
Existing Balance Measures
Various balance measures have been proposed, with their use tied to the propensity score approach [15–17]. For example, when weighting is used, balance measures should be calculated using propensity score weights. The most common metric is the standardized bias or standardized mean difference (SMD). Similar to the effect size, the SMD is calculated as the difference in means of a covariate across the treatment groups, divided by the standard deviation in the treated group. Guidelines indicate that 0.1 or 0.25 represent reasonable cut-offs for acceptable standardized biases; larger standardized biases indicate that groups are too different from one another for reliable comparison [15]. Other common balance measures include Kolmogorov-Smirnov test statistics and t-statistics, although caution is urged when using measures that conflate sample size and balance, such as hypothesis tests [16].
Prognostic Scores
The prognostic score, formalized by Hansen [5], is defined as the predicted outcome under the control condition, reflecting baseline “risk.” It is estimated by fitting a model of the outcome in the control group and then using that model to obtain predictions of the outcome under the control condition for all individuals. The prognostic score generalizes and extends the unexposed-only disease risk score to continuous, categorical, and ordinal outcomes [4]. In the case of a binary outcome, the prognostic score and the unexposed-only disease risk score are equivalent.
The present study examines the (weighted) standardized bias of the prognostic score as a summary measure of balance, where the weighting is done to reflect the way the propensity scores will be applied to estimate treatment effects. In particular, we propose matching, weighting, or subclassifying on the propensity score, and then using the prognostic score to help assess how well a given approach worked. The benefit of the prognostic score as a balance measure is that it reflects the relative importance of each covariate in predicting the outcome: balance on the prognostic score should indicate balance on the variables highly predictive of the outcome. The variables most predictive of the outcome are likely those of most concern, as such variables could cause the most bias if left unbalanced.
Simulation Studies
We performed two simulation studies to examine the correlation of various balance measures and bias in the estimated treatment effect. To help convey the intuition for why traditional balance measures may be misleading, we first considered a simulation study with two normally distributed covariates. In the “aligned” setting, the covariate that is highly predictive of treatment assignment is also strongly related to the outcome. In the “misaligned” setting, the covariate that is highly predictive of treatment assignment (×1) is not strongly related to the outcome, and the covariate that is strongly related to outcome (×2) is not strongly associated with treatment assignment. We examine the correlation of four balance measures with bias in the treatment effect estimate, estimated using weighting by the odds (details below): 1) the average absolute SMD (ASMD); 2) the average Kolmogorov-Smirnov (KS) test statistic; 3) the SMD of the propensity score; and 4) the SMD of the prognostic score.
The larger simulation setting used both continuous and binary covariates and continuous covariates only. This larger simulation study considered three propensity score approaches: weighting by the odds, subclassification with five subclasses, and full matching. In weighting by the odds, treated subjects receive a weight of 1 while control subjects receive a weight defined by the propensity score divided by one minus the propensity score; this serves to weight both groups to represent the treatment group. Full matching forms a large number of subclasses, each containing at least one treatment and at least one control subject; weights are then calculated within each subclass to again weight the controls to resemble the treatment group. See [2] for more detailed descriptions of each method. All methods estimated the Average Treatment Effect on the Treated (ATT), although the simulations assumed a constant effect so the Average Treatment Effect (ATE) is numerically the same as the ATT. The weights generated by each of these three procedures were incorporated into the balance measure calculations. All matching procedures were conducted using R 2.14.1; subclassification and full matching were implemented using the MatchIt and optmatch packages, respectively [18,19].
The structure of the larger simulation study was adapted from Austin [6] and Belitser et al. [20]. We considered a binary treatment and multiple continuous outcomes (A–D) with varying degrees of linearity and non-additivity in the outcome model: Outcome model A consisted of six main effects terms; outcome model B consisted of the same six main effects terms and four interaction terms; outcome model C consisted of the six main effects terms plus two squared terms; and outcome model D contained the six main effects terms, the four interaction terms, and the two squared terms. Outcomes were generated subject to a constant treatment effect of 3.0, expressed as a difference in means. The first setting utilized nine independent continuous standard normal covariates, including four confounders, two predictors of treatment assignment only, two predictors of outcome only, and one covariate related to neither treatment nor outcome. In the second setting, four of the nine covariates were generated as independent Bernoulli variables with probability 0.5 for each subject. The data structure was otherwise unchanged from that of the first setting. Cohort studies of sizes n=500, 1000, and 2000 were examined; as the results were consistent across the three cohort sizes, we present here only the results for n=1000. Two thousand datasets of each study size were generated. Full details of the simulation setups can be found in the online eAppendix.
The reported balance-bias correlations for each setting and for a particular propensity score method were calculated as follows. Following Belitser et al. [20], 40 propensity score models that varied in the degree of model misspecification were fitted for each dataset. This was done to generate samples with varying levels of covariate balance. These estimated propensity scores were then used to generate 40 sets of weights according the propensity score method under examination. Using these weights, 40 values of each balance measure and 40 estimates of the treatment effect were estimated. Effect estimates were calculated using the R survey package [21]. The Pearson correlation between each balance measure and the absolute bias of the estimated treatment effect was calculated for each dataset, with the reported correlation for each balance measure corresponding to the mean of these correlations across the 2000 generated datasets.
We examined the following balance measures: the mean, median, and maximum standardized mean difference (SMD); the number of SMDs below two thresholds (.1 and .25); the mean Kolmogorov-Smirnov and t-test statistics; the SMD in propensity scores; and the SMD in the prognostic scores. In order to examine the impact of prognostic score model misspecification, in each setting we considered seven possible specifications of the prognostic score model. We report results from a main effects model containing all nine covariates (Prognostic Score 1); a model corresponding to the true outcome model A, consisting of main effects for each of the six covariates related to outcome (Prognostic Score 2); models consisting of main effects for five of the six covariates related to the outcome but omitting a confounder related more strongly to treatment than outcome (Prognostic Score 3); a weak confounder (Prognostic Score 4); a covariate related to outcome only (Prognostic Score 5); and the strongest confounder (Prognostic Score 6). We also report results from a model including all six covariates related to the outcome in addition to a covariate strongly related to treatment only (Prognostic Score 7). These represent method performance when other covariates related to the outcome are excluded or when additional covariates unrelated to the outcome are included.
Results
Simple Simulation with Two Covariates
Figure 1 illustrates some of the challenges presented by traditional balance measures, as seen in the simple simulation setting. When the covariates are aligned, all balance measures have high correlations with bias. However, this is not the case in the “misaligned” setting. The propensity score shows poor correlation with bias, because ×1 has a higher association with treatment and in some sense thus receives more “weight” in the propensity score model. However, ×2 is more related to the outcome than ×1, and thus a small imbalance on ×2 yields more bias in the effect estimate. Thus, the propensity score balance measure is primarily showing balance on ×1, but ×2 is the variable that, when imbalanced, will lead to greater bias. Unlike the propensity score, the prognostic score incorporates this information and consequently better captures the relevant imbalance. As the ASMD and KS measures weight the two variables equally, their performance lies between that of the propensity score and prognostic score-based measures.
Figure 1. Simple simulation with two covariates.
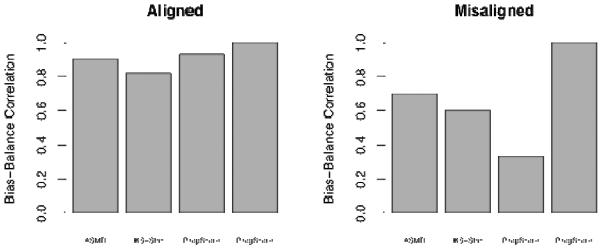
Aligned: covariate that is highly predictive of treatment assignment is also strongly related to the outcome; Misaligned: covariate that is highly predictive of treatment assignment is not strongly related to the outcome; ASMD: average absolute standardized mean difference; KS-Stat: Mean Kolmogorov-Smirnov test statistic; PropScore: standardized mean difference in the propensity score; ProgScore: standardized mean difference in the prognostic score
Larger Simulation
Results from our larger simulation study with n=1000 are shown in Tables 1, 2, and 3. Of all balance measures considered in all simulation settings and propensity score methods, prognostic scores generally had the highest correlations with bias, with most correlations > 0.9. Interestingly, these strong correlations were observed in all prognostic score models except one, Prognostic Score 6, which omits the confounder most strongly associated with both treatment status and outcome. The good performance of the prognostic score measures even with unnecessary variables added in or interactions and non-linearities omitted indicate that as long as the correct variables (all variables related to the outcome) are entered into the prognostic score model, a high correlation of balance with bias is obtained. There were no meaningful changes in the relative performance of the different balance measures across the three propensity score methods examined.
Table 1.
Mean Pearson correlations between balance measure and bias for weighting by the odds, N=1000
| Absolute Bias Outcome A | Absolute Bias Outcome B | Absolute Bias Outcome C | Absolute Bias Outcome D | |||||
|---|---|---|---|---|---|---|---|---|
| Cntns | Mixed | Cntns | Mixed | Cntns | Mixed | Cntns | Mixed | |
| Mean SMD | 0.87 | 0.71 | 0.86 | 0.70 | 0.85 | 0.69 | 0.83 | 0.68 |
| Median SMD | 0.57 | 0.46 | 0.56 | 0.45 | 0.55 | 0.44 | 0.53 | 0.43 |
| Max SMD | 0.73 | 0.63 | 0.72 | 0.63 | 0.72 | 0.62 | 0.71 | 0.62 |
| %(SMD) <0.25 | 0.52 | 0.43 | 0.51 | 0.42 | 0.50 | 0.40 | 0.49 | 0.40 |
| %(SMD) <0.1 | 0.79 | 0.68 | 0.78 | 0.67 | 0.77 | 0.66 | 0.76 | 0.65 |
| Mean K-S Statistic | 0.69 | 0.58 | 0.67 | 0.57 | 0.65 | 0.55 | 0.63 | 0.54 |
| Mean T-Test Statistic | 0.89 | 0.72 | 0.87 | 0.71 | 0.88 | 0.72 | 0.86 | 0.71 |
| Propensity Score SMD | −0.31 | −0.39 | −0.30 | −0.39 | −0.29 | −0.38 | −0.27 | −0.37 |
| Prognostic Score 1 SMD | 1.00 | 1.00 | 0.98 | 0.99 | 0.96 | 0.98 | 0.94 | 0.97 |
| Prognostic Score 2 SMD | 1.00 | 1.00 | 0.98 | 0.99 | 0.97 | 0.98 | 0.95 | 0.98 |
| Prognostic Score 3 SMD | 0.98 | 0.99 | 0.96 | 0.98 | 0.95 | 0.97 | 0.93 | 0.97 |
| Prognostic Score 4 SMD | 0.99 | 1.00 | 0.97 | 0.99 | 0.95 | 0.98 | 0.93 | 0.97 |
| Prognostic Score 5 SMD | 1.00 | 1.00 | 0.98 | 0.99 | 0.96 | 0.98 | 0.95 | 0.97 |
| Prognostic Score 6 SMD | 0.80 | 0.79 | 0.78 | 0.75 | 0.58 | 0.55 | 0.54 | 0.45 |
| Prognostic Score 7 SMD | 1.00 | 1.00 | 0.98 | 0.99 | 0.96 | 0.98 | 0.94 | 0.97 |
Mean SMD: Mean Standardized Mean Difference (SMD); Median SMD: Median SMD; Maximum SMD: Maximum SMD; %(SMD)<0.25: Percentage of SMDs less than 0.25; %(SMD)<0.1: Percentage of SMDs less than 0.1; Maximum K-S statistic: Maximum Kolmogorov-Smirnov statistic; Mean K-S statistic: Mean Kolmogorov-Smirnov statistic; Propensity Score SMD: SMD in Propensity Scores; Prognostic Score 1–7 SMD: SMD in Prognostic Scores for Prognostic Score Models 1–7; Cntns: all covariates are continuous; Mixed: a mixture of continuous and binary covariates.
Table 2.
Mean Pearson Correlations between balance measures and absolute bias for propensity score subclassification, N=1000
| Absolute Bias Outcome A | Absolute Bias Outcome B | Absolute Bias Outcome C | Absolute Bias Outcome D | |||||
|---|---|---|---|---|---|---|---|---|
| Cntns | Mixed | Cntns | Mixed | Cntns | Mixed | Cntns | Mixed | |
| Mean SMD | 0.90 | 0.68 | 0.89 | 0.68 | 0.89 | 0.66 | 0.88 | 0.65 |
| Median SMD | 0.55 | 0.42 | 0.53 | 0.42 | 0.53 | 0.41 | 0.51 | 0.40 |
| Max SMD | 0.75 | 0.60 | 0.75 | 0.60 | 0.77 | 0.58 | 0.77 | 0.58 |
| %(SMD) <0.25 | 0.52 | 0.35 | 0.51 | 0.34 | 0.50 | 0.33 | 0.49 | 0.32 |
| %(SMD) <0.1 | 0.82 | 0.65 | 0.81 | 0.64 | 0.83 | 0.63 | 0.82 | 0.62 |
| Mean K-S Statistic | 0.73 | 0.50 | 0.72 | 0.49 | 0.70 | 0.47 | 0.69 | 0.47 |
| Mean t-test statistic | 0.86 | 0.71 | 0.85 | 0.70 | 0.87 | 0.69 | 0.86 | 0.69 |
| Propensity Score SMD | −0.59 | −0.65 | −0.58 | −0.65 | −0.58 | −0.63 | −0.58 | −0.63 |
| Prognostic Score 1 SMD | 1.00 | 1.00 | 0.99 | 0.99 | 0.96 | 0.98 | 0.95 | 0.97 |
| Prognostic Score 2 SMD | 1.00 | 1.00 | 0.99 | 0.99 | 0.96 | 0.98 | 0.95 | 0.98 |
| Prognostic Score 3 SMD | 0.98 | 0.99 | 0.97 | 0.98 | 0.95 | 0.97 | 0.93 | 0.96 |
| Prognostic Score 4 SMD | 0.99 | 1.00 | 0.98 | 0.99 | 0.94 | 0.98 | 0.93 | 0.97 |
| Prognostic Score 5 SMD | 1.00 | 1.00 | 0.98 | 0.99 | 0.96 | 0.98 | 0.95 | 0.97 |
| Prognostic Score 6 SMD | 0.84 | 0.79 | 0.82 | 0.74 | 0.64 | 0.54 | 0.60 | 0.42 |
| Prognostic Score 7 SMD | 1.00 | 1.00 | 0.99 | 0.99 | 0.96 | 0.98 | 0.95 | 0.97 |
Mean SMD: Mean Standardized Mean Difference (SMD); Median SMD: Median SMD; Maximum SMD: Maximum SMD; %(SMD)<0.25: Percentage of SMDs less than 0.25; %(SMD)<0.1: Percentage of SMDs less than 0.1; Maximum K-S statistic: Maximum Kolmogorov-Smirnov statistic; Mean K-S statistic: Mean Kolmogorov-Smirnov statistic; Propensity Score SMD: SMD in Propensity Scores; Prognostic Score 1–7 SMD: SMD in Prognostic Scores for Prognostic Score Models 1–7; Cntns: all covariates are continuous; Mixed: a mixture of continuous and binary covariates.
Table 3.
Mean Pearson correlations between balance measures and absolute bias for full matching on the propensity score, N=1000
| Absolute Bias Outcome A | Absolute Bias Outcome B | Absolute Bias Outcome C | Absolute Bias Outcome D | |||||
|---|---|---|---|---|---|---|---|---|
| Cntns | Mixed | Cntns | Mixed | Cntns | Mixed | Cntns | Mixed | |
| Mean SMD | 0.84 | 0.65 | 0.83 | 0.64 | 0.83 | 0.61 | 0.82 | 0.60 |
| Median SMD | 0.50 | 0.36 | 0.48 | 0.35 | 0.47 | 0.34 | 0.46 | 0.33 |
| Max SMD | 0.70 | 0.58 | 0.70 | 0.58 | 0.72 | 0.55 | 0.72 | 0.55 |
| %(SMD) <0.25 | 0.38 | 0.20 | 0.38 | 0.20 | 0.35 | 0.18 | 0.34 | 0.18 |
| %(SMD) <0.1 | 0.76 | 0.63 | 0.74 | 0.62 | 0.76 | 0.60 | 0.75 | 0.59 |
| Mean K-S Statistic | 0.51 | 0.37 | 0.51 | 0.37 | 0.49 | 0.35 | 0.48 | 0.34 |
| Mean t-test statistic | 0.81 | 0.69 | 0.79 | 0.68 | 0.81 | 0.66 | 0.80 | 0.65 |
| Propensity Score SMD | −0.09 | −0.36 | −0.08 | −0.35 | −0.09 | −0.35 | −0.09 | −0.35 |
| Prognostic Score 1 SMD | 1.00 | 1.00 | 0.97 | 0.99 | 0.92 | 0.95 | 0.90 | 0.94 |
| Prognostic Score 2 SMD | 1.00 | 1.00 | 0.97 | 0.99 | 0.93 | 0.95 | 0.90 | 0.94 |
| Prognostic Score 3 SMD | 0.97 | 0.98 | 0.94 | 0.97 | 0.90 | 0.93 | 0.87 | 0.93 |
| Prognostic Score 4 SMD | 0.99 | 1.00 | 0.96 | 0.99 | 0.90 | 0.95 | 0.88 | 0.94 |
| Prognostic Score 5 SMD | 0.99 | 0.99 | 0.97 | 0.97 | 0.93 | 0.95 | 0.90 | 0.94 |
| Prognostic Score 6 SMD | 0.78 | 0.74 | 0.75 | 0.67 | 0.53 | 0.42 | 0.49 | 0.31 |
| Prognostic Score 7 SMD | 1.00 | 1.00 | 0.97 | 0.99 | 0.92 | 0.95 | 0.90 | 0.94 |
Mean SMD: Mean Standardized Mean Difference (SMD); Median SMD: Median SMD; Maximum SMD: Maximum SMD; %(SMD)<0.25: Percentage of SMDs less than 0.25; %(SMD)<0.1: Percentage of SMDs less than 0.1; Maximum K-S statistic: Maximum Kolmogorov-Smirnov statistic; Mean K-S statistic: Mean Kolmogorov-Smirnov statistic; Propensity Score SMD: SMD in Propensity Scores; Prognostic Score 1–7 SMD: SMD in Prognostic Scores for Prognostic Score Models 1–7; Cntns: all covariates are continuous; Mixed: a mixture of continuous and binary covariates.
Two other balance measures considered also exhibited good performance (i.e., correlations generally above 0.8): mean SMD and mean t-statistic. Across all simulation settings and propensity score methods, mean SMD was more strongly correlated with bias than the other SMD measures examined (median SMD, maximum SMD, % SMD < 0.25, % SMD < 0.1, and propensity score SMD). The mean t-statistic performed noticeably better than the mean K-S statistic, which may be due to the suitability of the t-statistic for the normally distributed variables used. Overall, the conclusions were similar in the N=500 and N=2000 simulations, with higher correlations observed as sample sizes increased. Interestingly, correlations tended to be greater for the prognostic score measures in the setting containing both continuous and dichotomous covariates compared to the continuous-only case, while the opposite trend was observed for all other balance measures. The propensity score SMD had negative correlations with bias but we caution over-interpretation of that result. The propensity score methods are essentially guaranteed to get good balance on the propensity scores and thus the propensity score SMDs were generally close to 0 across all 40 propensity score models, making the correlations less meaningful than they are for the other measures.
Discussion
In this paper we have shown that a new prognostic score–based balance measure is highly correlated with bias in the treatment effect estimate, even when the prognostic score model is misspecified. Researchers never know the level of bias present in a given analysis, since the true effects are unknown. However, our study indicates that some balance measures, particularly the proposed prognostic score measure, can serve as a proxy for the extent of bias reduction. Of course there may still be bias due to unobserved covariates, but balance measures can at least provide a sense of the amount of bias reduction on the observed covariates [2,22].
The proposed prognostic score measure is highly correlated with bias in the effect estimate across a range of settings. In addition, it is quite easy to use and automate. While some authors advocate fitting disease risk scores among the full sample, sometimes with an indicator for exposure/treatment [9], we argue that modeling the outcome only among the control group has two advantages: 1) It does not require modeling the treatment effect; and 2) It retains some of the spirit of the separation of design and analysis, in that it uses outcome data from only one group, and the prognostic scores are not used in the actual propensity score approach, but rather just in assessing the quality of the approach.
This study builds on previous work: Belitser et al. [20] also considered balance measures that weight variables according to the magnitude of their observed correlation with outcome in the context of a binary treatment and outcome; and Groenwold et al. considered the association between balance and bias for propensity score subclassification and matching [12]. Our results are broadly consistent with those of the Belitser et al., in that we found particularly high correlations between balance and bias for balance measures based on the SMD, as well as for measures that weighted variables based on their associations with outcome. However, our proposed prognostic score measure is more automated than that proposed by Belitser et al. and can be implemented for continuous, categorical, and ordinal outcomes without further modification. Furthermore, Belitser et al. considered only methods that adjust for the propensity score in the outcome model, an approach that has been found to be less effective than the three propensity score methods considered here [20,23]. In contrast to our results, Groenwold et al. [12] found low correlations with bias for subclassification and matching and moderate correlation for covariate adjustment. However, they did not incorporate the effect estimation method into the balance measure calculations, which may explain their lower correlations. Finally, like Belitser et al., we found higher correlations with larger sample sizes [20]. While the prognostic score still performed well even with n=500 (with correlations generally > .9), researchers may need to interpret balance measures with more caution in smaller samples. These results also highlight the value of examining multiple balance measures to get a more complete picture.
One important question regards variable selection for these models. It is important to recognize that there is no theoretical reason why the propensity and prognostic score models must necessarily contain the same terms. Current best practice for variable selection in propensity and prognostic score models suggests including in the propensity score model all confounders as well as variables related to the outcome only, while including in the prognostic score all variables related to the outcome. It is thus likely that the terms included in the two models will be similar, if not identical. Variable selection for propensity score methods remains an area of active research and is a key future research direction for prognostic score methods.
This work does have important limitations. As discussed previously, incorporating outcome information into the process of selecting a propensity score approach reduces the separation of design and analysis, a property strongly advocated by Rubin [24] and Rosenbaum [25]. Just as randomized experiments are designed (and conducted) without access to outcome data, there are benefits to designing an observational study without access to the outcome. This may be particularly crucial in research areas that are potentially controversial, where there is desire to prove that a particular design was not used in order to obtain a desired result. A potential solution to this in the prognostic score context could be the use of cross-validation, where the prognostic score model would be fit using a subset of the data that is not used in effect estimation. That approach may be particularly feasible in the large datasets that are available for many observational studies in CER. Relatedly, another possible limitation is that the estimation of prognostic scores is done in the same sample as the calculated predictions, which may lead to overfitting. It is unclear whether overfitting constitutes a significant problem in this context, although this method will inherently lead to better model fit in the control group than in the treatment group. Future work should investigate the consequences of overfitting and explore alternative methods, such as cross-validation or non-parametric estimation methods like random forests. Finally, our simulation studies considered only continuous outcomes; future work should examine other types of outcome distributions (e.g., binary), to see if the conclusions differ.
Three limitations (and directions for further research) are particularly relevant for CER. First, we considered a relatively small number of covariates in each setting. Future work should examine how this approach performs in high-dimensional settings with many covariates. Future studies should also examine prognostic score estimation strategies and investigate whether non-parametric approaches may be beneficial [3]. Second, we consider only constant treatment effects, and continuous outcomes. In our simple setting the treatment effect can be estimated from the coefficient on the treatment variable in a model of outcome on treatment status; this is not true for more general models, such as those with non-continuous outcomes or interactions between treatment status and covariates. Non-constant treatment effects will imply treatment by covariate interactions, which in turn imply outcome models that differ between treatment and control groups; in that context, the prognostic score model fit in the control group may not closely match the outcome model for the treatment outcomes. While the prognostic score itself will still be a valid measure, it may be important (for example) to estimate one prognostic score model in each treatment group. Examining balance on prognostic scores calculated for each treatment condition may also be justified when the two treatments being compared are both active treatments and it is not clear which is the “control” condition. Another possibility would be to consider the more common treatment the “control” group. Finally, an important consideration is that many comparative effectiveness studies have multiple outcomes of interest. Future work should examine how to extend the methods described here for multiple outcomes, where, for example, there may be multiple prognostic scores. For now, the methods proposed may be particularly useful for settings with one primary outcome of interest, such as mortality, short-term functioning, or quality of life.
Despite these limitations, this work provides useful information for researchers conducting non-experimental studies in CER. In particular, we have shown that our proposed prognostic-score based balance measure yields high correlations with bias in the treatment effect estimate, and thus may serve as a good indicator for the success of a particular approach for reducing bias in observed covariates.
What is new?
-
-
Balance measures allow assessment of whether a propensity score approach is likely to have reduced bias in the treatment effect estimate. It is important to link the calculation of balance measures to how the propensity scores will be used in estimating treatment effects.
-
-
Balance measures based on the expected prognosis under one condition (e.g., control) perform particularly well.
-
-
Comparative effectiveness research studies can use the prognostic-score based balance measure to gauge the success of their propensity score approach.
Acknowledgements
Supported in part by Award K25MH083846 (PI: Stuart) from the National Institute of Mental Health. The content is solely the responsibility of the author and does not necessarily represent the official views of the National Institute of Mental Health or the National Institutes of Health.
Footnotes
Publisher's Disclaimer: This is a PDF file of an unedited manuscript that has been accepted for publication. As a service to our customers we are providing this early version of the manuscript. The manuscript will undergo copyediting, typesetting, and review of the resulting proof before it is published in its final citable form. Please note that during the production process errors may be discovered which could affect the content, and all legal disclaimers that apply to the journal pertain.
References
- [1].Martens EP, Pestman WR, de Boer A, Belitser SV, Klungel OH. Systematic differences in treatment effect estimates between propensity score methods and logistic regression. International Journal of Epidemiology. 2008;37:1142–1147. doi: 10.1093/ije/dyn079. [DOI] [PubMed] [Google Scholar]
- [2].Stuart EA. Matching methods for causal inference: A review and a look forward. Statistical Science. 2010;25(1):1–21. doi: 10.1214/09-STS313. [DOI] [PMC free article] [PubMed] [Google Scholar]
- [3].Lee B, Lessler J, Stuart EA. Improving propensity score weighting using machine learning. Statistics in Medicine. 2009;29(3):337–346. doi: 10.1002/sim.3782. [DOI] [PMC free article] [PubMed] [Google Scholar]
- [4].Arbogast PG, Ray WA. Use of disease risk scores in pharmacoepidemiologic studies. Statistical Methods in Medical Research. 2009;18(1):67–80. doi: 10.1177/0962280208092347. [DOI] [PubMed] [Google Scholar]
- [5].Hansen BB. The prognostic analogue of the propensity score. Biometrika. 2008;95(2):481–488. [Google Scholar]
- [6].Austin PC, Grootendorst P, Anderson GM. A comparison of the ability of different propensity score models to balance measured variables between treated and untreated subjects: A Monte Carlo study. Statistics in Medicine. 2007;26:734–753. doi: 10.1002/sim.2580. [DOI] [PubMed] [Google Scholar]
- [7].Patrick AR, Schneeweiss S, Brookhart MA, Glynn RJ, Rothman KJ, Avorn J, Sturmer T. The implications of propensity score variable selection strategies in pharmacoepidemiology: An empirical illustration. Pharmacoepidemiology and Drug Safety. 2011;20(6):551–559. doi: 10.1002/pds.2098. [DOI] [PMC free article] [PubMed] [Google Scholar]
- [8].Schneeweiss S, Rassen JA, Glynn RJ, Avorn J, Mogun H, Brookhart MA. High-dimensional propensity score adjustment in studies of treatment effects using health care claims data. Epidemiology. 2009;20:512–522. doi: 10.1097/EDE.0b013e3181a663cc. [DOI] [PMC free article] [PubMed] [Google Scholar]
- [9].Glynn RJ, Gagne JJ, Schneeweiss S. Role of disease risk scores in comparative effectiveness research with emerging therapies. Pharmacoepidemiology and Drug Safety. 2012;21(S2):138–147. doi: 10.1002/pds.3231. [DOI] [PMC free article] [PubMed] [Google Scholar]
- [10].Rubin DB, Thomas N. Combining propensity score matching with additional adjustments for prognostic covariates. Journal of the American Statistical Association. 2000;95:573–585. [Google Scholar]
- [11].Rosenbaum PR, Rubin DB. The central role of the propensity score in observational studies for causal effects. Biometrika. 1983;70:41–55. [Google Scholar]
- [12].Groenwold RHH, de Vries F, de Boer A, Pestman WR, Rutten FH, Hoes AW, Klungel OH. Balance measures for propensity score methods: A clinical example on beta-agonist use and the risk of myocardial infarction. Pharmacoepidemiology and Drug Safety. 2011;20(11):1130–1137. doi: 10.1002/pds.2251. [DOI] [PubMed] [Google Scholar]
- [13].Westreich D, Cole SR, Funk MJ, Brookhart MA, Sturmer T. The role of the c-statistic in variable selection for propensity score models. Pharmacoepidemiology and Drug Safety. 2011;20:317–320. doi: 10.1002/pds.2074. [DOI] [PMC free article] [PubMed] [Google Scholar]
- [14].Brookhart MA, Schneeweiss S, Rothman KJ, Glynn RJ, Avorn J, Sturmer T. Variable selection for propensity score models. American Journal of Epidemiology. 2006;163(12):1149–1156. doi: 10.1093/aje/kwj149. [DOI] [PMC free article] [PubMed] [Google Scholar]
- [15].Rubin DB. Using propensity scores to help design observational studies: application to the tobacco litigation. Health Services & Outcomes Research Methodology. 2001;2:169–188. [Google Scholar]
- [16].Imai K, King G, Stuart EA. Misunderstandings between experimentalists and observationalists about causal inference. (Series A).Journal of the Royal Statistical Society. 2008;171:481–502. [Google Scholar]
- [17].Austin PC. Balance diagnostics for comparing the distribution of baseline covariates between treatment groups in propensity-score matched samples. Statistics in Medicine. 2009;28:3083–3107. doi: 10.1002/sim.3697. [DOI] [PMC free article] [PubMed] [Google Scholar]
- [18].Ho DE, Imai K, King G, Stuart EA. MatchIt: Nonparametric preprocessing for parametric causal inference. Journal of Statistical Software. 2011;42(8):1–28. [Google Scholar]
- [19].Hansen BB, Klopfer SO. Optimal full matching and related designs via network flows. Journal of Computational and Graphical Statistics. 2006;15:609–627. [Google Scholar]
- [20].Belitser SV, Martens EP, Pestman WR, Groenwold RHH, de Boer A, Klungel OH. Measuring balance and model selection in propensity score methods. Pharmacoepidemiology and Drug Safety. 2011;20:1115–1129. doi: 10.1002/pds.2188. [DOI] [PubMed] [Google Scholar]
- [21].Lumley T. Analysis of Complex Survey Samples. Journal of Statistical Software. 2004;9(1):1–19. R Package version 2.2. [Google Scholar]
- [22].Schneeweiss S. Sensitivity analysis and external adjustment for unobserved confounders in epidemiologic database studies of therapies. Pharmacoepidemiology and Drug Safety. 2006;15(5):291–303. doi: 10.1002/pds.1200. [DOI] [PubMed] [Google Scholar]
- [23].Schafer JL, Kang J. Average causal effects from nonrandomized studies: A practical guide and simulated example. Psychological Methods. 2008;13:279–313. doi: 10.1037/a0014268. [DOI] [PubMed] [Google Scholar]
- [24].Rubin DB. On principles for modeling propensity scores in medical research. Pharmacoepidemiology of Drug Safety. 2004;13:855–857. doi: 10.1002/pds.968. [DOI] [PubMed] [Google Scholar]
- [25].Rosenbaum PR. Various practical issues in matching. Design of Observational Studies. 2010;Part 2:187–195. [Google Scholar]