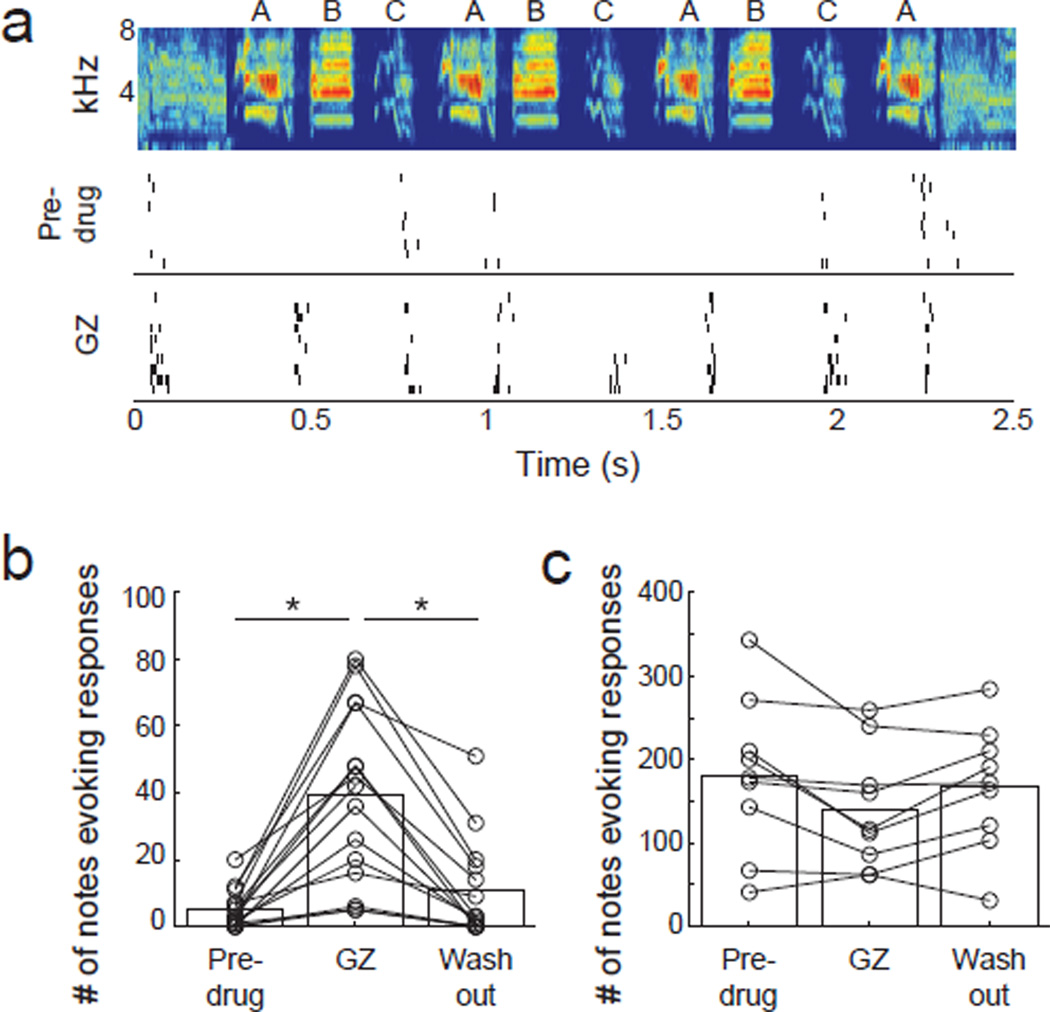
Figure 7. Sparsification due to synaptic inhibition.
(A) Spectrogram (top) and responses of a BS neuron to a song without (middle) and with (bottom) local administration of gabazine. (B) Number of notes that BS neurons respond to before, during and after gabazine application (n = 14). (C) Number of notes that NS neurons respond to before, during and after gabazine application (n = 9). Asterisks indicate groups that are significantly different (p < 0.05, Wilcoxon).

