

Abstract
BACKGROUND AND AIMS
Cystic lesions of the pancreas are increasingly being recognized due to the widespread use of high resolution abdominal imaging. Since certain cyst types are precursors to invasive cancer, this situation presents an opportunity to intervene prior to malignant progression. Effective implementation of that strategy has been hampered by difficulties in clearly distinguishing cystic lesions with no malignant potential from those with malignant potential. Here we explored whether glycosylation variants on specific proteins in cyst fluid samples could serve as biomarkers to aid in this diagnosis.
METHODS
We utilized a novel antibody-lectin sandwich microarray method to measure the protein expression and glycosylation of MUC1, MUC5AC, MUC16, CEA, and other proteins implicated in pancreatic neoplasia in cyst fluid samples. Fifty-three cyst fluid samples were obtained from patients with mucinous cystic neoplasms (MCN, n = 17), intraductal papillary mucinous neoplasms (IPMN, n = 15), serous cystadenomas (SC, n = 12), or pseudocysts (PC, n = 9), with confirmation of histologic diagnosis at surgical resection.
RESULTS
The detection of a glycan variant on MUC5AC using the lectin wheat-germ agglutinin discriminated mucin-producing cystic tumors (MCNs + IPMNs) from benign cystic lesions (SC + PC) with a 78% sensitivity at 80% specificity, and when used in combination with cyst fluid CA 19-9 gave a sensitivity of 87% at 86% specificity. These biomarkers performed better than cyst fluid CEA (37%/80% sensitivity/specificity).
CONCLUSIONS
These results demonstrate the value of glycan variants for biomarker discovery and suggest that these biomarkers could greatly enhance the accuracy of differentiating pancreatic cystic tumors. Validation studies will be required to determine the clinical value of these markers.
Introduction
The development of effective diagnostic and treatment strategies for pancreatic cancer has been extremely challenging. Because of the difficulty in detecting pancreatic cancer at early stages, most cancers are advanced at the time of diagnosis and refractory to existing treatment. The detection and surgical removal of locally invasive cancer results in improved survival rates1, but the cancer still recurs in most patients. The cause of recurrence is most likely due to the early escape from the primary tumor, prior to surgery, of metastatic cancer cells that eventually develop into advanced disease. Since micrometastatic cancer can occur at such early stages of the primary tumor, the best hope for long-term cures of pancreatic cancer may be the surgical removal of pre-malignant precursor lesions that have not yet developed into invasive cancer 2-4. However, effective means to routinely detect pre-invasive pancreatic neoplasms do not currently exist.
Recent research has provided firm evidence for the stepwise development of pancreatic ductal adenocarcinomas—the most common and deadly form of pancreatic cancer—from three types of precursor lesions2. The most prevalent precursor type is pancreatic intraepithelial neoplasia (PanIN)5, 6, which arises in the epithelial cells of pancreatic ducts. It is not yet possible to detect PanINs for screening purposes since they are too small to be seen by imaging and are not associated with any secreted biomarker. The other two precursor lesions are mucinous cystic neoplasms (MCN) and intraductal papillary mucinous neoplasms (IPMN). While these precursors are rarer than PanINs, they account for the development of up to 10-15% of pancreatic cancers7. Unlike PanINs, they can be detected by CT or ultrasound imaging, giving the possibility of detecting and removing these cancer precursors prior to the development of invasive cancer4. With the current widespread use of high resolution abdominal imaging, pancreatic cystic tumors are increasing being identified, many of which are in the asymptomatic patient8. As many as 1% of abdominal CT scans reveal pancreatic cysts9, with that number potentially increasing as the resolution of imaging technology improves. This detection of pancreatic “incidentalomas” presents an opportunity to reduce pancreatic cancer mortality through the removal of these precursor lesions prior to the development of invasive cancer. However, certain diagnostic challenges need to be addressed before that strategy could make a significant impact on pancreatic cancer.
A major challenge in diagnosing pancreatic cystic lesions arises from the fact that certain benign cyst types, which have no potential to progress to cancer, are sometimes difficult to distinguish from the MCN and IPMN cancer precursors. It is important to accurately make this distinction so that surgical removal is performed only in patients in whom resection is beneficial. The two most common types of benign cystic lesions found in the pancreas are pancreatic pseudocysts and serous cystadenomas. Unfortunately, current methods of evaluating cystic pancreatic lesions are limited in differentiating pseudocysts from mucin-containing cystic tumors. In addition, preoperative imaging or endoscopic studies do not reliably differentiate between serous and mucin-producing neoplasms. Although the use of endoscopic ultrasound (EUS) and analysis of cyst fluid can generally differentiate between the two types, accuracy of no greater than 79% is reported in the literature10.
A promising means of diagnosing the type of cystic tumor is the analysis of the fluid trapped inside the cyst, which can be collected by endoscopic ultrasound fine-needle aspiration (EUS-FNA). The cytologic examination of cyst fluid has low diagnostic sensitivity11, presumably because of the paucity of tumor cells within the cyst itself. Recently, molecular studies have been performed on cyst fluid samples in order to discover biomarkers secreted by the encapsulating epithelial cells that are indicative of the type of cyst. Thus far, the most accurate biomarker is carcinoembryonic antigen (CEA). A combined analysis of 12 different studies found that CEA distinguished mucin-producing (not including IPMN) from benign cysts with an average 48% sensitivity and 98% specificity11. Other types of biomarkers that have been tested in cyst fluid include DNA quality and mutations12, tumor-associated trypsin inhibitor13, and the presence of mucin14, 15. Despite great initial enthusiasm for the commercially available REDPATH ™ evaluation of cyst fluid, this proprietary DNA analysis appears to have significant limitations to accurately select patients who require surgery, and has not replaced CEA testing for routine diagnostic analysis16.
An alternative strategy for the development of biomarkers for pancreatic cancer is to analyze carbohydrate alterations associated with particular proteins found in the cyst fluid. Changes to glycans on proteins are common in pancreatic cancer and are thought to play functional roles in the disease17-20. The detection of carbohydrate changes may yield more effective biomarkers relative to measurements of core protein levels because they may be altered more reliably. The value of measuring glycan variants for biomarker discovery in several cancer types has been demonstrated in studies, including elevated fucose levels on haptoglobin21-23 in breast, ovarian cancer and pancreatic cancer , on alpha-1-antitrypsin24 in ovarian cancer, and on alpha-fetoprotein25, 26 in hepatocellular carcinoma. In addition, glycan-based biomarkers in the serum of pancreatic cancer patients have shown considerable promise27, 28.
A particularly valuable platform for probing glycan variants on multiple, specific proteins in biological samples is the antibody-lectin sandwich microarray29, 30. This approach complements previous technologies by enabling the sensitive probing of changes to particular glycan structures on specific proteins, which is not possible using mass spectrometry or chromatographic methods. Unlike conventional methods, microarray methods require only small amounts of sample (typically 6 μl of fluid after dilution), making them suitable for studies on cyst fluid. Furthermore, antibody microarrays can be run in a high-throughput fashion, so that population-based studies can be performed to assess biomarker potential.
Here we test the hypothesis that the abundance or glycosylation of particular proteins in cyst fluid is significantly different between mucin-producing cystic tumors (MCNs and IPMNs) and benign cystic lesions. We designed antibody microarrays to target proteins that are known to be secreted by cancer cells and that often display altered glycosylation18, including the mucins MUC1, MUC5AC, and MUC16, and CEA. The antibody microarrays were processed to measure either the abundance or the glycosylation state of these proteins in cyst fluid samples from patients with MCNs, IPMNs, SCs or PCs. We demonstrate that specific molecular features which characterize the fluid of each of these states may form the basis of biomarkers that improve the accuracy of differentiating pancreatic cystic tumor type.
Materials and Methods
Patients and Cyst Fluid Samples
The study was conducted in strict compliance with the guidelines of the University of Michigan and University of Indiana School of Medicine Institutional Review Boards. After obtaining signed informed consent, cyst fluid samples were collected at the time of endoscopy or operation at the University of Michigan (n = 37) and Indiana University (n = 16). All patients enrolled in the study had operative treatment of the cystic lesion and the surgical pathology report was used to confirm the diagnosis of cyst type in all patients. The majority of the IPMN lesions studied were side-branch lesions. Cyst fluid specimens were immediately placed on ice after procurement and were aliquoted and stored at −80° C. Each sample was thawed no more than three times prior to analysis in order to minimize variability introduced by that process. Each sample was centrifuged at 10,000 × g for 10 minutes to remove remaining debris prior to use. The samples were randomized in their handling and experimental processing.
Biological reagents
Antibodies were purchased from various sources (see Supplementary Table 1). Antibodies were purified by dialysis (Slide-A-lyzer, Pierce Biotechnology, Rockford, IL) to PBS buffer and ultracentrifuged before the concentration of each antibody was adjusted to 500 μg/ml for microarray printing. The integrity and purity of each antibody was confirmed by SDS-PAGE under reducing and non-reducing conditions. Antibody biotinylation was performed using EZ-Link-sulfo-NHS-LC-biotin (Pierce Biotechnology, Rockford, IL).
Microarray fabrication and preparation
Antibody microarrays were prepared as previously described31. A piezoelectric non-contact printer (Biochip Arrayer, PerkinElmer Life Sciences, Waltham, MA) was used to spot approximately 350 pl of each antibody solution on the surfaces of ultrathin nitrocellulose-coated glass microscope slides (PATH slides, GenTel Biosciences, Madison, WI). Sixty identical arrays were printed on each slide, with each array consisting of 16 antibodies targeting proteins of interest, as well as control immunoglobulins from several species, printed in triplicate. A wax border was imprinted around each of the arrays to define hydrophobic boundaries (SlideImprinter, The Gel Company, San Francisco, CA). The printed slides were stored at 4°C in a desiccated, vacuum-sealed slide box until use.
Sandwich assays
Assays were performed similar to previously described methods29, 31. Cyst fluid samples were diluted with PBS buffer containing 0.1% Brij, 0.1% Tween-20 and 50 ug/ml of protease inhibitor. An IgG/IgY cocktail consisting of a final concentration of 400 ug/ml goat, mouse and sheep IgG, 400 ug/ml chicken IgY and 800 ug/ml rabbit IgG (Jackson Immunoresearch, West Grove, PA) was added to each cyst fluid sample to eliminate non-specific binding to the printed antibodies. Slides were blocked in solution containing PBS-0.5% Tween-20 buffer (PBST0.5) with the addition of 1% BSA. Additionally, samples were spun at 16,000×g for 3 minutes to separate viscous components. 6 μl of sample was then applied to each array. Captured antigens were detected with biotinylated antibodies at a concentration of 1-10 μg/ml, followed by incubation with 1 μg/ml streptavidin-phycoerythrin (Roche Applied Science, Indianapolis, IN). The slides were scanned for fluorescence emission at 575 nm using a microarray scanner (LS Reloaded, TECAN, Durham, NC). All arrays assaying the same glycoprotein were scanned concurrently at a single laser power and detector gain setting.
Lectin detection assays
Prior to using the antibody microarrays for glycan detection, the glycans on the spotted antibodies were chemically derivatized as described previously29 to prevent lectin binding to the capture antibodies. Briefly, the slides were incubated in a coupling buffer (0.1M sodium acetate, pH5.5, with 0.1% Tween-20) for 30 min, transferred into 200 mM NaIO4 solution (Pierce Biotechnology, Rockford, IL) and incubated at 4°C for 2 hr in the dark to oxidize the sugar groups on printed antibodies. The slides were rinsed in coupling buffer and incubated with a solution containing 1mM MPBH (4-(4-N-Maleimidophenyl))butyric acid hydrazide hydrochloride (Pierce Biotechnology, Rockford, IL) and 1 mM Cys-Gly dipeptide (Sigma-Aldrich, St. Louis, MO) for 2 hr at room temperature to derivatize the carbonyl groups. The slides were rinsed with PBST0.1 buffer and incubated with 1 mM Cys-Gly in PBST0.1 buffer overnight at 4°C. After the slides were rinsed thoroughly with PBST0.1 buffer and dried by centrifugation, the sandwich assay protocol was followed. Instead of detection antibodies, biotin-labeled lectins were used as the detection reagent at a concentration of 10 ug/ml.
Western blots
Cyst fluid samples were diluted 1:10 in sample buffer (final concentrations of 50 mM Tris, pH 6.8; 2% SDS; 10% glycerol; 2.5% beta-Mercaptoethanol; and 0.02% Bromophenol blue), and cell lysates were diluted 1:1.5 in sample buffer. Fifteen μl of each diluted sample was boiled for five minutes, separated on 4-12% Bis-Tris SDS-PAGE gels (Criterion XT, Bio-Rad, Hercules, CA), and transferred to a nitrocellulose membrane (0.45 μM, BioRad). The membranes were blocked overnight, probed with monoclonal antibodies or biotinylated lectins, and detected with anti-mouse IgG-HRP or streptavidin conjugated to HRP, respectively (Pierce Biotechnology, Rockford, IL). The stained bands were visualized using the SuperSignal West Pico Chemiluminescent substrate (Pierce Biotechnology, Rockford, IL), followed by exposure to Kodak Biomax XAR film (Sigma-Aldrich, St. Louis, MO).
Data analysis
Image data were quantified using GenePix Pro 5.1 (Axon Instruments, Union City, CA). The net fluorescent signal was calculated by subtracting the median local background surrounding each spot from the median intensity of the corresponding spot. The signal intensities from replicate antibody measurements within the same array were averaged.
Some measurements were removed from the analysis due to high signal in the negative controls, indicating possible high levels of non-specfic binding. For a given lectin-antibody combination, if the average signal over all the samples was not greater than twice the signal detected at the mouse IgG negative control spots (using the relevant detection lectin), or if the average signal was not greater than twice the signal detected from PBS as the sample instead of cyst fluid (using the relevant lectin-antibody combination), then the given lectin-antibody combination was removed from subsequent analyses.
Multiparametric classification
The logistic regression forward selection with 5-fold cross-validation (CV) was implemented for multiparametric model building. At each iteration, the classifier was selected so that it gave the biggest incremental value among all the remaining antibodies to the likelihood of the existing marker panel. The coefficients of the classifiers were updated correspondingly. We used a cross-validation process to determine the optimal number of antibodies in the marker panel. Due to small sample size, a 5-fold cross-validation was applied in this study, where 80% of the samples were used as training set to define a best model for classification while 20% of the samples were reserved as testing set to determine the error rate of the model when using prediction probability 0.5 as cut-off point. This process was repeated 5 times, each time using a different group of 80% for classification, and the cross-validation error is the average of the five error rates. The entire 5-fold CV was then repeated 100 times and a classifier is considered final when the further addition of an antibody caused an increase in the averaged cross-validation error. The cross-validation process simulates the uncertainty in the classification algorithm and estimates the prediction error of the selected combined classifier. Therefore, this validation gives extra protection against the chance of over-fitting, or creating a classifier specifically for a particular sample set.
Results
Profiling protein and glycan levels in cyst fluid samples
Cyst fluid samples were collected from 53 different patients (Table 2), and the samples were grouped according to the pathological examination of the resected cyst, including serous cystadenoma (n = 12), pseudocyst (n = 9), mucinous cystic neoplasm (n = 17), and intraductal papillary mucinous neoplasm (n = 15). The samples were analyzed using a novel format of antibody microarray that makes it possible to obtain measurements of protein levels and their associated glycans in parallel assays (Fig. 1a and 1b). Using small sample volumes (≤ 3 μl of cyst fluid diluted to 6 μl), samples were incubated on antibody arrays to allow the capture of multiple, specific proteins. The levels of the core proteins were probed with the appropriate antibodies (Fig. 1a), and the glycan levels on the captured proteins were probed with a variety of lectins (Fig. 1b). The ability to process microarrays in a high-throughput mode (Fig. 1c) allowed the probing of many samples with many different detection reagents, while the low volume of each assay enabled the probing of each sample many times. Representative data shows the detection of proteins by antibodies and their glycans using lectins (Fig. 1d). Each lectin binds a distinct glycan structure (Table 1), and the variation between proteins and samples in the levels of particular glycan structures is observed in the lectin binding patterns.
Table 2.
Patient Demographic Information
| Type | Number | Male (%) | Average Age (std. dev.) |
|---|---|---|---|
| PC | 9 | 2 (22%) | 35 (17) |
| SC | 12 | 4 (33%) | 43 (18) |
| MCN | 17 | 0 (0%) | 46 (12) |
| IPMN | 15 | 6 (40%) | 63 (13) |
| Total | 53 | 12 (23%) | 48 (17) |
| p-value, (PC+SC) vs. (MCN+IPMN) | 0.4 | 0.002 |
Figure 1.

Protein and glycan detection on antibody arrays. a) Array-based sandwich assays for protein detection. Multiple antibodies are immobilized on a planar support, and the captured proteins are probed using biotinylated detection antibodies, followed by fluorescence detection using phycoerythrin-labeled streptavidin. b) Glycan detection on antibody arrays. This format is similar to above, but the detection reagents target the glycans on the capture proteins rather than the core proteins. The glycans on the immobilized antibodies are chemically derivatized to prevent lectin binding to those glycans. c) High-throughput sample processing. Forty-eight or sixty identical microarrays are printed on one microscope slide, segregated by hydrophobic boundaries. A set of serum samples is incubated on the arrays in a random order, and each slide is probed with a single antibody or lectin. d) Example antibody array results for specific capture antibodies (indicated at left) and detection reagents (indicated in the column labels), after incubation with the indicated samples.
Table 1.
Antibodies and Lectins Used for Biomarker Analysis
| Antibody or Lectin Name | Clone ID |
Supplier | Catalog Number | Target |
|---|---|---|---|---|
| Anti-Alpha-1-antitrypsin (Ab 1) |
Polyclonal | Abcam | AB7633 | Alpha-1-antitrypsin |
| Anti-Alpha-1-antitrypsin (Ab 2) |
8A0 | Biotrend | BT06-4055-07 | Alpha-1-antitrypsin |
| Anti-Amylase | O.G.3 | US Biological | A2274-05 | Amylase |
| Anti-Angiostatin | 79735 | Sigma | A0976 | Angiostatin |
| Anti-CA 19-9 | 1.B.844 | US Biological | C0075-07 | Sialyl Lewis A |
| Anti-CEA (Ab 1) | 2Q397 | US Biological | C1299-94 | CEA |
| Anti-CEA (Ab 2) | 6D308 | US Biological | C2589-76A | CEA |
| Anti-CEACAM6 | By114 | Santa Cruz | SC-20059 | CEACAM6 |
| Anti-Endostatin | 1837-46 | Abcam | AB15685 | Endostatin |
| Anti-Fibronectin | Polyclonal | R&D Systems | AF1918 | Fibronectin |
| Anti-MUC1 (Ab 1) | 1.B.831 | US Biological | C0050-23 | MUC1 |
| Anti-MUC1 (Ab 2) | SM3 | Abcam | AB22711 | MUC1 |
| Anti-MUC16 (Ab 1) | 1.B.821 | US Biological | C0050-01 | MUC16 |
| Anti-MUC16 (Ab 2) | X325 | Abcam | AB10033 | MUC16 |
| Anti-MUC5AC (Ab 1) | 45M1 | Biogenesis | 1695-0128 | MUC5AC |
| Anti-MUC5AC (Ab 2) | CLH2 | Chemicon International |
MAB2011 | MUC5AC |
| Anti-pan CEACAM | D14HD11 | Abcam | AB4567 | CEACAM1, 3, 4, 5, 6 |
| Goat IgG | N/A | Jackson Immunoresearch |
005-000-003 | N/A |
| Mouse IgG | N/A | Jackson Immunoresearch |
015-000-003 | N/A |
| Sheep IgG | N/A | Jackson Immunoresearch |
013-000-003 | N/A |
| Aleria aurantia Lectin (AAL) | N/A | Vector Labs | B-1395 | Alpha-linked fucose |
| Sambucus nigra lectin (SNA) | N/A | Vector Labs | B-1305 | Alpha-2,6-linked sialic acid |
| Concanavalin A (ConA) | N/A | Vector Labs | B-1005 | Alpha-linked mannose |
| Vicia villosa lectin (VVL) | N/A | Vector Labs | B-1235 | Alpha- or beta-linked terminal N- acetylgalactosamine (GalNAc) |
| Wheat Germ Agglutinin (WGA) |
N/A | Vector Labs | B-1025 | N-acetylglucosamine (GlcNAc) |
| Erythrina cristagalli lectin (ECL) |
N/A | Vector Labs | B-1145 | Galactosyl (ß-1,4) N- acetylglucosamine (LacNAc) |
| Jacalin | N/A | Vector Labs | B-1155 | Galactosyl (ß-1,3) N- acetylgalactosamine (T- antigen) |
Discriminating patient groups
In order to address the diagnostic challenge of discriminating mucin-producing neoplasms (MCN + IPMN) from benign cystic lesions (SC + PC), we quantified the relative protein and glycan levels in individual cyst fluid samples and then compared the levels between the groups. Multiple protein and glycan measurements were significantly different (p < 0.02) between mucin-producing and benign lesions (Table 3). Specifically, MUC5AC and its glycan variants were elevated in the mucin-producing cystic tumor samples, while MUC1 was elevated in the non-mucin-producing samples. CEA was moderately elevated in the mucinous samples (p = 0.025), and glycan variants of CEACAM6 were elevated in the non-mucinous samples. The CA 19-9 antigen was higher in the mucin-producing cystic tumor samples.
Table 3.
Markers that significantly discriminate mucinous from non-mucinous cysts
| Capture Antibody | Detection Antibody or Lectin |
p values | AUC (95% C.I.) |
Sens. at 80% spec. |
Spec. at 80% sens. |
Up-regulated in |
|---|---|---|---|---|---|---|
| Anti-MUC5AC Ab 1 |
Anti-MUC5AC Ab 1 | 0.0090 | 0.72 (0.56- 0.84) |
0.53 | 0.43 | Mucinous |
| Anti-MUC5AC Ab 1 |
WGA | 0.0015 | 0.88 (0.76- 0.95) |
0.78 | 0.76 | Mucinous |
| Anti-MUC5AC Ab 1 |
Jacalin | 4.00E-04 | 0.83 (0.73- 0.93) |
0.72 | 0.7 | Mucinous |
| Anti-MUC5AC Ab 1 |
VVL | 0.0140 | 0.82 (0.68- 0.93) |
0.75 | 0.52 | Mucinous |
| Anti-MUC5AC Ab 1 |
ECL | 0.0018 | 0.81 (0.64- 0.88) |
0.69 | 0.57 | Mucinous |
| Anti-CEACAM6 | Anti-pan CEACAM | NS (0.83) | - | - | - | - |
| Anti-CEACAM6 | ECL | 0.010 | 0.70 (0.57- 0.86) |
0.5 | 0.52 | Nonmucinous |
| Anti-CEACAM6 | ConA | 0.0096 | 0.67 (0.53- 0.81) |
0.56 | 0.38 | Nonmucinous |
| Anti-CA 19-9 | Anti-CA 19-9 | 2.00E-04 | 0.79 (0.66- 0.90) |
0.75 | 0.24 | Mucinous |
| Anti-CEA Ab 1 | Anti-pan CEACAM | NS (0.025) | 0.67 (0.55- 0.83) |
0.37 | 0.67 | - |
| Anti-CEA Ab 1 | Anti-CA 19-9 | 0.018 | 0.84 (0.73- 0.92) |
0.72 | 0.71 | Mucinous |
| Anti-MUC1 Ab 1 | Anti-MUC1 Ab 1 | 0.0093 | 0.64 (0.47- 0.80) |
0.19 | 0.48 | Nonmucinous |
| Anti-Fibronectin | Jacalin | 0.013 | 0.69 (0.56- 0.82) |
0.5 | 0.43 | Nonmucinous |
The assays are shown that have p < 0.02 and that passed criteria (described in the Methods section) to eliminate measurements with possible high contributions from non-specific binding. AUC, area-under-the-curve; C.I., confidence interval.
A cluster of the most significant measurements (p < 0.02) shows the patterns among the different patient samples (Fig. 2). The samples clearly segregate according to their status as either mucin-producing cystic tumors or benign cystic lesions (serous cystadenomas and pseudocysts). Subgroups within those classifications were also evident, as the serous cystadenomas are segregated from pseudocysts, and many of the mucin-producing cystic tumors had divergent expression patterns of CA 19-9 and MUC5AC.
Figure 2.
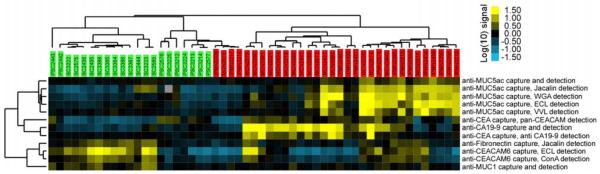
Cluster analysis of antibody-lectin sandwich array results. Measurements showing significant differences (p < 0.02) between mucin-producing cystic neoplasms (MCN and IPMN) to non-mucinous cysts (SC and PC) are presented. Each square represents the signal level from a sample (indicated by the column labels) detected with a particular capture antibody and detection reagent (indicated by the row labels). Each column label gives the diagnosis and a patient identifier, and the color of the label indicates whether the sample is a mucin-producing cystic neoplasms (MCN or IPMN, red) or non-mucinous cyst (SC or PC, green). The fluorescence values were log-transformed (base 10) and median-centered along each row in order to clearly show the variation between the samples. The color bar gives the scale, in which each unit represents a 10-fold change.
We examined in more detail the biomarkers with the greatest differences between the groups. One of the most significant biomarkers was Wheat Germ Agglutinin (WGA) detection of the MUC5AC protein (indicated as WGA-MUC5AC). WGA-MUC5AC showed no elevation in PC and SC but high elevation in some of the MCN and IPMN samples (Fig. 3A), indicating that a biomarker based on this molecule may have good specificity (low false positives) and moderate sensitivity (moderate true positives) for distinguishing mucin-producing from non-mucinous benign lesions (78% sensitivity at 80% specificity). CEA was elevated in a higher proportion of the mucin-producing cystic tumors, and was not elevated in the serous cystadenomas, but it was elevated in the PC, yielding good performance in distinguishing SC from mucin-producing cystic tumors but only moderate performance distinguishing mucin-producing cystic tumors from all non-mucinous cysts (37% sensitivity at 80% specificity) (Fig. 3B). CA 19-9 was primarily elevated in MCN, rarely in IPMN, and not at all in the non-mucinous cysts (Fig. 3C). MUC1, in contrast to its related mucin family member MUC5AC, was elevated primarily in the serous cystadenomas (Fig. 3D). The complementary nature of these markers suggests that some markers may be used in combination to achieve higher-accuracy discrimination as compared to the individual markers. The discrimination of MCN from IPMN also can be diagnostically challenging in some patients. The best biomarker to discriminate between MCN and IPMN was CA 19-9 (sensitivity/specificity = 82%/93%) (Fig. 3C). No other marker performed nearly as well for distinguishing MCN from IPMN.
Figure 3.

Box plots indicating the levels of particular markers in each class. Each point represents an individual sample. The boxes indicate the quartiles, with the median indicated by the horizontal lines, and the vertical lines give the ranges. A) WGA detection at the MUC5AC capture antibody. B) CEA. C) CA 19-9. D) MUC1.
The expression patterns of certain biomarkers were examined by Western blotting as a validation of the accuracy of the microarray measurements. Western blots detection the MUC5AC protein confirmed the protein levels detected by antibody microarray, and lectin blots of the same serum samples showed higher signal at overlapping bands, which supports the presence of particular glycans on MUC5AC (Fig. 4A). Other bands detected by the lectins that are not overlapping with the MUC5AC bands could be due to other proteins carrying the relevant glycan, or splice variants of MUC5AC. Western blots for CEA levels also confirmed the accuracy of the antibody microarray measurements for that protein (Fig. 4B).
Figure 4.

Comparisons of results from antibody microarrays to Western blots. A) Comparisons of MUC5AC levels. The antibody microarray results are represented by the column graphs for the indicated capture and detection antibodies and the indicated samples. The corresponding samples were separated by SDS-PAGE (with the lane order matching the column graphs), blotted, and probed using the indicated detection antibodies. Lysates from cell lines were analyzed in the right lanes. The region of the separations containing the molecular weights expected for MUC5AC are indicated by the blue boxes. B) Comparisons of CEA levels.
Complementary marker patterns
We examined the possibility of using combinations of two or more biomarkers to improve the accuracy of discriminating different patient groups relative to the individual biomarkers. A requirement for such an outcome is that the individual markers provide complementary information, which is suggested by the distinct patterns of markers of Figure 2. An effective method for testing the performance of combinations of markers is linear regression with forward selection31-34. This method was applied to the discrimination of mucin-producing cystic tumors (MCN + IPMN) from non-mucinous cystic lesions (SC + PC) using the entire data set. The method found that CA 19-9 and WGA-MUC5AC provide highly complementary information, with CA 19-9 identifying most of the MCNs, WGA-MUC5AC identifying most of the IPMNs, and neither showing frequent elevation in the non-mucinous cysts (Fig. 5A). Based on that relationship, a classification algorithm using both biomarkers gave an area-under-the-curve (AUC) in receiver-operator-characteristic (ROC) analysis of 0.91, and a sensitivity of 87% at 86% specificity. This performance was better than either WGA-MUC5AC (0.88 AUC, 78%/80% sensitivity/specificity) or CA 19-9 (0.79 AUC, 75%/80% sensitivity/specificity) used individually (Fig. 5B). The improvement was highly significant relative to CA 19-9 alone (p = 0.02 in the comparison of the markers) but not relative to WGA-MUC5AC alone, although the improvement may be significant using greater sample numbers. The combined marker performed significantly better than CEA (p < 0.001 in the comparison of the markers), which gave a 0.67 AUC and a 37%/80% sensitivity/specificity.
Figure 5.

Discriminating patient groups using individual and combined markers. A) Scatter plot comparison of two biomarkers. Each point represents a sample, with the color of each point indicating its class, according to the legend. The y-axis represents the level of CA19-9, and the x-axis represents the level of WGA-MUC5AC. The dashed lines are the thresholds used to dichotomize the samples for each marker. B) Receiver-operator characteristic (ROC) curves for the discrimination of mucin-producing cystic tumors (MCN and IPMN) from non-mucinous (SC and PC) cysts. The area-under-the-curve (AUC) and 95% confidence interval are indicated for CEA, WGA-MUC5AC, and the combination of WGA-MUC5AC and CA 19-9. For the combined biomarker, each sample was classified as mucin-producing if the level of either biomarker was above its threshold indicated by the dashed lines in panel A.
Discussion
The increased incidental detection of pancreatic cystic tumors presents a significant opportunity to reduce mortality from pancreatic cancer, since potentially life-threatening neoplasms could be removed prior to reaching an invasive stage. The key to capitalizing on that opportunity is the accurate differentiation of cystic lesions, so that the patients most likely to benefit from operative intervention can be optimally identified. The present work revealed significant differences between mucin-producing cystic tumors and non-mucinous cysts in the levels and glycan variants of MUC5AC, CEACAM6, MUC1, fibronectin, CEA, and CA 19-9. Certain markers performed better than CEA, and because of complementary patterns in some of the biomarkers, additional accuracy was achieved by using them in combination.
This work made use of a novel antibody-lectin sandwich array technology that allows convenient analysis of protein abundance and glycosylation in multiple biosamples. Affinity-based approaches such as this have the advantages of sensitively detecting analytes directly out of small volumes of complex mixtures with high reproducibility and high sample throughput35. The combination of antibody-based capture with lectin detection of glycan levels may be especially useful for pancreatic cancer biomarker discovery, since glycosylation alterations are a common feature of pancreatic cancers, and because glycan changes may occur more frequently or to a higher degree than changes in protein concentrations. This relationship was suggested in previous studies on serum proteins in pancreatic cancer by our group and others27-29, and seems to be the case here, since lectin detection of MUC5AC and CEACAM6 provided better performance than antibody detection of the core proteins (Table 3).
The fact that certain biomarkers were highly complementary resulted in improved performance when used in combination relative to their individual use. CA 19-9 was predominantly elevated in MCNs, while WGA-MUC5AC identified a higher proportion of IPMNs, resulting in an 87%/86% sensitivity/specificity when used together. Such performance may meet the requirements for identifying most patients at high risk for developing cancer while not admitting a high rate of false-positive identification. Larger sample sets will be required to validate how well these biomarkers can be used together to classify pancreatic cystic lesions. In addition, future studies will be needed to determine if glycosylation variants will be useful in distinguishing benign versus malignant mucin-producing neoplasms of the pancreas.
We observed that CEA was not elevated in serous cystadenomas but was elevated in a high proportion of pseudocysts. This distinction in CEA levels between these two types of benign cysts may result in improving the usefulness of CEA if the diagnosis of pseudocyst could be clearly discounted, which may be possible in some patients. Although previous studies did not specifically address the differential levels of CEA in PC and SC, it was suggested by a combined analysis of 12 studies that showed a higher median value in PC (10 ng/mL, n = 125) than in SC (3 ng/mL, n = 79)11. If pseudocysts were excluded in our analysis, the combination of CEA, which was elevated in most of the mucin-producing cystic tumors, and ECL-CEACAM6, which was elevated in the non-mucinous cysts, gave a sensitivity of 100% at 80% specificity. These biomarkers may be valuable when clinical or other information discounts the diagnosis of pseudocyst.
The binding specificities of the lectins utilized in this study can provide insight into the nature of the altered glycans. For example, the lectin Vicia villosa (VVL) has specificity for terminal galactosamine (GalNAc), and the increased binding of VVL on MUC5AC from mucin-producing cystic tumors may be due to truncation of O-glycans at the core GalNAc. GalNAc attached to the serine or threonine residue, referred to as the Tn antigen, has been frequently associated with pancreatic cancer and other cancers36-38. The Jacalin lectin, which also showed high binding to MUC5AC from mucin-producing cystic tumors, can bind the Tn antigen as well as the related T antigen (Galb1,3GalNAc), which also is strongly associated with cancer39. The lectin WGA binds N-acetlyglucosamine (GlcNAc) and other saccharides. Increased GlcNAc could be due to increased branching of O-glycans or N-glycans, resulting in increased extension of glycan chains through repeated lactosamine (Galβ1,4GlcNAcβ1,3) units. Both N-glycan branching40, 41 and O-glycan branching42 are associated with the formation of cancer-associated glycans such as the Lewis blood group structures42. The Lewis blood group structures are ligands for selectin receptors found on endothelial cells and lymphocytes 43, and increased presentation of this structure on pancreatic cells leads to increased metastasis 44-46 and reduced survival in pancreatic cancer 47, 48. The Erythrina cristagalli lectin (ECL), which showed high binding to both MUC5AC and CEACAM6 from mucinous cysts, also binds lactosamine, which is consistent with the results using WGA.
Therefore, it appears that we are observing both the truncation of certain O-glycans as well as increased chain extension on others, perhaps on N-glycans. Additional methods, such as enzymatic cleavage followed by chromatography and mass spectrometry, will be required to more fully characterize the structures associated with the different disease states, although the small volumes of cyst fluid available could make such a study challenging. Further characterization of the glycan structures associated with each disease state will be important for the development of standard reagents that could be used to calibrate clinical assays.
In summary, we have shown that certain mucin and CEA-family proteins and their glycan variants have potential as biomarkers for the accurate diagnosis of pancreatic cystic lesions. A biomarker panel based on the combination of CA 19-9 and WGA detection of captured MUC5AC discriminated mucin-producing cystic tumors from non-mucinous cysts with an 87% sensitivity and 86% specificity, significantly better than the performance of CEA. This study raises the possibility of more accurate diagnosis of pancreatic cystic lesions in order to optimally identify patients who will benefit from surgical intervention. The study also shows the value of measuring glycan variants on specific proteins for biomarker discovery and the usefulness of a low-volume, antibody-lectin sandwich array technology for performing such studies. Further studies of the markers presented here will be required to assess their suitability for clinical use.
Supplementary Material
Acknowledgements
We gratefully acknowledge support of this work by the National Institutes of Health (NCI R21 CA122890 and R33 CA122890 to B.B.H.; 1 R03 CA 112629-01A1 to C.M.S.; UO1 1CA117452), the Van Andel Research Institute, and University of Michigan Comprehensive Cancer Center. We thank Dr. Songming Chen for experimental assistance and Dr. Anna Lokshin (University of Pittsburgh) for helpful input.
Grant support: NCI (R21 CA122890 and R33 CA122890), to B.B.H. and T.Y.
Abbreviations
- AUC
area-under-the-curve
- CEA
carcinoembryonic antigen
- CEACAM
carcinoembryonic antigen-related call adhesion molecule
- IPMN
intraductal papillary mucinous neoplasm
- MCN
mucinous cystic neoplasm
- PBS
phosphate-buffered saline
- PC
Pseudocyst
- ROC
receiver-operator characteristic
- SC
serous cystadenoma
- WGA
wheat germ agglutinin
Footnotes
Disclosures: None
References
- 1.Sohn TA, Yeo CJ, Cameron JL, et al. Resected adenocarcinoma of the pancreas-616 patients: results, outcomes, and prognostic indicators. J Gastrointest Surg. 2000;4(6):567–79. doi: 10.1016/s1091-255x(00)80105-5. [DOI] [PubMed] [Google Scholar]
- 2.Singh M, Maitra A. Precursor lesions of pancreatic cancer: molecular pathology and clinical implications. Pancreatology. 2007;7(1):9–19. doi: 10.1159/000101873. [DOI] [PubMed] [Google Scholar]
- 3.Canto MI, Goggins M, Hruban RH, et al. Screening for early pancreatic neoplasia in high-risk individuals: a prospective controlled study. Clin Gastroenterol Hepatol. 2006;4(6):766–81. doi: 10.1016/j.cgh.2006.02.005. quiz 665. [DOI] [PubMed] [Google Scholar]
- 4.Wilentz RE, Albores-Saavedra J, Zahurak M, et al. Pathologic examination accurately predicts prognosis in mucinous cystic neoplasms of the pancreas. Am J Surg Pathol. 1999;23(11):1320–7. doi: 10.1097/00000478-199911000-00002. [DOI] [PubMed] [Google Scholar]
- 5.Hruban RH, Goggins M, Parsons J, et al. Progression model for pancreatic cancer. Clin Cancer Res. 2000;6(8):2969–72. [PubMed] [Google Scholar]
- 6.Hruban RH, Takaori K, Klimstra DS, et al. An illustrated consensus on the classification of pancreatic intraepithelial neoplasia and intraductal papillary mucinous neoplasms. Am J Surg Pathol. 2004;28(8):977–87. doi: 10.1097/01.pas.0000126675.59108.80. [DOI] [PubMed] [Google Scholar]
- 7.Adsay NV. Cystic lesions of the pancreas. Modern Pathology. 2007;20:S71–S93. doi: 10.1038/modpathol.3800706. [DOI] [PubMed] [Google Scholar]
- 8.Winter JM, Cameron JL, Lillemoe KD, et al. Periampullary and pancreatic incidentaloma: a single institution’s experience with an increasingly common diagnosis. Ann Surg. 2006;243(5):673–80. doi: 10.1097/01.sla.0000216763.27673.97. discussion 680-3. [DOI] [PMC free article] [PubMed] [Google Scholar]
- 9.Spinelli KS, Fromwiller TE, Daniel RA, et al. Cystic pancreatic neoplasms: observe or operate. Ann Surg. 2004;239(5):651–7. doi: 10.1097/01.sla.0000124299.57430.ce. discussion 657-9. [DOI] [PMC free article] [PubMed] [Google Scholar]
- 10.Brugge WR, Lewandrowski K, Lee-Lewandrowski E, et al. Diagnosis of pancreatic cystic neoplasms: a report of the cooperative pancreatic cyst study. Gastroenterology. 2004;126(5):1330–6. doi: 10.1053/j.gastro.2004.02.013. [DOI] [PubMed] [Google Scholar]
- 11.van der Waaij LA, van Dullemen HM, Porte RJ. Cyst fluid analysis in the differential diagnosis of pancreatic cystic lesions: a pooled analysis. Gastrointest Endosc. 2005;62(3):383–9. doi: 10.1016/s0016-5107(05)01581-6. [DOI] [PubMed] [Google Scholar]
- 12.Khalid A, McGrath KM, Zahid M, et al. The role of pancreatic cyst fluid molecular analysis in predicting cyst pathology. Clin Gastroenterol Hepatol. 2005;3(10):967–73. doi: 10.1016/s1542-3565(05)00409-x. [DOI] [PubMed] [Google Scholar]
- 13.Raty S, Sand J, Alfthan H, et al. Cyst fluid tumor-associated trypsin inhibitor may be helpful in the differentiation of cystic pancreatic lesions. J Gastrointest Surg. 2004;8(5):569–74. doi: 10.1016/j.gassur.2004.01.005. [DOI] [PubMed] [Google Scholar]
- 14.Shami VM, Sundaram V, Stelow EB, et al. The level of carcinoembryonic antigen and the presence of mucin as predictors of cystic pancreatic mucinous neoplasia. Pancreas. 2007;34(4):466–9. doi: 10.1097/mpa.0b013e318033fa12. [DOI] [PubMed] [Google Scholar]
- 15.Hammel PR, Forgue-Lafitte ME, Levy P, et al. Detection of gastric mucins (M1 antigens) in cyst fluid for the diagnosis of cystic lesions of the pancreas. Int J Cancer. 1997;74(3):286–90. doi: 10.1002/(sici)1097-0215(19970620)74:3<286::aid-ijc9>3.0.co;2-v. [DOI] [PubMed] [Google Scholar]
- 16.Anderson MA, Kwon RS, Scheiman JM. PANDA cyst fluid analysis: eats, shoots and leaves? Gastrointest Endosc. 2009 doi: 10.1016/j.gie.2008.10.034. (in press) [DOI] [PubMed] [Google Scholar]
- 17.Burdick MD, Harris A, Reid CJ, et al. Oligosaccharides expressed on MUC1 produced by pancreatic and colon tumor cell lines. J Biol Chem. 1997;272(39):24198–202. doi: 10.1074/jbc.272.39.24198. [DOI] [PubMed] [Google Scholar]
- 18.Moniaux N, Andrianifahanana M, Brand RE, et al. Multiple roles of mucins in pancreatic cancer, a lethal and challenging malignancy. Br J Cancer. 2004;91(9):1633–8. doi: 10.1038/sj.bjc.6602163. [DOI] [PMC free article] [PubMed] [Google Scholar]
- 19.Hollingsworth MA, Swanson BJ. Mucins in cancer: protection and control of the cell surface. Nat Rev Cancer. 2004;4(1):45–60. doi: 10.1038/nrc1251. [DOI] [PubMed] [Google Scholar]
- 20.Dennis JW, Granovsky M, Warren CE. Glycoprotein glycosylation and cancer progression. Biochim Biophys Acta. 1999;1473(1):21–34. doi: 10.1016/s0304-4165(99)00167-1. [DOI] [PubMed] [Google Scholar]
- 21.Thompson S, Cantwell BM, Cornell C, et al. Abnormally-fucosylated haptoglobin: a cancer marker for tumour burden but not gross liver metastasis. Br J Cancer. 1991;64(2):386–90. doi: 10.1038/bjc.1991.314. [DOI] [PMC free article] [PubMed] [Google Scholar]
- 22.Okuyama N, Ide Y, Nakano M, et al. Fucosylated haptoglobin is a novel marker for pancreatic cancer: A detailed analysis of the oligosaccharide structure and a possible mechanism for fucosylation. Int J Cancer. 2005 doi: 10.1002/ijc.21728. [DOI] [PubMed] [Google Scholar]
- 23.Miyoshi E, Nakano M. Fucosylated haptoglobin is a novel marker for pancreatic cancer: detailed analyses of oligosaccharide structures. Proteomics. 2008;8(16):3257–62. doi: 10.1002/pmic.200800046. [DOI] [PubMed] [Google Scholar]
- 24.Thompson S, Guthrie D, Turner GA. Fucosylated forms of alpha-1-antitrypsin that predict unresponsiveness to chemotherapy in ovarian cancer. Br J Cancer. 1988;58(5):589–93. doi: 10.1038/bjc.1988.265. [DOI] [PMC free article] [PubMed] [Google Scholar]
- 25.Mita Y, Aoyagi Y, Suda T, et al. Plasma fucosyltransferase activity in patients with hepatocellular carcinoma, with special reference to correlation with fucosylated species of alpha-fetoprotein. J Hepatol. 2000;32(6):946–54. doi: 10.1016/s0168-8278(00)80099-9. [DOI] [PubMed] [Google Scholar]
- 26.Naitoh A, Aoyagi Y, Asakura H. Highly enhanced fucosylation of serum glycoproteins in patients with hepatocellular carcinoma. J Gastroenterol Hepatol. 1999;14(5):436–45. doi: 10.1046/j.1440-1746.1999.01882.x. [DOI] [PubMed] [Google Scholar]
- 27.Li C, Simeone DM, Brenner DE, et al. Pancreatic Cancer Serum Detection Using a Lectin/Glyco-Antibody Array Method. J Proteome Res. 2008 doi: 10.1021/pr8007013. [DOI] [PMC free article] [PubMed] [Google Scholar]
- 28.Zhao J, Patwa TH, Qiu W, et al. Glycoprotein microarrays with multi-lectin detection: unique lectin binding patterns as a tool for classifying normal, chronic pancreatitis and pancreatic cancer sera. J Proteome Res. 2007;6(5):1864–74. doi: 10.1021/pr070062p. [DOI] [PubMed] [Google Scholar]
- 29.Chen S, LaRoche T, Hamelinck D, et al. Multiplexed analysis of glycan variation on native proteins captured by antibody microarrays. Nat Methods. 2007;4(5):437–44. doi: 10.1038/nmeth1035. [DOI] [PubMed] [Google Scholar]
- 30.Chen S, Haab BB. Antibody Microarrays for Protein and Glycan Detection. In: Van Eyk J, Dunn M, editors. Clinical Proteomics. Wiley, VCH; Weinheim, Germany: 2007. [Google Scholar]
- 31.Orchekowski R, Hamelinck D, Li L, et al. Antibody microarray profiling reveals individual and combined serum proteins associated with pancreatic cancer. Cancer Res. 2005;65(23):11193–202. doi: 10.1158/0008-5472.CAN-05-1436. [DOI] [PubMed] [Google Scholar]
- 32.Duh MS, Walker AM, Pagano M, et al. Prediction and cross-validation of neural networks versus logistic regression: using hepatic disorders as an example. Am J Epidemiol. 1998;147(4):407–13. doi: 10.1093/oxfordjournals.aje.a009464. [DOI] [PubMed] [Google Scholar]
- 33.Hastie T, Tibshirani R, Friedman J. The Elements of Statistical Learning: Data Mining, Inference, and Prediction. Springer; New York: 2001. [Google Scholar]
- 34.Thall P, Simon R, Grier D. Test-based variable selection via cross-validation. Journal of Computational and Graphical Statistics. 1992;1:41–61. [Google Scholar]
- 35.Forrester S, Kuick R, Hung KE, et al. Low-volume, high-throughput sandwich immunoassays for profiling plasma proteins in mice: identification of early-stage systemic inflammation in a mouse model of intestinal cancer. Molecular Oncology. 2007;1:216–225. doi: 10.1016/j.molonc.2007.06.001. [DOI] [PMC free article] [PubMed] [Google Scholar]
- 36.Springer GF. Immunoreactive T and Tn epitopes in cancer diagnosis, prognosis, and immunotherapy. J Mol Med. 1997;75(8):594–602. doi: 10.1007/s001090050144. [DOI] [PubMed] [Google Scholar]
- 37.Brockhausen I. Mucin-type O-glycans in human colon and breast cancer: glycodynamics and functions. EMBO Rep. 2006;7(6):599–604. doi: 10.1038/sj.embor.7400705. [DOI] [PMC free article] [PubMed] [Google Scholar]
- 38.Schuessler MH, Pintado S, Welt S, et al. Blood group and blood-group-related antigens in normal pancreas and pancreas cancer: enhanced expression of precursor type 1, Tn and sialyl-Tn in pancreas cancer. Int J Cancer. 1991;47(2):180–7. doi: 10.1002/ijc.2910470204. [DOI] [PubMed] [Google Scholar]
- 39.Yu LG. The oncofetal Thomsen-Friedenreich carbohydrate antigen in cancer progression. Glycoconj J. 2007;24(8):411–20. doi: 10.1007/s10719-007-9034-3. [DOI] [PubMed] [Google Scholar]
- 40.Kobata A, Amano J. Altered glycosylation of proteins produced by malignant cells, and application for the diagnosis and immunotherapy of tumours. Immunol Cell Biol. 2005;83(4):429–39. doi: 10.1111/j.1440-1711.2005.01351.x. [DOI] [PubMed] [Google Scholar]
- 41.Saito H, Nishikawa A, Gu J, et al. cDNA cloning and chromosomal mapping of human N-acetylglucosaminyltransferase V+ Biochem Biophys Res Commun. 1994;198(1):318–27. doi: 10.1006/bbrc.1994.1045. [DOI] [PubMed] [Google Scholar]
- 42.Shimodaira K, Nakayama J, Nakamura N, et al. Carcinoma-associated expression of core 2 beta-1,6-N-acetylglucosaminyltransferase gene in human colorectal cancer: role of O-glycans in tumor progression. Cancer Res. 1997;57(23):5201–6. [PubMed] [Google Scholar]
- 43.McEver RP. Selectin-carbohydrate interactions during inflammation and metastasis. Glycoconj J. 1997;14(5):585–91. doi: 10.1023/a:1018584425879. [DOI] [PubMed] [Google Scholar]
- 44.Kishimoto T, Ishikura H, Kimura C, et al. Phenotypes correlating to metastatic properties of pancreas adenocarcinoma in vivo: the importance of surface sialyl Lewis(a) antigen. Int J Cancer. 1996;69(4):290–4. doi: 10.1002/(SICI)1097-0215(19960822)69:4<290::AID-IJC9>3.0.CO;2-S. [DOI] [PubMed] [Google Scholar]
- 45.Iwai K, Ishikura H, Kaji M, et al. Importance of E-selectin (ELAM-1) and sialyl Lewis(a) in the adhesion of pancreatic carcinoma cells to activated endothelium. Int J Cancer. 1993;54(6):972–7. doi: 10.1002/ijc.2910540618. [DOI] [PubMed] [Google Scholar]
- 46.Kawarada Y, Ishikura H, Kishimoto T, et al. The role of sialylated Lewis antigens on hematogenous metastases of human pancreas carcinoma cell lines in vivo. Pathol Res Pract. 2000;196(4):259–63. doi: 10.1016/s0344-0338(00)80075-8. [DOI] [PubMed] [Google Scholar]
- 47.Ferrone CR, Finkelstein DM, Thayer SP, et al. Perioperative CA19-9 levels can predict stage and survival in patients with resectable pancreatic adenocarcinoma. J Clin Oncol. 2006;24(18):2897–902. doi: 10.1200/JCO.2005.05.3934. [DOI] [PMC free article] [PubMed] [Google Scholar]
- 48.Takahashi S, Oda T, Hasebe T, et al. Overexpression of sialyl Lewis × antigen is associated with formation of extratumoral venous invasion and predicts postoperative development of massive hepatic metastasis in cases with pancreatic ductal adenocarcinoma. Pathobiology. 2001;69(3):127–35. doi: 10.1159/000048767. [DOI] [PubMed] [Google Scholar]
Associated Data
This section collects any data citations, data availability statements, or supplementary materials included in this article.