

Abstract
Although the gross somatotopic organization of the posterior bank of the precentral gyrus is well established, a fine scale organization of the representations of the digits of the hand has not been fully characterized. Previous neuroimaging studies have failed to find clear evidence for a specificity of digit representations in motor cortex, but rather report a distributed network of control. Reported here are the results of two experiments; in Experiment 1 a sequential finger tapping task produced strong blood oxygen level dependent (BOLD) responses in the contralateral precentral gyrus, but there was a lack of specificity for distinguishing individual representations. A randomly ordered task did accomplish this goal. In the second experiment, a randomly ordered finger‐tapping task was used and the findings demonstrated BOLD responses in clusters of voxels specific to movement of a single digit. The region of interest defined for each digit comprised several noncontiguous clusters. A “selectivity index” was developed to quantify the magnitude of the BOLD response to the movement of a specific digit, relative to BOLD response associated with movement of other digits. Strong evidence of BOLD selectivity (albeit not exclusivity) was found in the hemisphere contralateral to the cued digit; however, there was no evidence for an orderly spatial topography. These findings demonstrate that a selectivity of activation is quantifiable, supports a theory of noncontiguous distribution of control, and provides a method for comparing between healthy and impaired populations and investigating changes following training or intervention. Hum Brain Mapp, 2011. © 2011 Wiley‐Liss, Inc.
Keywords: fMRI, primary motor cortex, finger tapping, somatotopy, neuroimaging
INTRODUCTION
The primary motor (M1) and somatosensory (S1) cortex, as well as other cortical and subcortical regions of the brain, are known to exhibit an anatomically defined regional specificity referred to as somatotopic organization. The somatotopy of gross movement or sensory representations has long historical roots and is uncontested [Ferrier,1875; Fritsch and Hitzig,1870; Penfield and Boldrey,1937]. Localized cortical activation within M1 that is correlated with specific volitional movements suggests that unique anatomical areas may be primarily responsible for individual joint movement, such as the fingers. However, the degree to which, or even if, fine movement is somatotopically distributed and controlled within a given region is an issue that is currently unresolved.
Because of many neuroanatomical constraints on the nervous system, large degrees of overlap between anatomically defined cortical areas exist [for review, Schieber,2001]. One explanation for this overlap is the within‐limb somatotopic organization that appears to be largely related to the functional constraints of the distal motor system [Lotze et al.,2000; Schieber,1999; Schieber and Hibbard,1993]. That is to say, most movements that require activation of the wrist also require control of the elbow of the same limb. Anatomical limitations on regional independence also exist. For example, it has been well documented that individual fingers are controlled by a network of overlapping musculature [for review, Lemon,1999]. Additionally, most natural motions of the fingers require that multiple digits move together. This coupling of digit motor control requires an interconnecting network of related digits rather than individuated control of single fingers, thus placing constraints on the degrees of freedom necessary for functional control [for review, see Schieber and Santello,2004]. These constraints bring into question the degree to which any discrete somatotopic organization of fine motor systems within M1 could occur.
In contrast, it has been argued that while overlap of the cortically defined regions does exists and is necessary for multijoint coordination, regions of individuated movement control are also present and allow for individuated, functional, fine motor control [Dechent and Frahm,2003; Devanne et al.,2006; Lotze et al.,2000; Plow et al.,2010]. This is particularly evident in the hand region of the cortex, where widespread cortical activation in response to movement of individual digits has suggested that movement of any one finger is mediated by the activity of neurons widely distributed in the M1 upper extremity representation [Dechent and Frahm,2003; Devanne et al.,2006; Sanes et al.,1995; Schieber and Hibbard,1993]. Despite this evidence of overlapping digit representations, difference images that subtract away the shared component of activation from neuroimaging data have shown that peak activation in response to first digit (D1, thumb) movement is lateral to the site of peak activation during fifth digit (D5) movement. This pattern matches the traditional homunculus [Grafton et al.,1993; Kleinschmidt et al.,1997]. Dechent and Frahm [2003] used high resolution functional magnetic resonance imaging (fMRI) to investigate the finger somatotopy in the human M1 hand area of the dominant hand. Their results indicate that distinct somatotopy was evident through mean center‐of‐mass coordinates of individual digit representations when averaged across subjects, but that individual digit representations share a common area through a distributed network.
These pieces of evidence have helped formulate a contemporary idea of the representational organization called “functional somatotopy” [Dechent and Frahm,2003; Devanne et al.,2006]. Functional somatotopy suggests that overlap exists between adjacent representations of the segments to create a functional synergy that aides coordinated use of those segments. However, individual representations still maintain discrete optimal points for allowing individuated use of the segments outside the synergy. Indeed, it has been found that the amplitude and extent of activation during single digit movement is larger than during two‐digit movements [Kitamura et al.,1993; Remy et al.,1994], suggesting an efficiency of motor control during more functionally relevant movements. Thus, we hypothesized that individual digit movements selectively activate unique (albeit interdigitated) regions of the cortex and that blood oxygen level dependent (BOLD) signal can be used to quantify the degree of selectivity to one digit movement and the relationship of that cortical region to the movement of other digits. With this method of investigation, the relative specificity of function of a cortical region can be measured and compared.
The quantification of discrete body segment representation within a person or group may have relevance in clinical or interventional investigations. Indeed, the issue of movement individuation has significant clinical importance regarding stroke recovery [Lang et al.,2007] and focal hand dystonia [Bara‐Jiminez et al.,1998; Blake et al.,2002; Butterworth et al.,2003; Byl et al.,1996; Elbert et al.,1998], and may be of importance in movement or learning experiments in healthy or impaired populations.
An organization analogous to somatotopy is found in early visual cortex, where objects close to each other in visual space have neighboring cortical representations. Visual cortical organization (retinotopy) has been mapped with good success using a traveling wave approach: neighboring regions of the visual field are stimulated sequentially, and this results in sequential stimulation of neighboring regions of cortex [Engel et al.,1997; Wandell et al.,2005]. The contributions of large veins that pool deoxygenated blood from neighboring regions are minimized by this orderly progression of stimulus across the cortical surface, and a Fourier analysis [Bandettini et al.,1993] detects regions of cortex responding in phase with stimulation of a particular region of the visual field. By analogy, therefore, a sequential finger‐tapping task might be expected to provide high‐quality maps of motor cortex. Indeed, this technique has recently been used successfully in somatosensory cortex [Sanchez‐Panchuelo et al.,2010]. However, if cortical finger representations are dispersed, rather than arranged in a relative continuum, the traveling wave approach may offer no advantages over a random pattern of digit motion. Additionally, the ability to anticipate the next movement in a sequential pattern may generate a different signal than a random task.
In this study, the term cortical selectivity was used to describe the magnitude of the BOLD response to the movement of a specific digit relative to motion of other digits. Given previous studies of digit representations in M1, our hypothesis presupposes that there is not isolated control of a digit within the precentral gyrus, that is, no region of cortex is active only during motion of a single digit. Thus, in Experiment 1, we monitored the BOLD response to both sequential and randomly ordered digit movement. In Experiment 2, a random‐order finger tapping task was used to prove novel, high‐resolution evidence for the interdigitation of highly selective individual digit representations in the human primary motor cortex. The task in Experiment 2 provided the opportunity to develop a selectivity index (SI) that measures the degree to which a single digit dominates the regions of cortex most strongly modulated by the motion of other digits. The null hypothesis was that all activated areas are equally associated with all digit movements on a given hand.
Therefore, the goal of the present study was to develop a method of visualization and quantification of the specificity of cortical activation during individual finger movements in healthy subjects in fMRI at 3T. This work will allow a better understanding of degree of “preference” for cortical control of a digit, and the relative association one region has for all digits of the hand. Future work may allow the application of these techniques in an impaired population to allow for quantification of change secondary to treatment, disease progression, or as a diagnostic tool.
METHODS
Experiment 1
Subjects
Four healthy individuals (three females, mean age 32.5 ± 4.6 years) with no history of neurologic or orthopedic conditions participated in Experiment 1. The nature of the experimental procedures were explained and written informed consent was given from all participants prior to participation according to the Declaration of Helsinki and the experimental protocols, which were approved by the Institutional Review Board at the University of Minnesota, conformed to safety guidelines for MRI research.
Task
Participants were cued to tap each finger by visual presentation of a picture of a hand with one finger colored green. Subjects' hands were propped in a custom designed splint with neutral wrist position and relaxed finger placement. The subjects tapped against the splint. Stimuli were presented with Matlab (Mathworks, Natick, MA) using the Psychtoolbox extensions [Brainard,1997; Pelli,1997]. Before beginning the experiment, participants were allowed ample time to familiarize themselves with the task. Each individual was instructed to tap the cued finger, but not the adjacent fingers, at their own pace (∼ 2 Hz) for the entire time the stimulus was present. Participants practiced the tapping outside of the scanner with the cueing mechanism until they were comfortable with the task, and until the experimenters felt the task was being completed correctly with no accessory movement. During the actual fMRI scans, stimuli were projected onto a screen behind the participants' heads (Sony projector with custom lens made by Navitar) and were viewed via a mirror mounted on the head coil. Each cueing image was presented for 3 s.
For the sequential task, the tapping cues (images with a green finger) were presented in adjacent finger order. For the Forward sequence, subjects started with D5L (the fifth digit of the left hand) followed by D4L, D3L and so on through D1L and then to D1R of the right hand, and on to D5R. Tapping of D5L was cued immediately after subjects finished tapping D5R of the right hand. The full cycle for both hands (D5L to D5R) took 30 s (3 s per digit) and was repeated 10 times per scan. The Reverse sequence was the reverse of Forward sequence such that participants started on D5R and finished on D5L and was performed during a separate scan.
For the random‐order task, fingers were cued in a pseudo‐random order, in blocks of 10. During the first 30 s of the scan, each of the 10 digits was cued once, in random order; during the next 30 s each of the 10 digits was cued once, in a different random order, and so forth. By chance, the same digit was occasionally cued for a total of 6 s, spanning the end of one 30 s block and the beginning of the next. Different cueing sequences were used for the two repetitions of the random‐order scans (Fig. 1).
Figure 1.
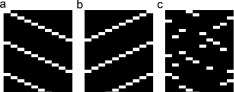
Experiment 1: Design for sequential and random‐order tasks. Subjects were cued to tap a specific finger using a visual cue with one digit colored green. The design for the three types of scan: (a) Forward sequence, with left D5 first, (b) Reverse sequence with right D5 first, (c) Random. Time is on the vertical axis (26 of 100 events are illustrated, TR = 3 s) and digit is on the horizontal axis.
MRI systems
The 3 T magnet (Magnex Scientific, UK) was equipped with a Siemens console (Erlangen, Germany) and a Siemens Avanto body gradient set capable of 45 mT/m and a maximum slew rate of 200 T/m/s. An eight channel receive‐only coil was used for data acquisition.
fMRI data acquisition
For Experiment 1, gradient‐recalled EPI data (T2*‐weighted images) were acquired at a rate of one volume every 3 s. Field of view was 192 mm × 192 mm with a matrix size of 128 × 128 (6/8 partial Fourier) for a nominal in‐plane resolution of 1.5‐mm isotropic. Slice thickness was 1.5 mm; 36 slices were prescribed parallel to the central sulcus in an oblique coronal orientation to cover primary motor cortex. Echo‐spacing was 0.69 ms (read‐out time for one line) and echo time (TE) was 30 ms. All MRI parameters were the same for the sequential and random‐order tasks within Experiment 1.
Cortical segmentation, inflation, and flattening
Gray/white matter segmentation, cortical surface reconstruction, and surface inflation and flattening were completed in SurfRelax [Larsson,2001]. Segmentation along the central sulcus was manually inspected and edited to ensure accuracy of the definition of gray and white matter on both banks of the precentral gyrus.
fMRI data preprocessing
Within‐ and between‐scan motion in functional scans was corrected using FSL's mcFLIRT (http://www.fmrib.ox.ac.uk/fsl/). After motion compensation, fieldmap‐based distortion compensation for the EPI images was completed using FSL.
fMRI data analysis
For the random‐order tasks, hemodynamic response functions (HRFs) corresponding to the tapping of each digit were estimated for each voxel using custom Matlab code, which fit a canonical HRF (spm_hrf.m, http://www.fil.ion.ucl.ac.uk/spm/software/spm5/) to the BOLD data using a least‐squares solution. For the sequential‐order task, a Fourier analysis calculated voxel coherence (unsigned correlation with a sinusoid at the movement‐related frequency of 10 cycles/scan).
For both tasks, data from multiple scans were combined to improve the robustness of BOLD response estimation, but different approaches were used to combine data for the sequential and random tasks. To combine the sequential tapping scans, data from the Forward and Backward tasks were shifted 6 s to partially compensate for the hemodynamic delay, then the backward‐order task was time‐reversed [time series data were rewritten so the last (shifted) time point came first and the first (shifted) time point came last], and finally both scans were averaged. For the random‐order task, in which a different cueing sequence was used for the two scans within a subject, data from the two scans were concatenated and a single response amplitude was estimated from both scans.
For all analyses (on individual scans as well as on averaged/combined scans), significance was estimated for each voxel using a permutation analysis [Nichols and Holmes,2002]. The time‐points in each (individual, average, or concatenated) scan were scrambled 1,000 times and the same model was used to estimate a null distribution for the correlation between the modeled BOLD response and actual data (random‐order scans) or coherence (sequential‐order scans).
Significantly modulated voxels were assigned to a single digit using a winner‐take‐all algorithm. For the random‐order task, each voxel was assigned to the digit with the highest positive BOLD response amplitude. For the sequential‐order task, the phase of the movement‐related Fourier component, based on the timing of the BOLD response in a given voxel, was assigned to 1 of 10 bins (representing each digit) of equal width covering the full range of phase values (0–2π).
RESULTS
Experiment 1
We first compared the sensitivity of the two experiment designs: sequential‐order finger tapping and random‐order finger tapping. In individual scans, an average of 70% more voxels were significantly modulated in the sequential‐order finger tapping task (741 ± 291, mean ± standard deviation) as in the random‐order finger tapping task (406 ± 234). BOLD activation during the sequential task (Fourier analysis) and random‐order task (standard GLM analysis) are shown in Figure 2a,b for a single scan in a representative subject (sequential: top; random: bottom). Activation maps for the same subject are shown for each task (average of two scans) in Figure 2c on a flattened cortical surface. In all activation maps shown in Figure 2, the expected contralateral organization of each hand was evident with both techniques. In a comparison between tasks, the sequential task generated a greater volume of activation. However, digit individuation was apparently poor in the sequential task, as the maps for all subjects were dominated by a few fingers (i.e., dark blue, representing D2R in the left hemisphere and orange, representing D4L in the right hemisphere), rather than distributed between all five contralateral digits in each hemisphere. By contrast, the activation maps generated by the random‐order task, while weak, showed responses distributed more evenly between the digits of each hand.
Figure 2.
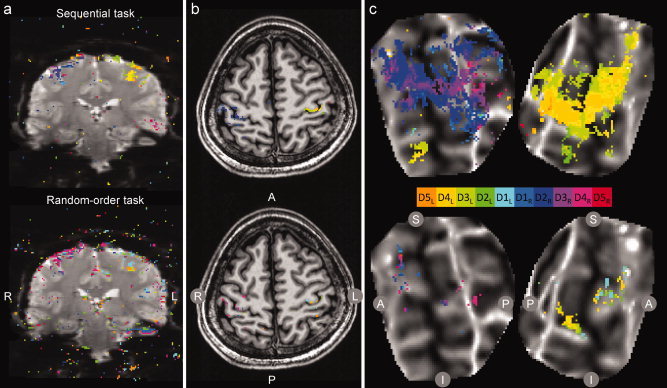
Experiment 1: BOLD activation during sequential and random‐order tasks. Significantly modulated voxels (P < 0.01) in response to cued digit movement are displayed as a color overlay on (a) EPI images, (b) the reference anatomy, and (c) flattened cortical patches. Top: sequential task; bottom: random task. Activation for each voxel was assigned to a digit according to a winner‐take‐all algorithm; significance was estimated for each voxel by permutation analysis. In (a) and (b), data from a single scan are shown (R: right hemisphere; L: left; A: anterior; P: posterior). In (c) data from the average of two scans in a single subject are shown on a flattened cortical patch centered on the central sulcus (dark gray indicates strong negative curvature at the fundus of the sulcus; S: superior; I: inferior). Note the contralateral activation of the hand in the precentral gyrus in both the top and bottom images, but the lack of differentiation between digits in the top image. [Color figure can be viewed in the online issue, which is available at wileyonlinelibrary.com.]
To quantify digit individuation in the two tasks we calculated, for each subject, the percent of the total active voxels in each hemisphere that responded in phase with (Fourier analysis, sequential task) or most strongly to (GLM analysis, random‐order task) the motion of each contralateral digit. Figure 3 shows the average percentage of voxels assigned to each digit in each hemisphere of each subject. In the sequential task, the Fourier analysis failed to distinguish individual digits; the data were instead dominated by BOLD responses that peaked near the middle of the time during which the digits of a given hand were being cued. The random sequence task, while generating weaker BOLD responses, showed a more even distribution of voxels assigned to each digit of each hand.
Figure 3.
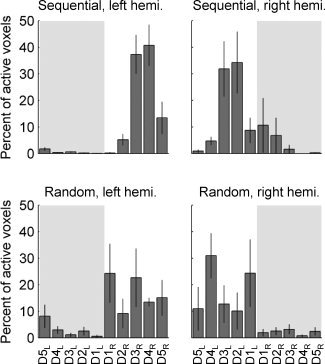
Experiment 1: Distribution of activated voxels within the entire area of interest. Sequential (top) and random (bottom) order task, left hemisphere (left column) and right hemisphere (right column). The histogram represents the percent of all active voxels assigned to each digit (mean ± SE, n = 4 subjects). In the random‐order task, both hemispheres demonstrate more even distribution of voxels assigned to digits of the contralateral hand. Shaded background indicates response from digits ipsilateral to the labeled hemisphere.
DISCUSSION
Experiment 1
The primary finding of this experiment was that an unpredictable (random) task sequence better revealed individuation of digit representations on the anterior bank of the central sulcus than a sequential task. Here we will briefly consider three explanations for the fact that the sequential task did not reveal individual digit representations in motor cortex.
First, the sequential task could have failed to reveal individual digit representations due to the more automated or predictable nature of tapping of fingers in a sequential order. Previous studies have indicated a direct relationship between cortical activation and attentional demand or task difficulty [Mitchell,2010; Richter et al.,2009]. Correspondingly, the sequential task may address individual digits only as part of a larger hand pattern, while the randomly cued task may produce greater attention to individual digits. Similarly, because of the simplicity of the sequential pattern, anticipation of the motion of all digits, or even rehearsal, may result in continuous activation of each digit representation, making it impossible to separate individual finger representations.
Second, the larger signal generated from the sequential task may have resulted in saturation of the BOLD signal and masked the underlying, spatially selective signals revealed by the random‐order task. In spite of the theoretically less‐efficient experimental design [Dale,1999], the sequential task produced larger BOLD responses than the random‐order task. It is an intriguing subject for future experiments to understand whether there is an interaction between the sequential experiment design and the motor signals generated by learned patterns (as discussed above). That is, how are large‐scale patterns reflected in M1, and how are the large responses that are not digit‐selective combined with weaker digit‐selective responses? Within the scope of the current experiment, however, we can only say that the unpredictable (random order) task does not generate the same large, nonselective response as the sequential task and therefore has better sensitivity for studying the smaller, digit‐selective response.
Finally, a possible conclusion is that the sequential task is not appropriate for studying motor cortex because the cortical representation of neighboring digits is not spatially ordered to the same degree that retinotopic visual cortex is spatially ordered. The sequential task was initially selected to measure cortical organization because, if digits are represented in an orderly fashion in M1, sequential stimulation of neighboring cortical areas should eliminate nonspecific BOLD modulation in large veins that drain neighboring cortical territories and unmask the more spatially selective small vein signal. However, this effect was not observed, from which we conclude that the analogy to retinotopic mapping, while apparently useful for somatosensory cortex [Sanchez‐Panchuelo et al.,2010], is not appropriate for motor cortex.
From Experiment 1, we concluded that the more extensive activation in the sequential task contained a significant contribution of nonspecific BOLD responses that worked in opposition to the task of detection of digit specialization. The representation of digits in the random‐order task suggested a greater ability to determine the organization of individual digit representations in motor cortex. We therefore performed a second experiment using only the random‐order finger tapping task.
In addition to the finger tapping order, other modifications were included to optimize Experiment 2. Three 5‐min scans per subject, all using the same pseudorandom order, were collected and voxel size was increased to 2 mm (isotropic) to improve SNR over the first experiment.
METHODS
Experiment 2
Subjects
Eight healthy individuals (four females, mean age 30.3 ± 5.59) with no history of neurologic or orthopedic conditions participated in Experiment 2. The nature of the experimental procedures were explained and written informed consent was given from all participants prior to participation according to the Declaration of Helsinki and the experimental protocols, which were approved by the Institutional Review Board at the University of Minnesota, conformed to safety guidelines for MRI research.
Task
The task for Experiment 2 was similar to Experiment 1 with two exceptions. First, the hand position remained the same, but in Experiment 2, a custom‐modified MR‐compatible keyboard was used to record finger movements and verify that subjects were exclusively moving the cued digit. Lack of correct finger movement (less than 95% accuracy) resulted in removing that scan from analysis. Second, with regard to the order the fingers were cued, the same random order was used for all scans. That is, the same pseudorandomly assigned cueing order was used for all scanning sessions across all participants.
fMRI data acquisition
For Experiment 2, gradient‐recalled EPI data were acquired at a rate of one volume every 3 s. Field of view was 256 mm × 192 mm with a matrix size of 128 × 96 (6/8 partial Fourier acquisition) for a nominal in‐plane resolution of 2‐mm isotropic. Slice thickness was 2 mm; 36 slices were prescribed parallel to the central sulcus in an oblique coronal orientation to cover primary sensory premotor and motor cortex. Echo‐spacing was 0.69 ms (read‐out time for one line) and TE was 30 ms.
Cortical segmentation, inflation, and flattening
Gray/white matter segmentation was performed as in Experiment 1.
fMRI data analysis: Preprocessing and analysis
For data from Experiment 2, slice‐time correction was applied before motion compensation and distortion compensation (FSL). High‐pass temporal filtering and intensity‐based alignment of functional data to the reference anatomy [Nestares and Heeger,2000] were accomplished with custom Matlab code.
The same tapping order was cued for all scans, so all acceptable scans were averaged before using the GLM to estimate a hemodynamic response (in the average scan) to the motion of each digit. For each subject, the one averaged response was used for all subsequent calculations. Significance was estimated for each voxel using a permutation analysis, as in Experiment 1. Significantly modulated voxels were assigned to a single digit using a winner‐take‐all algorithm.
ROIs representing each digit were defined in the functional data space as the collection of all voxels predominantly associated with a given digit movement. For example, ROID1_L comprises all significantly modulated voxels (P < 0.01) on the anterior bank of the central sulcus that produced a stronger BOLD response during movement of D1L than to any other digit. Contiguity was not required in the ROIs. In each hemisphere, there were thus five ROIs defined by movement of the contralateral five digits.
A SI was calculated for each subject to represent the selectivity of the BOLD response in each ROI during the motion of different digits. The SI for a given digit, D, in a given ROI, R, is defined as
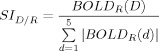 |
where BOLD() indicates the magnitude of the BOLD response during digit tapping and the sum in the denominator includes all the digits on the same hand as the selected digit, D. For example, SD1R/ROI_D1R is the selectivity for motion of the right thumb (D1R) in the (left hemisphere) ROID1_R and is equal to the BOLD response in ROID1_R during motion of D1R divided by the sum of all positive BOLD responses in ROID1_R during motion of all digits of the right hand (including D1R).
Both contralateral and ipsilateral selectivity indices were calculated for each subject and then averaged. One contralateral SI was calculated for each ROI using the digit used to define the ROI in the numerator (i.e., SD1R/ROI_D1R, SD2R/ROI_D2R, etc.). Because the ROI selection criterion was a positive BOLD response to the defining digit that was larger than all other BOLD responses, the minimum SI was 0.2, which would indicate no selectivity, that is, the BOLD responses to all five contralateral digits had equal magnitude. The maximum SI was 1. Negative BOLD responses were excluded from the denominator (i.e., set to 0) when calculating the contralateral SIs. For ipsilateral selectivity indices, SI was calculated for the digit opposite the digit used to define the ROI, for example, SD1L/ROI_D1R was equal to BOLD (D1L) divided by the sum of the absolute values of the BOLD responses to all digits on the left hand. Ipsilateral SIs could therefore take any value between −1 and 1, although there was a tendency for ipsilateral BOLD responses to be negative, resulting in negative ipsilateral SIs.
Quantification of finger representations on the flattened cortical surface
Two parameters were transformed to the cortical surface: the correlation between the estimated model (BOLD response amplitude during the movement of each digit) and the data, as well as the digit assigned to a voxel using a winner‐take‐all (highest positive BOLD response amplitude) algorithm. Transformation from the functional data space was accomplished by nearest neighbor interpolation of the functional data to the space of the reference anatomy from which the cortical surface was defined (1‐mm isotropic resolution), and then the responses were averaged through the cortical depth to project them to the white matter surface. The cortical surfaces were sampled at ∼ 1 mm resolution, with some variability due to distortion during the cortical surface inflation and flattening. Two‐dimensional maps therefore consisted of pixels assigned the value 1–10 (rounded back to integer values after being sampled from the functional data space to the surface representation), representing the 10 digits, and corresponding correlation values.
After applying an uncorrected, single‐voxel significance threshold of P < 0.01, clusters of voxels representing each finger were identified in the flat maps by using Matlab's bwlabel function to identify all separate clusters for each digit. Clusters of fewer than 4 pixels (4 mm2 on the cortical surface) were eliminated. Because partial volume effects distort the data in the transformation, the single‐voxel significance threshold applied to data visualized on the cortical surface was the average of the correlation thresholds estimated for individual voxels (the values ranged from 0.53 to 0.61, depending on the physiological noise correlations in each subject).
To move all hemispheres to a common space for comparison of the spatial organization of individual digit representations, a line down the fundus of the central sulcus was manually marked on each flattened cortical patch, and the 2D surface patch was rotated to use the fundus as the ordinate axis. The patch was then cropped to include only clusters exceeding the significance criteria (P < 0.01, n > 4), and the origin on the ordinate axis was centered on this patch in the vertical direction. The abscissa was defined so the fundus of the central sulcus was at 0, and anterior extended in the positive direction. The sizes (area on the cortical surface) and centers of mass for all clusters of significant area were then calculated for each digit in each hemisphere in each subject.
RESULTS
Experiment 2
In this experiment, we have demonstrated that there are distinct cortical regions that are preferentially associated with movement of each digit and propose a method to quantify and visualize this region. A comparison between volumes of activation for each digit is shown in Figure 4 by the total voxel count within each digit ROI in each hemisphere. This demonstrates a relatively larger volume of activation associated with thumb movement (D1) than other digits.
Figure 4.
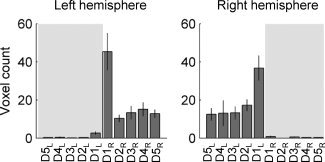
Experiment 2: Total number of voxels assigned to cuing of each digit according to “winner–take‐all” algorithm. Average single‐subject voxel counts for ROIs assigned to each digit (mean ± SE, n = 8 subjects, left hemisphere on left). Note the predominately contralateral activation in each hemisphere. From these digit assignments, the ROI for each digit was created. Shaded background indicates response from digits ipsilateral to the labeled hemisphere.
The relative BOLD signals (mean ± SE, n = 8 subjects) associated with each digit in each ROI are shown in Figure 5. Motion of each cued digit segment, indicated by a hand icon with one highlighted digit, generated a BOLD response in each of five left hemisphere (top) and five right hemisphere (bottom) ROIs. For example, the first column plots the magnitude of the BOLD response during D5L cued movement in all ROIs in the left (top) and right (bottom) hemispheres.
Figure 5.
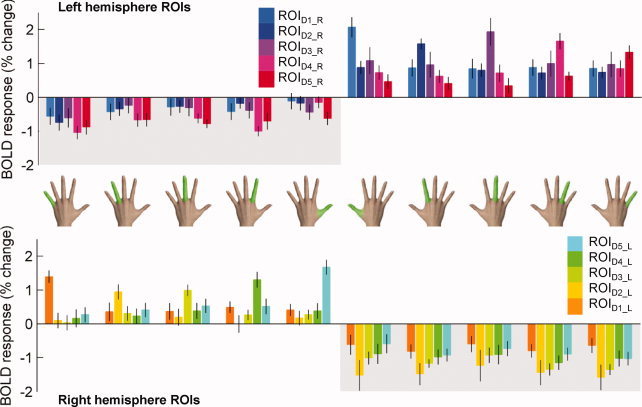
Experiment 2. Mean (± SE) BOLD responses in each ROI during each digit's movement. Each bar represents the BOLD response (mean ± SE, n = 8) in a single ROI to motion of a single digit (indicated by hand icon). Clusters demonstrate the BOLD response in the defined ROI according to the contralateral (positive values) or ipsilateral (negative values with shaded background) hand. [Color figure can be viewed in the online issue, which is available at wileyonlinelibrary.com.]
The “specialization” of the BOLD response in each ROI for the motion of a given digit was determined by calculating a SI that compared the magnitude of the BOLD response to a given digit in a given ROI to the magnitude of the BOLD response to all the digits on the same hand (see Methods for details). This index would take a value of 0.2 if there were no selectivity (i.e., if the response in ROID4_R during motion of D4R is the same as the response during motion of D1R, D2R, D3R, and D5R), and a value of 1 if the only digit that evoked a BOLD response in that ROI was the digit used to define the ROI. Average selectivity indices for each ROI are tabulated in Table I and shown in Figure 6. We measured SI values of 0.43 ± 0.04 (mean ± SEM, across five ROIs in eight subjects) in the left hemisphere, and 0.57 ± 0.04 in right hemisphere ROIs (Fig. 6a), indicating higher selectivity in the representations of motion of digits on the nondominant hand. By contrast, the selectivity indices calculated in each ROI for motion of ipsilateral digits (Fig. 6b), indicated that it was rare for the ipsilateral negative BOLD response to any one digit to dominate the ROI.
Table I.
Average selectivity indices for ipsilateral and contralateral ROI (mean ± SEM, eight subjects)
| Hemisphere | Contralateral digit | ||||
|---|---|---|---|---|---|
| D1 | D2 | D3 | D4 | D5 | |
| Left | 0.48 ± 0.08 | 0.41 ± 0.09 | 0.29 ± 0.05 | 0.46 ± 0.09 | 0.52 ± 0.09 |
| Right | 0.59 ± 0.10 | 0.66 ± 0.12 | 0.61 ± 0.10 | 0.46 ± 0.09 | 0.53 ± 0.07 |
Figure 6.
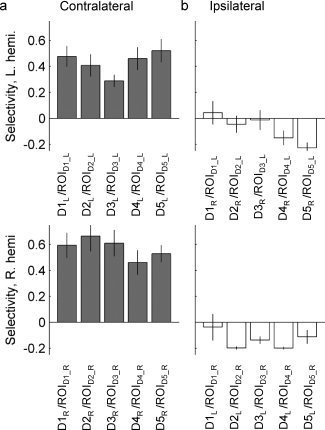
Experiment 2: Selectivity indices for BOLD responses. (a) Top row: selectivity index (SI) for right digits in left hemisphere ROIs; bottom row: SI for left digits in right hemisphere ROIs. X‐axis label indicates the cued digit (numerator of the SI) and the ROI for which the SI was calculated (denominator is the sum of all positive BOLD responses to motion of digits of the same hand). (b) SI for ipsilateraldigits. In this calculation the numerator is the BOLD response during ipsilateral digit cueing in the ROI defined by the opposite finger. For example, in the first column the SI for D1L movement relative to other left digit movments is shown within ROID1R. These data demonstrate negative BOLD responses that do not strongly depend on cued digit movement.
The BOLD response is visualized for a representative subject on flattened cortical patches with both anterior and posterior banks of the central sulcus (Fig. 7a) and on cortical patches cropped to contain only the motor representations (significantly modulated voxels) anterior to the fundus of the sulcus (Fig. 7b). Clusters of (transformed and resampled) pixels representing each digit were identified on the two‐dimensional cortical surface maps, and characterized by their center of mass and area on the cortical surface (Fig. 7c). Clusters with a cortical surface area less than 4 mm2 were excluded from further analysis. The average number of clusters representing each digit in each hemisphere, and the average surface area of these clusters, is shown in Figure 7d. Although the number of clusters varied depending on the cued digit, the average cluster size was relatively constant at 8–10 pixels on the cortical surface maps (with the exception of the thumb representations, which tended to generate larger clusters). This is approximately the volume of a square that is 3 mm on a side, extending through the cortical depth, or a total cortical volume of 3 × 3 × 3 mm, per cluster.
Figure 7.
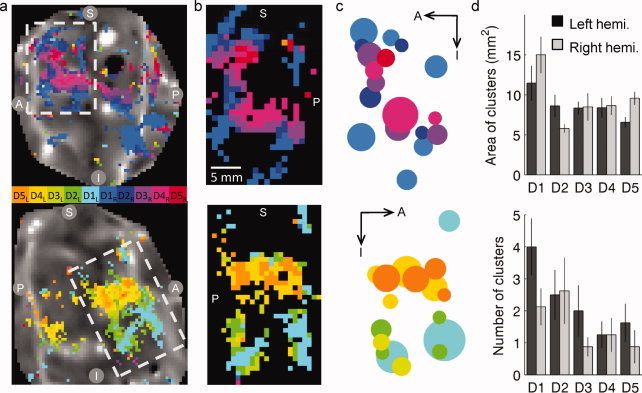
Experiment 2: Visualization and quantification of activation on two‐dimensional cortical surface patches. (a) Digit indices (winner‐take‐all) for individual voxels were translated to the cortical surface; pixels with translated correlation values exceeding the significance criterion (P < 0.01) are visualized as a color overlay. Cortical surface patches and functional data are shown for a single representative subject. Dashed white box indicates cropped region in (b). S: superior; I: inferior; A: anterior; P: posterior. (b) Using the fundus of the central sulcus as a landmark, cortical patches centered on the finger representations were rotated to align with the fundus vertically. (c) All clusters larger than 4 mm2 were extracted for each digit. In this representation, the area of the cluster on the cortical surface is represented by the area of the dot, and the center of the dot represents the center of mass. (d) Top: average cluster size (mean ± SEM, n = 8 hemispheres) for the five digits in each of the two hemispheres, bottom: average number of clusters per digit. [Color figure can be viewed in the online issue, which is available at wileyonlinelibrary.com.]
Although we found strong evidence for selectivity of digit representations on the posterior bank of the precentral gyrus, we did not find strong evidence for an orderly spatial topography of the digits with D1 most inferior (lateral) and D5 most superior. Of the 16 hemispheres analyzed in this experiment, only two showed the simple, progressive organization that has been measured in somatosensory cortex [the right hemisphere shown in Fig. 7 (bottom) has this organization, and a right hemisphere from a second subject had similar organization]. Figure 8 shows a weighted average of all of the voxel clusters representing each digit—while pooling data across subjects in this way exaggerates overlaps between digits, it accentuates trends in the centers of mass for the individual representations. These results demonstrate a variable and distributed arrangement of control that may be different across hemispheres.
Figure 8.
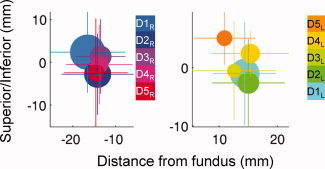
Experiment 2: Visualization of average locations of digit representations on the cortical surface. In the common cortical space, referenced from the fundus of the central sulcus (separately for right and left hemispheres), colored dots are centered the center of mass (COM) of the cortical representation of each digit (averaged across all subjects/clusters, weighted by cluster size). Dot size represents the total (average) volume of the cortical representation for each digit (adding all clusters per subject, then averaging the total volume of digit representation in each subject); lines indicate standard deviation of the COM of all clusters (all subjects) representing each digit. [Color figure can be viewed in the online issue, which is available at wileyonlinelibrary.com.]
DISCUSSION
Experiment 2
The primary findings of Experiment 2 were (1) with a random order finger tapping task, noncontiguous regions of interest were clearly selective for the motion of one digit over all the other digits and (2) a SI comparing BOLD responses within a given ROI to motion of digits on the contralateral hand demonstrated a strong selectivity, particularly in the right (nondominant hemisphere). A secondary finding was that individual digit ROIs were distributed throughout the hand area and lacked consistency between subjects.
The ROI selection criteria dictated that the largest BOLD response in a given ROI corresponded to the digits used to select that ROI (e.g., in Fig. 5, the light blue bar in the sixth column is taller than all other light blue bars). However, selectivity of the BOLD response to movement of individual digits is further supported by the observation that the BOLD response to motion of a given digit is generally larger in its own ROI than in any other ROI (i.e., light blue bar is the largest in the fifth column, top row, and light green bar is largest in the fourth column, bottom row). Nonselective BOLD responses to the motion of individual fingers would be evident as a response magnitude that was largely independent of ROI, but only ipsilateral negative responses show this kind of even distribution across multiple ROIs for a given digit.
The selectivity of ROIs in the right (nondominant) hemisphere was greater than that of ROIs in the left hemisphere. In the contralateral ROIs, for which analysis was limited to positive BOLD responses, a SI value of 0.2 indicates that there is an even distribution of signal associated with each digit movement. An average SI value near 0.4 for the left hemisphere indicates that, on average, the BOLD response to the digit used to select the ROI was almost three times larger than the response to other digits on the same hand, while a SI of 0.6 in the right hemisphere indicates that the BOLD response to the selected digit is six times as large as the average response to all other digits on the same hand. Throughout motor control literature, hemisphere differences are noted between the dominant and nondominant hand and the cortical processes associated with these movements [for review, Hammond,2002]. Nondominant, left hand movements have also been shown to be counter‐intuitively more accurate in visual spatial tracking tasks [Carey et al.,1994]. Therefore, although we cannot rule out the possibility that the right/left phase encode direction (and resulting asymmetric distortions that were incompletely corrected) contributed to the measured hemispheric differences in SI, there is precedent in the literature to predict greater selectivity in the nondominant hemisphere.
Comparing the ROIs defined for different digits, both the number of clusters and the volume of clusters for bilateral D1 representations were larger than for the other digits, indicating a relative dominance of the thumb responses. This could be due, in part, to the fact that the motion of the thumb in the keyboard‐tapping task is not flexion/extension, as it is for the other digits. Thus, a truly equal comparison cannot be made between the motion of D1 and other digits in this experiment. Additionally, the nature of the task and the position of the thumb may have caused some isometric stabilization that was not adequate to trigger the pressing of the keyboard key. Because data were collected in an fMRI scanner, this study did not perform electromyography that could further elucidate this issue.
Localization relative to the fundus was performed to give some indication of spatial arrangement. The lack of clearly defined somatotopy indicates that there is a distributed area of control within the hand region. These data are in agreement with the findings of others suggesting distributed and overlapping representations [Dechent and Frahm,2003]. In fact, the spatial pattern revealed in the BOLD data bear striking resemblance to the single unit responses reported in Schieber and Hibbard [1993]: responses to the motion of each digit are distributed throughout M1, while the centroids of the digit activations are organized so D1 is the most inferior and D5 is most superior. Our findings complement this work by identifying a method for quantification of the BOLD response within a defined disparate region relative to the activation associated with other digits of that hand.
The volume of the clusters detected by this experiment is comparable to the volume of a single voxel in a standard fMRI experiment with 3‐mm isotropic resolution. This indicates that high resolution is important for accurate mapping of digit representations on motor cortex. It is well established that partial volume effects, the existence of low‐spatial frequency patterns generated by small‐scale structure [Kriegeskorte et al.,2009], and/or biased sampling [Kamitani and Tong,2005] permit detection of cortical structures much smaller than the voxel size. Therefore, low‐resolution experiments can detect digit selectivity in motor cortex. However, true elucidation of the cortical organization serving motor control of individual digits clearly requires high‐resolution BOLD fMRI. Future studies with 1‐mm isotropic resolution, which has recently been used to reveal somatotopy in sensory cortex using 7T fMRI [Sanchez‐Panchuelo et al.,2010], hold good promise for a complete understanding of the cortical representation of individual joints in primary motor cortex.
One of the challenges for creating accurate visualizations of cortical representations of motor activity on the posterior bank of the precentral gyrus is the local cortical geometry, specifically, the hand knob. The hand knob is a reliable anatomical landmark, easily recognized by its “Ω” shape (e.g., Fig. 2b). This tertiary gyrus, however, creates specific challenges for quantification of maps on the flattened cortical surface. This local region of positive curvature runs essentially perpendicular to the fundus of the central sulcus (Fig. 7a), which was used as a landmark for rotating cortical patches to align data between subjects. However, because the digit representations of the hand are found along the inferior aspect of the hand knob, the fundus of the central sulcus was an insufficient landmark for coregistration of subjects. A more complete motor mapping strategy, to effectively align data from multiple subjects, therefore requires local distortion of the cortical surfaces to align both the fundus of the sulcus and the apex of the hand knob [Liu et al.,2004]. This study is not unique in noting the centrality of surface‐based cortical registration for accurate localization of function in populations of subjects [Moulton et al.,2009; Van Essen,2004].
In summary, this report demonstrates a technique for quantifying the cortical activity associated with individual digit movement to an extent that has not previously been shown. These results may have future use for studies of learning, rehabilitation or disorders of motor control. Although the method employed herein does not support a definitive definition of a cortical area exclusively associated with a given digit, it does provide a technique and new foundation for comparison of normal digit activation within a given finger ROI relative to the other digits of the same hand. This method could thereby serve as the initial methodological consideration that allows for measurement of cortical changes in the primary motor area.
REFERENCES
- Bandettini PA, Jesmanowicz A, Wong EC, Hyde JS ( 1993): Processing strategies for time‐course data sets in functional MRI of the human brain. Magn Reson Med 30: 161–173. [DOI] [PubMed] [Google Scholar]
- Bara‐Jiminez W, Catalan M, Hallett M ( 1998): Abnormal somatosensory homunculus in dystonia of the hand. Ann Neurol 44: 828–831. [DOI] [PubMed] [Google Scholar]
- Blake DT, Byl NN, Cheung S, Bedenbaugh P, Nagarajan S, Lamb M, Merzenich M ( 2002): Sensory representation abnormalities that parallel focal hand dystonia in a primate model. Somatosens Mot Res 19: 347–357. [DOI] [PMC free article] [PubMed] [Google Scholar]
- Brainard DH ( 1997): The psychophysics toolbox. Spatial Vision 10: 433–436. [PubMed] [Google Scholar]
- Butterworth S, Francis S, Kelly E, McGlone F, Bowtell R, Sawle GV ( 2003): Abnormal cortical sensory activation in dystonia: An fMRI study. Mov Disord 18: 673–682. [DOI] [PubMed] [Google Scholar]
- Byl NN, Merzenich MM, Jenkins WM ( 1996): A primate genesis model of focal dystonia and repetitive strain injury. I. Learning‐induced dedifferentiation of the representation of the hand in the primary somatosensory cortex in adult monkeys. Neurology 47: 508–520. [DOI] [PubMed] [Google Scholar]
- Carey J, Bogard C, King B, Suman V ( 1994): Finger‐movement tracking scores in healthy subjects. Percept Mot Skills 79: 563–576. [DOI] [PubMed] [Google Scholar]
- Dale AM ( 1999): Optimal experimental design for event‐related fMRI. Hum Brain Mapp 8: 109–114. [DOI] [PMC free article] [PubMed] [Google Scholar]
- Dechent P, Frahm J ( 2003): Functional somatotopy of finger representations in human primary motor cortex. Hum Brain Mapp 18: 272–283. [DOI] [PMC free article] [PubMed] [Google Scholar]
- Devanne H, Cassim F, Ethier C, Brizzi L, Thevenon A, Capaday C ( 2006): The comparable size and overlapping nature of upper limb distal and proximal muscle representations in the human motor cortex. Eur J Neurosci 23: 2467–2476. [DOI] [PubMed] [Google Scholar]
- Elbert T, Candia V, Altenmuller E, Rau H, Sterr A, Rockstroh B, Pantev C, Taub E ( 1998): Alterations in the digital representations in somatosensory cortex in focal hand dystonia. Neuroreport 9: 3571–3575. [DOI] [PubMed] [Google Scholar]
- Engel SA, Glover GH, Wandell BA ( 1997): Retinotopic organization in human visual cortex and the spatial precision of functional MRI. Cereb Cortex 7: 181–192. [DOI] [PubMed] [Google Scholar]
- Ferrier D ( 1875): Experiments on the brain of monkeys. Proc R Soc Lond B Biol Sci 23: 409–430. [Google Scholar]
- Fritsch G, Hitzig E ( 1870): Über die elektrische Erregbarkeit des Grosshirns. Arch f Anat, Physiol, und wissenschaftl Mediz, Leipzig 37: 300–332. [Google Scholar]
- Grafton ST, Woods RP, Mazziotta JC ( 1993): Within‐arm somatotopy in human motor areas determined by positron emission tomography imaging of cerebral blood flow. Exp Brain Res 95: 172–176. [DOI] [PubMed] [Google Scholar]
- Hammond G ( 2002): Correlates of human handedness in primary motor cortex: A review and hypothesis. Neurosci Biobehav Rev 26: 285–292. [DOI] [PubMed] [Google Scholar]
- Kamitani Y, Tong F ( 2005): Decoding the visual and subjective contents of the human brain. Nat Neurosci 8: 679–685. [DOI] [PMC free article] [PubMed] [Google Scholar]
- Kitamura J, Shibasaki H, Kondo T ( 1993): A cortical slow potential is larger before an isolated movement of a single finger than simultaneous movement of two fingers. Electroencephalogr Clin Neurophysiol 86: 252–258. [DOI] [PubMed] [Google Scholar]
- Kleinschmidt A, Nitschke MF, Frahm J ( 1997): Somatotopy in the human motor cortex hand area. A high‐resolution functional MRI study. Eur J Neurosci 9: 2178–2186. [DOI] [PubMed] [Google Scholar]
- Kriegeskorte N, Cusack R, Bandettini PA ( 2010): How does an fMRI voxel sample the neuronal activity pattern: Compact‐kernel or complex‐spatiotemporal filter? Neuroimage 49: 1965–1976. [DOI] [PMC free article] [PubMed] [Google Scholar]
- Lang CE, Beebe JA, Lang CE, Beebe JA ( 2007): Relating movement control at 9 upper extremity segments to loss of hand function in people with chronic hemiparesis. Neurorehabil Neural Repair 21: 279–291. [DOI] [PubMed] [Google Scholar]
- Larsson J ( 2001): Imaging Vision: Functional Mapping of Intermediate Visual Processes in Man [PhD Thesis]. Stockholm, Sweden: Karolinska Institutet.
- Lemon RN ( 1999): Neural control of dexterity: What has been achieved? Exp Brain Res 128: 6–12. [DOI] [PubMed] [Google Scholar]
- Liu T, Shen D, Davatzikos C ( 2004): Deformable registration of cotical structures via hybrid volumetric and surface warping. Neuroimage 22: 1790–1801. [DOI] [PubMed] [Google Scholar]
- Lotze M, Erb M, Flor H, Huelsmann E, Godde B, Grodd W ( 2000): fMRI evaluation of somatotopic representation in human primary motor cortex. Neuroimage 11: 473–481. [DOI] [PubMed] [Google Scholar]
- Mitchell RL ( 2010): Linear increases in BOLD response associated with increasing proportion of incongruent trials across time in a colour Stroop task. Exp Brain Res 203: 193–204. [DOI] [PubMed] [Google Scholar]
- Moulton EA, Pendse G, Morris S, Aiello‐Lammens M, Becerra L, Borsook D ( 2009): Segmentally arranged somatotopy within the face representation of human primary somatosensory cortex. Hum Brain Mapp 30: 757–765. [DOI] [PMC free article] [PubMed] [Google Scholar]
- Nestares O, Heeger DJ ( 2000): Robust multiresolution alignment of MRI brain volumes. Magn Reson Med 43: 705–715. [DOI] [PubMed] [Google Scholar]
- Nichols TE, Holmes AP ( 2002): Nonparametric permutation tests for functional neuroimaging: A primer with examples. Hum Brain Mapp 15: 1–25. [DOI] [PMC free article] [PubMed] [Google Scholar]
- Pelli DG ( 1997): The VideoToolbox software for visual psychophysics: Transforming numbers into movies. Spatial Vision 10: 437–442. [PubMed] [Google Scholar]
- Penfield W, Boldrey E ( 1937): Somatotopic motor and sensory representation in the cerebral cortex of man as studied by electrical stimulation. Brain 37: 389–443. [Google Scholar]
- Plow B, Arora P, Pline MA, Binenstock MT, Carey JR ( 2010): Within‐limb somatotopy in primary motor cortex—Revealed using fMRI. Cortex 46: 310–321. [DOI] [PubMed] [Google Scholar]
- Remy P, Zilbovicius M, Leroy‐Willig A, Syrota A, Samson Y ( 1994): Movement‐ and task‐related activations of motor cortical areas: A positron emission tomographic study. [see comment]. Ann Neurol 36: 19–26. [DOI] [PubMed] [Google Scholar]
- Richter MM, Zierhut KC, Dresler T, Plichta MM, Ehlis AC, Reiss K, Pekrun R, Fallgatter AJ ( 2009): Changes in cortical blood oxygenation during arithmetical tasks measured by near‐infrared spectroscopy. J Neural Transm 116: 267–273. [DOI] [PubMed] [Google Scholar]
- Sanchez‐Panchuelo RM, Francis S, Bowtell R, Schluppeck D ( 2010): Maping human somatosensory cortex in individual subjects with 7T functional MRI. J Neurophysiol 103: 2544–2556. [DOI] [PMC free article] [PubMed] [Google Scholar]
- Sanes, Donoghue JP, Thangaraj V, Edelman RR, Warach S ( 1995): Shared neural substrates controlling hand movements in human motor cortex. Science 268: 1775–1777. [DOI] [PubMed] [Google Scholar]
- Schieber MH ( 1999): Somatotopic gradients in the distributed organization of the human primary motor cortex hand area: evidence from small infarcts. Experimental Brain Research 128: 139–148. [DOI] [PubMed] [Google Scholar]
- Schieber MH ( 2001): Constraints on somatotopic organization in the primary motor cortex. J Neurophysiol 86: 2125–2143. [DOI] [PubMed] [Google Scholar]
- Schieber MH, Santello M ( 2004): Hand function: peripheral and central constraints on performance J of Applied Physiology 96: 2293–2300. [DOI] [PubMed] [Google Scholar]
- Schieber MH, Hibbard LS ( 1993): How somatotopic is the motor cortex hand area? Science 261: 489–492. [DOI] [PubMed] [Google Scholar]
- Van Essen DC ( 2004): Surface‐based approaches to spatial localization and registration in primate cerebral cortex. Neuroimage 23: S97–S107. [DOI] [PubMed] [Google Scholar]
- Wandell BA, Brewer AA, Dougherty RF ( 2005): Visual field map clusters in human cortex. Phil Trans R Soc Lond B 360: 693–707. [DOI] [PMC free article] [PubMed] [Google Scholar]