

Abstract
Little is known about chromosomal loopings involving proximal promoter and distal enhancer elements regulating GABAergic gene expression, including changes in schizophrenia and other psychiatric conditions linked to altered inhibition. Here, we map in human chromosome 2q31 the 3D configuration of 200 kb of linear sequence encompassing the GAD1 GABA synthesis enzyme gene locus, and we describe a loop formation involving the GAD1 transcription start site and intergenic noncoding DNA elements facilitating reporter gene expression. The GAD1-TSS-50kbLoop was enriched with nucleosomes epigenetically decorated with the transcriptional mark, histone H3 trimethylated at lysine 4, and was weak or absent in skin fibroblasts and pluripotent stem cells compared with neuronal cultures differentiated from them. In the prefrontal cortex of subjects with schizophrenia, GAD1-TSS-50kbLoop was decreased compared with controls, in conjunction with downregulated GAD1 expression. We generated transgenic mice expressing Gad2 promoter-driven green fluorescent protein-conjugated histone H2B and confirmed that Gad1-TSS-55kbLoop, the murine homolog to GAD1-TSS-50kbLoop, is a chromosomal conformation specific for GABAergic neurons. In primary neuronal culture, Gad1-TSS-55kbLoop and Gad1 expression became upregulated when neuronal activity was increased. We conclude that 3D genome architectures, including chromosomal loopings for promoter-enhancer interactions involved in the regulation of GABAergic gene expression, are conserved between the rodent and primate brain, and subject to developmental and activity-dependent regulation, and disordered in some cases with schizophrenia. More broadly, the findings presented here draw a connection between noncoding DNA, spatial genome architecture, and neuronal plasticity in development and disease.
Introduction
Psychosis and defective cognition in some cases with schizophrenia and bipolar disorder are thought to be rooted in molecular and cellular defects of the cortical inhibitory (GABAergic) circuitry, resulting in altered synchronization of electrical activity across widespread brain regions (Fatemi et al., 2005; Zhang et al., 2008; Lewis et al., 2012; Uhlhaas and Singer, 2012). The empirical framework for this hypothesis is based, among others, on a large body of postmortem literature reporting downregulated RNA and protein levels for the rate-limiting GABA synthesis enzyme, 67 kDa glutamic acid decarboxylase (GAD67), in multiple subtypes of cortical interneurons, including those commonly defined as fast-spiking, parvalbumin+ (PV+), and low-treshold spiking somatostatin+ cells (Akbarian and Huang, 2006; Fung et al., 2010; Konradi et al., 2011a; Schmidt and Mirnics, 2012). There is evidence that 30% or 40% of subjects with schizophrenia are affected by a more robust deficit in cortical gene expression, affecting GAD67, the transcription factor LHX6, and various neuropeptides selectively expressed by interneurons (Volk et al., 2012).
Of note, single nucleotide polymorphisms in the proximal GAD1 promoter confer genetic risk for schizophrenia, impaired working memory performance, and accelerated loss of gray matter (Addington et al., 2005; Straub et al., 2007), possibly in conjunction with altered expression of the cation chloride cotransporters NKCC1/KCC2, two key regulators of postsynaptic GABAA receptor-mediated currents (Hyde et al., 2011). These findings, in conjunction with altered chromatin structures at the proximal GAD1 promoter, including a shift from open toward repressive chromatin-associated histone modifications and abnormal DNA methylation signatures (Huang et al., 2007; Tang et al., 2011; Grayson and Guidotti, 2012), firmly point to transcriptional dysregulation as a key factor for GABAergic dysfunction in schizophrenia. However, the regulation of gene expression in a vertebrate cell goes far beyond the genetic and epigenetic architectures of proximal promoters and transcription start sites (TSSs). Instead, chromosomes and gene expression units inside the cell nucleus are organized as highly complex dynamic 3D structures that includes chromosomal loopings via direct physical interactions of enhancer and promoter elements with TSSs (Deng and Blobel, 2010; Ribeiro de Almeida et al., 2011; Singh et al., 2012). To date, however, the regulation of supranucleosomal and higher-order chromatin structures, beyond the level of DNA methylation and post-translational modifications of the core histones (which together with 146 bp of DNA wrapped around them comprise the nucleosome as the fundamental unit of chromatin), essentially remains unexplored in normal or diseased human brain.
Here, we explore 3D chromosomal architectures encompassing 200 kb of chromosome 2q31 in prefrontal cortex (PFC) of subjects with schizophrenia and controls, cultured human and mouse (chromosome 2qC2) neurons and their pluripotent precursors, and in transgenic animals tagged for GABAergic chromatin. We identify, for the first time, conserved regulatory DNA elements in rodent and primate genomes that are engaged in a loop formation with the GAD1/Gad1 TSS and present multiple lines of evidence that dynamic regulation of 3D genome structures plays a critical role for orderly development and function of GABAergic systems in the human brain.
Materials and Methods
iPS reprogramming of human dermal fibroblasts.
Fibroblasts from a 43-year-old (hDF6, ATCC) healthy female were reprogrammed using a published protocol (Maherali et al., 2008) with minor modifications. Briefly, passage 6 cells were reprogrammed by infection of 3 × 10⁵ fibroblasts with a mixture of lentivirus particles (Openbiosystems) containing genomes encoding OCT4, SOX2, KLF4, and human c-MYC at a multiplicity of infection of 5:5:5:2.5 (hDF6). Infected cells were grown for 4 d in fibroblast growth medium (DMEM/10% FCS), but 3 d after infection, each 100,000 fibroblasts were passaged into 10 cm tissue culture dishes and grown on feeder cells until candidate colonies were harvested. On day 4, the fibroblast growth medium was replaced with human ES cell medium (80% DMEM/F12) (Invitrogen), 20% knock-out serum replacement (Invitrogen), 1× nonessential amino acids (Invitrogen), 1 mm glutamine (Invitrogen), 100 μm β-mercaptoethanol (Invitrogen), and 5 ng/ml fibroblast growth factor 2 (FGF2) (R&D Systems). The culture medium was replaced daily until all candidate colonies were harvested. This approach yielded colonies with embryonic stem cell morphology at a frequency of 8 × 10⁻⁵ (data not shown). From day 30 onwards, candidate iPS cell colonies were harvested using glass knives (Vitrolife), transferred into culture wells of 6-well plate containing fresh mouse embryonic fibroblast feeder cells and expanded to colonies with a diameter of 1–2 mm. Candidate iPS cells with a modal chromosome number of 46 were then maintained further feeder free conditions on Matrigel in the presence of mTESR1.
Assessment of pluripotency.
Pluripotency was determined initially by immunofluorescent detection of endogenous expression of Nanog and Tra1-60. Surface pluripotency marker expression for Tra1–60 and SSEA4 was confirmed using fluorescence activated cell sorting. We next confirmed by qRT-PCR the expression of OCT4 and REX1 mRNAs. We assessed pluripotency further through targeted differentiation into all three germlayers and detection of Sox17 (endoderm), Otx2 (ectoderm), or Brachyury (mesoderm) protein expression by immunofluorescence. Finally, we also produced embryoid bodies from our iPSCs and assessed expression of Nestin and Neuropilin 2 (neuroectoderm), SOX17 and Alpha-Feto Protein (endoderm), and KDR, Matrilin 1, Myf5, and Brachyury (mesoderm). Line W(K)6 iPS was grown feeder free on Matrigel (BD Biosciences; 356231) and collected with dispase, and embroid bodies were formed using Aggrewell 400 plates (Stem Cell Technologies; 27845). After growing the iPS cells for 1–2 d, embroid bodies were collected and moved into nonadherent flasks, with HES media changed daily for 4 d and on the fifth day changed to neural induction (NI) media containing FGF2. On day 6, the aggregates were plated on coated tissue culture plates (poly-l-ornithine/laminin) in NI media + FGF2 and processed similar as described above for H9ESC. For chromosome conformation capture (3C) assays, 8–15 × 106 stem cells (or differentiated neurons, see below) were used as input.
Neuronal differentiation assays (human).
Depending on the strength of the chromosomal interactions and sensitivity of the PCR assays, conventional chromosome conformation capture (3C) often requires 106 to 107 nuclei as input (Miele and Dekker, 2009). Therefore, we modified existing protocols to induce neural differentiation in a larger number of cells. Briefly, the W6 iPS were grown feeder free on Matrigel (BD Biosciences; 356231) and collected with dispase, and embroid bodies were formed using Aggrewell 400 plates (Stem Cell Technologies; 27845). After growing the iPS cells for 1–2 d, embroid bodies were collected and moved into nonadherent flasks, with HES media changed daily for 4 d and on the fifth day changed to NI media containing FGF2. On day 6, the aggregates were plated on coated tissue culture plates (poly-l-ornithine/laminin) in NI media + FGF2, changing the media every second day. By day 11–14, neural rosettes were forming. At approximately day 14, these primary neural rosettes were mechanically removed from the plate and grown in suspension for 2 d in a nonadherent flask, then replated in NI + FGF2. After 2 d, the media is changed to a modified (by the addition of N2 supplement) neural proliferation media (NP) + FGF2 + leukemia inhibitory factor (LIF) (Dhara et al., 2008). The cells are grown for a further 6–10 d in changing the media every second day. At approximately day 24–28, the secondary neural rosettes were collected and grown for 2 d in suspension and then replated on (poly-l-ornithine/laminin) in NP media + FGF2 + LIF with the addition of 200 μm Sonic hedgehog for 24 h, grown for another 7–12 d. Then, tertiary neural rosettes were collected in 1 × HBSS, incubated for 10–30 min, and then titrated gently to break up the rosettes, and the cells replated in NP media + FGF2 + LIF with the addition of 200 μm Sonic hedgehog for 24 h. After 1–2 d, the cells are grown in neural differentiation media (Sara et al., 2005) for 6–12 d and then harvested.
Human dermal fibroblasts.
Fibroblasts (from two unrelated donors, including hDF6) were grown in batches of four T175 flasks in DMEM, 15% Hyclone serum + 0.5 ml glutamine and 1 × nonessential amino acids. After confluency (day 6), cells were harvested and processed for 3C as above.
Postmortem brain tissue.
For the clinical studies, specimens from the rostral third of the dorsolateral prefrontal cortex of 10 subjects diagnosed with schizophrenia (4 females/5 males, age range 40–87 years; tissue pH, 6.1–7.2) and 7 controls (2 females, 6 males; age range 41–90 years; tissue pH, 6.1–7.2) were included in this study. An independent set of 6 controls (4 females, 2 males; age range 16–81 years), and RNA integrity number from 4.1 to 9.0 was used for RNAseq experiments. Specimens were from a brain bank at the University of California at Irvine and Davis. Procedures for tissue collection, neuropathologic examination (to rule out degenerative and neurologic disease), diagnosing schizophrenia using DSM-IV-based diagnostic criteria were described previously (Akbarian et al., 1995; Huang et al., 2007).
Generation of Gad2-H2BGFP transgenic mice.
Transgenic mice were generated by injection of circular modified bacterial artificial chromosome (BAC) into fertilized C57BL/6 mouse oocytes by the University of California Irvine Transgenic Mouse Facility (http://www.research.uci.edu/tmf/), using BAC RP23 27D24, containing the mouse glutamate decarboxylase 2 (mGad2) locus (chromosome 2: 22,453,784–22,682,644, NCBI Build 37.1) (http://bacpac.chori.org/), including the mGad2 gene (chromosome 2: 22,478,000–22,550,009, + strand). BAC modifications were performed to insert H2BGFP-FRT-neo-FRT at the Gad2 start codon, and then the selection marker (neomycin) cassette was removed via FRT directed recombination, the BAC modifications further confirmed with restriction mapping and sequencing.
Primary hippocampal neuron culture (mouse).
All animal experiments were approved by the Animal Use and Care Committees of the participating institutions. Primary hippocampal cultures were prepared from early postnatal (P0-P1) mouse as described previously (Brewer et al., 1993) with some modifications (Futai et al., 2013). Briefly, hippocampi were dissected and trypsinized, after which neurons were dissociated and plated onto coverslips coated with poly-d-lysine (40 μg/ml) and laminin (4 μg/ml) at a density of 500 cell/mm2. Neurons were maintained in B27 containing medium for 14 d in vitro and treated with picrotoxin (100 μm), tetrodotoxin (1 μm), or equal volume of DMSO for 15 h. Total RNA was extracted using RNAqueous Micro Kit (Ambion) and reverse transcribed using High Capacity RNA-to-cDNA Kit (Applied Biosystems). Real-time quantitative PCR was then performed on an ABI 7500 Fast sequence detection system (Applied Biosystems) using TaqMan assay (Applied Biosystems). Gene expression levels in drug-treated groups or control groups (DMSO-treated) were analyzed in 3 independent cultures in PCR duplicates. Glyceraldehyde-3-phosphate-dehydrogenase (Gapdh) was used as reference gene, and fold change of Gad1 expression level in drug-treated groups relative to control group was determined using the 2−ΔΔCT method [ΔΔCT values = (CTgad1 − CTgapdh)treated − (CTgad1 − CTgapdh)control](Livak and Schmittgen, 2001).
Antipsychotic drug treatment.
For antipsychotic drug studies, adult male C57BL/6J mice, 10–15 weeks of age, were treated acutely or for 21 d with once daily intraperitoneal injections of saline or haloperidol (0.5 mg/kg) or clozapine (5 mg/kg) (Sigma). Tissue (PFC) was harvested 60 min after the last treatment.
Immunohistochemistry.
Gad2-H2BGFP mice were anesthetized and perfused transcardially with cold 4% PFA in 1× PBS. Brains were harvested and postfixed in 4% PFA overnight and then cryoprotected in 30% sucrose in 0.1 m PBS. Brains were sectioned 30 μm thick on a freezing microtome. Immunostaining was done with free-floating sections using Tyramide-Plus signal amplification system. Briefly, sections were incubated with primary antibodies against calretinin (1:1000, SWANT) or parvalbumin (1:1000, SWANT), followed by biotin-tagged secondary antibody incubation (1:200; Jackson ImmunoResearch Laboratories), ABC (Vector Laboratories) treatment, and Tyramide-Plus signal amplification (1:50, PerkinElmer Life and Analytical Science). Sections were mounted to slides using VECTASHIELD mounting medium with DAPI.
Chromosome conformation capture (3C).
Cerebral cortex (300–500 mg of gray matter/specimen) was homogenized in 1 × PBS-buffered, 1.5% formaldehyde to cross-link higher-order chromatin (of note, based on flow cytometry of purified nuclei from postmortem specimens, there are at least 3–4 × 10⁶ physically intact nuclei in a 300 mg piece of cortical gray matter) (Jiang et al., 2008). After 15 min, cross-linking was stopped by the addition of glycine to 0.125 m final concentration) and samples spun in a tabletop centrifuge c at 4000 rpm for 10 min at 4°C; then the pellet was resuspended in 2 ml of cellular lysis buffer (10 mm Tris-HCl, pH 8.0/10 mm NaCl/0.2% Ige cal CA630) and incubated at room temperature for 45 min. Next, samples were homogenized by constant pipetting and spun at 5000 rpm for 5 min, the supernatant removed and the pelleted nuclei stored at −80°C.
Cell culture.
Media was aspirated, followed by a quick wash with 37°C 1 × PBS. Then 5 ml of 1 × PBS/1.5% formaldehyde was added to the cultures, the cells scrapped, and kept in suspension for 10 min. Then cross-linking was stopped by the addition of glycine to 0.125 m and cells harvested by centrifugation at 1200 rpm/5 min. The pellet is treated with 1 × cellular lysis buffer after adding one-tenth volume of protease inhibitor mixture (Sigma), resuspended, and left at room temperature for 15 min, followed by homogenization and nuclei pelleting (5000 rpm for 5 min) and two washes with 1 × New England Biolabs2 [NEB2] restriction enzyme buffer).
Restriction digestion.
Nuclei were resuspended in 250 μl of 1 × NEB2, divided into 5 × 50 μl aliquots, to each of which 312 μl of 1 × NEB2 and 38 μl of 1% SDS were added, followed by gentle mixing and incubation at 65°C for 10 min to remove proteins that are not directly associated with DNA and facilitate more efficient digestion. Then, 44 μl of Triton X-100 was added to each sample to quench the SDS by gentle pipetting, and samples were digested with 400 units of HindIII (NEB) at 37°C overnight with gentle shaking.
Ligation and reverse cross linking.
To inactivate HindIII, 86 μl of 10% SDS (Bio-Rad) was added and samples were incubated at 65°C for 30 min. Then, each sample was added to 7.61 ml of ligation reaction mixture. Each mixture consisted of 745 μl of 10% Triton X-100, 745 μl of 10 × ligation buffer [1 m Tris HCl, pH 7.5, 1 m MgCl2, 1 m DTT dithiothreitol (Bio-Rad)], 80 μl of 10 mg/ml bovine serum albumin (NEB), 80 μl of 100 mm ATP (Sigma) and 5960 μl of H2O. To each mixture, 50 μl of T4 DNA ligase (1 U/μl; Invitrogen) was added and incubated at 16°C for 4 h followed by reverse cross-linking at 65°C overnight with simultaneous Proteinase K digestion [50 μl of 10 mg/ml Proteinase K (Sigma) reconstituted with TE buffer pH8.0] to digest chromatin-associated proteins. To improve ligated DNA recovery, another 50 μl of Proteinase K was added and incubated at 65°C for 2 h.
DNA purification and recovery.
Ligated samples were phenol extracted (pH 8.0, Fisher) followed by phenol-chloroform (1:1) (pH 8.0, Omnipur) followed by ethanol precipitation. DNA was dissolved in 1 × TE buffer (pH 8.0).
For 3C studies in Gad2-H2BGFP transgenic mice, 0.2–0.3 × 10⁶ GFP+ nuclei and 48 × 106 GFP− nuclei were separately sorted and collected from cerebral cortex using fluorescence-activated nuclei sorting as described previously (Jiang et al., 2008). Additional 3C studies were conducted in whole cortex of adult C57BL/6J wild-type mice or on the primary neuronal cultures described above.
3C quantification.
We mapped physical interactions of noncontiguous DNA elements within a 200 kb region of chromosome chromosome 2 (171,573,000–171,797,000; HG19), encompassing GAD1 (Fig. 1) by PCR across the ligation junctions of interacting fragments. Primers were designed according to 3C guidelines (Miele and Dekker, 2009), with 30 bp in length and positioned within 60 bp of the restriction enzyme cut site, a melting temperature of 60°C, and with a GC% content of 45%. From a total of 55 HindIII fragments, 11 fragments yielding primer sequences in accordance with these primer selection criteria were probed by specific primers positioned in the 5′ to 3′ direction on the sense strand amplifying toward the end of the respective restriction fragment were used. The anchor primer for all PCR represented the HindIII fragment containing the TSS of GAD1. All primers were 30–32 nt in length, melting temperature = 60°C, and positioned < 200 bp from a HindIII restriction site. PCR products were resolved in agarose gels and the level of interaction between any two fragments in the 3C libraries measured semiquantitatively. To this end, amplicons generated by PCR across a single ligation junction run in triplicate on 2% agarose/1xTAE/130V/25 min and band intensities measured by UVP Bioimaging system/Labworks version 4.5 software, after background subtractions from blank gel regions. We used a BAC (clone ID-RP11–570C16, representing chromosome 2: 171552700–171745852; http://bacpac.chori.org) to control for primer efficiency (Dekker, 2006; Miele and Dekker, 2009). To control for ligation efficiencies across independent 3C experiments/samples, we mapped physical interactions of noncontiguous DNA elements within 75 kb of chromosome 16 (62,275,000–62,350,000; HG19) in a previously described “gene desert” region with the two nearest genes (CDH8 and CDH11) located 200 kb upstream and 2.6 Mb downstream (Ferraiuolo et al., 2010).
Figure 1.

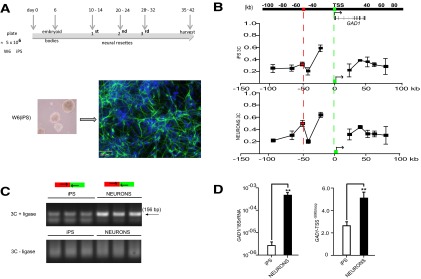
Chromosome 2q31 conformation at the GAD1 locus. A, Genome map for 200 kb surrounding GAD1 TSS, including 50 kb GAD1 gene body and surrounding sequences as indicated. Browser tracks showing H3K4me3 landscape at 2q31 in PFC neurons, and H3K27ac and H3K4me1 (composite ChIP-seq tracks from 3 ENCODE cell lines). Red and green boxes represent two HindIII restriction fragments that harbor sharp H3K4me3 peaks in PFC neurons. B, x-y graphs present chromosome conformation capture (3C) profiles across the 200 kb portion of chromosome 2q31 for (top) skin fibroblasts, FIB (N = 2 donors) and (bottom) prefrontal cortex, PFC (N = 4 donors) as indicated. Each data point expresses the interaction frequency between a specific restriction fragment with the TSS. Data are mean ± SD. 3C maps were anchored on TSS containing fragment (green). There is significant interaction (one-way ANOVA, **p < 0.001 Bonferroni corrected) between two CpG-rich, H3K4me3 decorated sequences in the PFC (A, red and green boxes; and referred to as GAD1-TSS-50kbLoop in the text). Representative gel images for PCR products from 3C assays, showing a specific interaction between red- and green-marked HindIII fragment as indicated (green box represents primer 5′-GGGCGGGAAAGGTGCATAAAACTGAGACTGA, hg19 chromosome 2: 171675735–171675765; red box, primer 5′-GTCCTTCAAAACACGTTGCCTAGCAACAAA, hg19 chromosome 2: 171626697–171626726). C, Robust expression of GAD1 RNA in PFC but not in FIB (N = 3/tissue, mean ± SEM, *p < 0.05, Wilcoxon signed-rank test), as determined by qRT-PCR after normalization to 18s rRNA. D, Top, Workflow and results of 3C-ChIP looP experiments. Schematic illustration of 3D chromatin structures at GAD1 locus, including physical proximity between GAD1 TSS sequences (green) and putative enhancer (red) as described in A, B. Chromatin is formaldehyde-crosslinked, followed by HindIII restriction digest, anti-H3K4me3 immunoprecipitation, and religation and 3C PCR to map noncontiguous DNA elements. There is robust PCR-based amplification of noncontiguous DNA sequences from green- and red-marked sequences (GAD1-TSS-50kbLoop) but only weak or nondetectable PCR signal in controls (IgG pulldown with ligase and H3K4me3 pulldown without ligase treatment).
Furthermore, we mapped physical interactions of noncontiguous DNA elements within a 70 kb region of chromosome mouse chr2qC2 (chromosome 2: 70,340,000–70,410,069; mm9), to interrogate loop formations of DNA sequences positioned up to 100 kb upstream of Gad1 TSS.
Promoter/enhancer assays.
Luciferase reporter gene assays were performed using the minimal promoter (TATA box) luciferase vector (pGL4.23 [luc2/minP] vector; Promega; E8411) in HEK-293 cell cultures. Specifically, 115 bp (chromosome 2: 171622200–171622315) was cloned into the multiple cloning site of the luciferase vector and sequence-verified clones transfected into HEK-293 cells with Lipofectamine-2000 (Invitrogen). Furthermore, control plasmids were generated with a 125 bp sequence (chromosome 2: 171645000–171645125) from an upstream region restriction fragment that was not surrounded by H3K4me1 or H3K27ac peaks in various Encyclopedia of DNA Elements Consortium (ENCODE) cell lines and did not harbor AP-1 motifs. As an additional control, Renilla luciferase vector (Prl-TK; Promega; E2241) was cotransfected into every well to correct for variations in transfection efficiency. Cells were harvested and lysed 48 h after transfection using lysis buffer from the Promega luciferase assay kit (catalog #E1910) and firefly luciferase units quantified (kit luciferase substrate) using the Bio-Rad luminometer followed by measurement of Renilla luciferase units by chemiluminescence (kit Stop& Glo reagent) according to the manufacturer's protocol. Relative luciferase units were calculated relative to minimal TATA box driven luciferase units.
3C-ChIP loop.
Cross-linked nuclei were restriction digested as described in the 3C method using HindIII (NEB) enzyme. Digested restriction fragments were then washed with FSB (20 mm Tris-Cl, pH 7.5, 5 mm EDTA, 50 mm NaCl final concentration) followed by immunoprecipitation (anti-H3K4me3 1 μg/μl; 1:1000 dilution; ab8898, Abcam) at 4°C overnight in FSB with phenyl methyl sulfonyl fluoride (0.1 μm final concentration), dithiothreitol (3 μm final concentration), and benzamidine (0.1 μm final concentration). Antibody–chromatin complexes were then isolated using protein G agarose slurry followed by elution as described previously (Huang et al., 2007). The immunoprecipitated chromatin fragments were then ligated with T4 DNA ligase (Invitrogen) as in the 3C protocol step. Ligated fragments were then reverse cross-linked and digested with Proteinase K (Invitrogen, catalog #25530–031) and purified to generate the 3C-ChIP loop library using phenol/phenol-chloroform extraction followed by ethanol precipitation as in 3C. Quantification of interacting fragments from H3K4me3 ChIP-3C, and for control, IgG-3C and H3K4me3 ChIP-3C (no ligase) libraries was done exactly as for 3C quantification from conventional 3C assays described above. The H3K4me3 ChIP-3C, IgG-3C, and H3K4me3 ChIP-3C (no ligase) assays and libraries were processed in parallel using the same protocol and solutions.
CBP-ChIP.
Chromatin from cerebral cortex from one hemisphere of adult C57BL/6J mice (N = 3) was prepared by formalin crosslinking and sonication as described previously (Jiang et al., 2010), for ChIP with an antibody raised against the C terminus of the cAMP-response element binding protein (CREB)-binding protein (CBP/CREBBP) (Abs c-583, rabbit polyclonal, Santa Cruz Biotechnology). For PCR-based quantifications of ChIP assays, input DNA and immunoprecipitated DNA were amplified by SYBR Green-based real-time PCR. Primers were designed to interrogate four positions in the Gad1 locus, with the following chromosome 2 (mm9) coordinates: (1) 70330778–70330906, −77 kb upstream of the Gad1 TSS; (2) 70352784–70352899, −55 kb to Gad1-TSS; (3) 70399957–70400075 at Gad1-TSS; and (4) 70437331–70437444, +37 kb downstream from Gad1-TSS.
RNA-seq.
RNA was extracted from ∼75–100 mg of gray matter of 6 adult control PFC specimens with Rneasy Lipid Tissue mini kit (catalog #74804, QIAGEN), treated with DNase I, purified, and diluted to 20 ng/μl. Sequencing libraries were prepared according to the NuGen Ovation RNASeq version 2 protocol, and run on the paired-end 50 bp module in Illumina HiSeq 2000 (Eurofins MWG; Operon). RNA-seq raw reads that passed the QC metric, which is called as the “chastity filter” by Illumina, were aligned to the UCSC Homo sapiens reference genome build 19 using TopHat version 1.4.0 default parameters, allowing a maximum of 2 mismatches when mapping reads to the reference and multiple alignments per read (up to 40 by default). Raw reads that passed Illumina's chastity filter varied from 22,470,801 to 60,734,424. TopHat uses the bowtie version 0.12.8 algorithm to perform the alignment in first phase and then identifies potential splice junctions by using these mapping results and aligns previously unmapped reads in second phase to generate alignment files. The resulting aligned bam files were processed by SAMtools (Li et al., 2009), and the read coverage of indexed alignment files for each sample was visualized with the Integrative Genomic Viewer. For intranuclear RNAseq, FACS-sorted neuronal NeuN+ nuclei (Jiang et al., 2008) (>3 × 10⁶) from adult C57BL/6J cerebral cortex were subjected to total RNA isolation using trizol (Invitrogen) reagent. Ribsosomal and other RNAs <200 nt were removed using RNA clean and Concentrator kit (Zymo Research) followed by DNA digestion. A total of 20 ng/μl (10 μl total = 200 ng) RNA was fragmented at 95°C for 5 min using Invitrogen fragmentation buffer (from SuperScript III). First-strand synthesis was performed using Random primer (Invitrogen; catalog #48190011) and Superscript III. First-strand cDNA was cleaned using Ampure XP beads followed by second-strand synthesis using dUTP mixture (dUTP 20 mm, dATP, dCTP, dGTP 10 mm) and DNA polymerase I (10U/μl, NEB). Double-stranded cDNA was end-repaired using Klenow DNA polymerase END-repair kit (Epicenter) followed by A-tailing and adapter ligation. Ampure XP beads were again used to purify the adapter ligated double-stranded DNA followed by Uracil-DNA Glycosylase (NEB, M0280S) incubation to remove dUTP containing second strand. Strand-specific single-stranded DNA was again purified using Ampure XP beads followed by PCR using adapter specific barcoded PCR primers. Purified library was confirmed using bioanalyzer high-sensitive DNA ChiP analysis followed by deep-sequencing using Illumina multiplexing protocol and bioinformatical analyses as described above.
Statistical methods.
Data comparing two groups were analyzed with two-tailed t tests, paired or unpaired, where appropriate. Data on GAD1 RNA expression in PFC versus fibroblasts (FIB) was analyzed using the Wilcoxon signed rank test. Data with more than two groups were analyzed by one-way ANOVA having either “locus” or for the picrotoxin/tetrodoxin-based neuronal activity experiments “treatment” as between group factors, followed by Bonferroni′s multiple-comparison test. The 3C data from mouse cortex of animals subjected to systemic administration of saline versus haloperidol or clozapine were analyzed by two-way ANOVA having “locus” and “treatment” as between group factors, followed by Tukey′s honest significant difference test.
Results
Tissue-specific chromosomal architectures at GAD1 (chromosome 2q31) locus
Cortical gray matter from the rostral frontal lobe of four adult postmortem specimens, ranging in (1) age from 58 to 81 years, (2) postmortem interval 7–11 h, and (3) tissue pH 6.1–7.2 was used to prepare 3C libraries from DNA ligase-treated HindIII digests, to map and quantify physical interactions of noncontiguous DNA elements by PCR. Together, we explored 200 kb on chromosome 2 (171,573,000–171,797,000; HG19) surrounding the GAD1 TSS (Fig. 1A).
Physical interaction frequencies from our PFC 3C assays are shown in Figure 1B. Because chromatin fibers are flexible, resulting in much higher interactions of neighboring restriction fragments within 20–25 kb range in 3C assays (Gheldof et al., 2006; Miele et al., 2006), we primarily interrogated physical interactions of GAD1 TSS with DNA sequences that on the linear genome are positioned >25 kB from the TSS. With the anchor primer on the 11.6 kb HindIII fragment harboring GAD1 TSS (Fig. 1B, green box), the 3C assays from the PFC consistently revealed in 4 of 4 specimens a robust interaction with a restriction fragment positioned −50 kb upstream of the TSS (red box in Fig. 1B). This interaction was highly significant in the PFC (F(9,30) = 3021, p < 0.001 with Bonferroni's post hoc for multiple comparisons) and tissue specific because no evidence for this chromosomal looping was found in 3C assays from cultured fibroblasts from two unrelated donors (Fig. 1B). In contrast to these brain/fibroblast differences in GAD1 higher-order chromatin, the physical interaction of noncontiguous DNA elements across a 75 kb intergenic portion on chromosome 16 were similar between PFC and fibroblasts (mean ± SEM: PFC, 0.30 ± 0.02; fibroblasts 0.32 ± 0.01). Importantly, no PCR product was observed in PFC 3C assays from the same samples when processed without the critical DNA ligase step (which conjugates noncontiguous DNA elements) before phenol extraction and DNA purification (Fig. 1B). These findings, together, strongly suggest that chromosome 2q31 in human PFC, but not fibroblasts, includes a loop formation (referred to as GAD1-TSS-50kbLoop hereafter) between the GAD1 TSS with intergenic sequences positioned ∼50 kb further upstream.
We noticed that both the GAD1 TSS and its looping partner sequences positioned 50 kb upstream of GAD1 were epigenetically decorated with sharp peaks for histone H3 trimethylated at lysine 4 (H3K4me3) in neuronal chromatin extracted from prefrontal cortex (Cheung et al., 2010) (Fig. 1A). The H3K4me3 modification is an epigenetic mark sharply regulated around TSSs and other regulatory sequences associated with open chromatin and active gene expression (Guenther et al., 2005, 2007). In human cerebral cortex, the H3K4me3 mark shows a preference for CpG enriched sequences, specifically those not tagged by DNA cytosine methylation and repressive histone marks (Maunakea et al., 2010). The H3K4me3 peak at the GAD1 TSS (Fig. 1A) extended across 2.5 kb (HG19, chromosome 2: 171,672,200–171,674,500) and included all alternative gene proximal promoters previously associated with GAD1 expression (Chen et al., 2011). Furthermore, the −50 kb upstream sequence was defined by sharp peaks of histone H3 acetylated at lysine 27 (H3K27ac) in conjunction with a corresponding spike of histone H3 monomethylated at lysine 4 (H3K4me1) in ENCODE ChIP-seq tracks for H1 human embryonic stem cells (H1ESC), and the human umbilical vein endothelial and K562 erythroblastoid cell lines (Dunham et al., 2012) (Fig. 1A). Intriguingly, in tissue homogenates from frontal cortex and hippocampus and in cultured neurons, the 50 kb upstream fragment interacting with GAD1 TSS showed similar types of enrichment for H3K4me1 and H3K27 (Fig. 2A, browser tracks were loaded with data from Zhu et al., 2013). Of note, such sharp peaks of H3K27ac in conjunction with H3K4me1 and H3K4me3 often define DNA elements that function as enhancers and regulate gene expression at sites of promoters positioned further upstream or downstream (Barski et al., 2007; Maston et al., 2012). Therefore, we hypothesized that GAD1-TSS-50kbLoop is associated with the open chromatin fraction from the PFC, specifically with the H3K4me3-tagged GAD1 TSS interacting with nucleosomes positioned 50 kb further upstream that are epigenetically decorated with the same mark. In support of this hypothesis, GAD1-TSS-50kbLoop was readily detectable in PFC, a tissue with robust levels of GAD1 gene expression, in contrast to fibroblasts, which lack both the loop and detectable levels of GAD1 gene transcript (Fig. 1B,C). To test this hypothesis directly, we used3C-ChIP Loop (Simonis et al., 2007), which is a modified version of the 3C approach to study chromosomal loopings in selected chromatin fractions enriched by immunoprecipitation. To this end, we immunoprecipitated HindIII digested chromatin from human PFC with anti-H3K4me3 antibody followed by PCR to interrogate ligation products representing GAD1-TSS-50kbLoop (Fig. 1D). Indeed, pulldown with anti-H3K4me3 antibody resulted in much stronger enrichment for GAD1-TSS-50kbLoop compared with pulldown with IgG control; furthermore, no PCR products from noncontiguous DNA sequences were observed in 3C-ChIP Loop experiments without ligase (Fig. 1D). We conclude that GAD1-TSS-50kbLoop is a higher-order chromatin structure in which at least one or both sides of the loop are enriched with the H3K4me3 mark.
Figure 2.

Epigenetic and transcriptional landscapes at the GAD1 (chromosome 2q31) locus. A, Browser tracks (ChIP-seq) showing (top to bottom) H3K4me1 landscape at GAD1 locus (2q31) in cultured neurons (N), and H3 acetylated at lysine 27 (H3K27ac) in hippocampal (Hi) and PFC and cingulate gyrus (CG) postmortem tissue, based on datasets from Zhu et al. (2013). There is a sharp histone acetylation and methylation peak at interacting DNA sequences (red and green boxes) of chromosomal loop, GAD1-TSS-50kbLoop described in Figure 1. B, Browser tracks (RNAseq) from total RNA extracts from PFC of six adult controls (see Materials and Methods). In this portion of 2q31, RNA tags exclusively arise from GAD1 gene, whereas upstream sequences lack signal above background.
DNA elements in GAD1-TSS-50kbLoop facilitate transcription
As discussed above, the loop formation in chromosome 2q31, resulting in a physical interaction between the sequences surrounding the GAD1 TSS with DNA positioned 50 kb further upstream, is associated with GAD1 gene expression and open chromatin-associated histone methylation and acetylation in human PFC. Of note, the interacting DNA upstream of GAD1 is associated with sharp histone modification peaks associated with enhancer functions, including H3K27ac and H3K4me1 in peripheral cell lines and H3K4me3 in PFC neurons, but in the absence of detectable (above background) cis-associated transcript at the peak site (Fig. 1A, red box; Fig. 2A) in our deeply sequenced total RNA extracts from PFC of six control subjects (Fig. 2B). These findings, together, would suggest that the upstream components of GAD1-TSS-50kbLoop function most likely as enhancers by facilitating transcription when brought in proximal position to a gene promoter. To explore this, we focused on 115 bp (chromosome 2: 171622200–171622315, HG19) which, based on TFSearch (http://www.cbrc.jp/research/db/TFSEARCH.html) (Heinemeyer et al., 1998), was highly enriched for a total of seven activating protein AP-1 early response transcription factor motifs (TGAG/CTCA), reflecting a much higher AP-1 motif density, or 60 AP-1 sites/kb, compared with the surrounding 15 kb with only 1.2 AP-1 sites/kb. The AP-1 motif is thought to mediate a significant portion of activity-dependent gene expression both in human and rodent PFC (Covington et al., 2010). We fused this 115 bp sequence 5′ from a minimal promoter sequence and explored changes in transcriptional activity with a luciferase assay in HEK-293 cells. Indeed, in 3 of 3 experiments, addition of the 100 bp element resulted in a robust, >10-fold increase in luciferase expression and activity, compared with a control sequence void of AP-1 motifs (Fig. 3). These findings support the hypothesis that GAD1-TSS-50kbLoop plays a role in the regulation of GAD1 transcription, by positioning upstream enhancer sequences in close proximity to GAD1 TSS.
Figure 3.

Intergenic DNA elements upstream of GAD1 facilitate transcription. A, Schematic description of luciferase reporter assay for 100 bp AP1-rich DNA element (chromosome 2: 171622200–171622300) (hg19). B, Bar graphs (mean ± SD, N = 3/group) represent luciferase activity in HEK293 cells expressing control (white) and 100 bp DNA element (red bar). There is an ∼10-fold increase in luciferase promoter fused to the AP1-enriched DNA element. **p < 0.001 (two-tailed t test).
Higher-order chromatin in chromosome 2q31 (GAD1-TSS-50kbLoop) emerges during the course of neural differentiation
The above experiments suggest that physical interactions of open chromatin-associated DNA elements at the GAD1 locus, including GAD1-TSS-50kbLoop, are tissue specific and readily detectable in PFC. Of note, PFC is defined by robust expression of GAD1 RNA, in contrast to skin fibroblasts, which lack both detectable levels of gene expression and a tractable 3D chromosomal architecture at this locus (Fig. 1B,C). To further test the association between GAD1-TSS-50kbLoop and active gene expression, we studied GAD1 higher-order chromatin and gene expression both in induced pluripotent stem cells (which were generated from one of the two fibroblast cultures used for 3C assays shown in Fig. 1B,C) and during their transition into differentiated neural cultures primarily comprised of microtubule-associated protein 2-immunoreactive neurons (Fig. 4A,B). Indeed, GAD1-TSS-50kbLoop, but no other DNA elements across a 220 kb segment of chromosome 2q31, showed a differentiation-induced, significant increase in interaction with the GAD1 TSS (Fig. 4B,C), in conjunction with increased GAD1 RNA expression (Fig. 4D). Levels of GAD1-TSS-50kbLoop in the pluripotent stem cells were ∼50% lower compared with the neural cultures differentiated from them (Fig. 4D), which would be consistent with the notion that pluripotent cells maintain some degree of open chromatin, including histone acetylation and H3K4-trimethylation, at genes poised for expression during subsequent development and differentiation (Vastenhouw and Schier, 2012). The observed increase in GAD1-TSS-50kbLoop structures upon neural differentiation was highly specific for this type of higher-order chromatin because no loop structures were observed in 3C assays from cell cultures without the ligation step (Fig. 4C). Furthermore, the physical interactions of noncontiguous DNA elements across a 75 kb intergenic portion on chromosome 16, which is insensitive to cellular differentiation (Ferraiuolo et al., 2010), were very similar between stem cells (0.31 ± 0.01) and differentiated neural cultures (0.33 ± 0.01).
Figure 4.
Developmental changes in GAD1 gene expression and chromatin architectures. A, Time line for generating of 1.5 × 10⁷ differentiated cells, including a significant portion of microtubule-associated protein 2-immunoreactive cells (green, with blue [DAPI] counterstain) with neuronal morphology from input of 5 × 10⁶ iPS (line W6). B, Physical interactions of HindIII restriction fragments with the GAD1 TSS. There is increased interaction of sequences positioned −50 kb upstream of GAD1 (red) with the TSS (green) in differentiated cells (bottom graph) but not iPS (top graph). C, Representative agarose gels from 156 bp PCR amplicons of primers encompassing GAD1-TSS-50kbLoop with forward primer from −50 kb sequence (red) and reverse primer from GAD1 TSS (green). The specific product is limited to 3C assays with (+) but not without (−) ligase. D, Bar graphs (mean ± SD, N = 3/group) represent levels of (left) GAD1 RNA after normalization to 18S RNA and (right) GAD1-TSS-50kbLoop. **p < 0.001 (two-tailed t test).
GAD1 higher-order chromatin is conserved in rodent and primate species
We noticed that, in mouse cerebral cortex, histone H3K4me3 landscapes around the chromosome 2qC2 Gad1 locus (Fig. 5A) show a striking resemblance to the epigenetic profile encountered in neuronal chromatin from human (Fig. 1A). Both mouse and primate cortex exhibits sharp H3K4me3 peak profiles both at the GAD1/Gad1 TSS and a conserved CpG-rich sequence positioned −55 kb (−50 kb) upstream of Gad1 (GAD1) gene. The CpG-rich sequences at −50 kb from the GAD1 TSS (HG19, chromosome 2: 171,627,226–171,628,062) include a 302 bp sequence that shows 88% sequence homology to mouse (mm9, chromosome 2: 70,347,243–70,347,545). This degree of conservation is much higher than what is expected, given that the 10 kb of surrounding sequence shows a much lower degree, or 47.2%, of sequence conservation (mm9 chromosome 2: 70342243–70352545 to hg19 chromosome 2: 171621775–171629528). Furthermore, as for human PFC (tissue homogenate) (Fig. 2B), RNAseq from neuronal nuclei of mouse cerebral cortex did not reveal evidence for cis-associated transcript at the H3K4me3 peak site positioned −55 kb upstream of Gad1 (mouse chromosome 2qC2) (Fig. 5A, red box). Furthermore, inspection of the H3K4me3 ChIp-seq datasets from PFC neurons and nonhuman primate prefrontal cortex, including macaque and chimpanzee (Shulha et al., 2012b), revealed epigenetic profiles at the Gad1 locus very similar to those observed in human and mouse, with H3K4me3 peaks limited to the Gad1 TSS and the conserved CpG-rich sequence positioned ∼50 kb further upstream: Rhesus macaque genome RM3, chromosome 12: 34110698–34112216 and chimpanzee (Pan troglodytes) genome PT3 chromosome 2B: 175198622–175200113. Given the conserved H3K4me3 landscapes between mouse and primate brains, we hypothesized that 3D genome architectures in mouse cerebral cortex will include a homolog to the aforementioned GAD1-TSS-50kbLoop from the human PFC, with a conserved enhancer sequence positioned 55 kb upstream of Gad1 directly interacting with the Gad1 promoter. Indeed, 3C assays from mouse cerebral cortex consistently revealed highest levels of interaction between the Gad1 TSS and the HindIII restriction fragment harboring the H3K4me3-decorated, CpG-rich sequence positioned ∼55 kb further upstream (Fig. 5A). We conclude that GAD1-TSS-50kbLoop is not unique to (human) chromosome 2q31 because very similar chromatin architectures, including Gad1-TSS-55kbLoop, are observed in mouse brain.
Figure 5.

Gad1 higher-order chromatin is specific for GABAergic neurons and regulated by neuronal activity. A, Epigenetic profiles at 2qC2 (mouse) Gad1 locus in cerebral cortex, showing conservation of key features also found for human (chromosome 2q31.1) GAD1 locus. Mouse cerebral cortex, like human prefrontal cortex (Fig. 1), exhibits sharp H3K4me3 peak profiles both at Gad1 TSS and conserved CpG-rich sequence positioned 55 kb upstream of Gad1 gene. Scale in kilobases for in correspondence with the UCSC Genome Browser map. H3K4me3 ChIP-seq track from mouse cerebral cortex (Dixon et al., 2012), RNAseq track from sorted neuronal (NeuN+) nuclei of adult cortex (see Materials and Methods). RNA expression is limited to Gad1 gene body, whereas signal from upstream sequences does not exceed background. Bar graphs represent physical interactions between Gad1 TSS and noncontiguous DNA elements positioned further upstream, using anchor primer (TSS, green box primer 5′- GCCTTTGGAAACCAGCGTCCTTCAGTGTTT, mm9 chromosome 2: 70406539–70406568) and 4 primer combinations in 3C assays from adult mouse frontal cortex (white represents control group; black, clozapine; shaded, haloperidol; N = 3/group, data are mean ± SD). There are increased interaction frequencies between Gad1 TSS and CpG-rich sequence positioned 55 kb upstream of TSS in each of the 2 treatment and the control groups. B, Fluorescence microscopy showing (a, b) vertical thickness of six-layered (i-vi; wm, White matter) cerebral cortex, (c, d) hippocampus, and (e, f) striatum of adult Gad2–H2BGFP transgenic mouse. The density and distribution of GFP+ nuclei in all major telencephalic areas are consistent with the GABAergic phenotype. Representative examples of GFP+ (g–i) cortical and (j–l) striatal neurons expressing (h, i) calretinin or (k, l) parvalbumin. Scale bars: a, b, 50 μm; c–f, 200 μm; g–l, 20 μm. C, Transgenic Gad2–H2BGFP adult cortex was sorted into GFP+ and GFP− nuclei followed by 3C assays separately for both populations of nuclei, as indicated. Interaction frequency between Mouse Gad1 TSS region and HindIII fragment positioned 55 kb upstream of Gad1 TSS (red box in A, primer 5′-CTGGACTGGACAGTTGCTATTGCTACCTGA, mm9 chromosome 2: 70353571–70353600), both epigenetically decorated with H3K4me3 (A) was quantified by PCR, as indicated. The interaction is specific for GFP+ nuclei. There are very low interaction frequencies in both cell population for control sequence (primer 5′- TGTTTTGTTAGTGGCCTGGACTGCAGACAA, mm9 chromosome 2: 70383641–70383670). D, Activity-dependent regulation of higher-order chromatin at Gad1. Data from primary neuronal culture from mouse hippocampus, (left) Gad1 RNA and (right) 3C assays, showing chromosomal looping connecting TSS with −55 kb upstream DNA elements (B, C) after 15 h of PTX or TTX treatment. N = 3 experiments/group, mean ± SEM, expressed relative to control (DMSO-treated cultures). Gad1 RNA was consistently (3 of 3 experiments) upregulated in PTX-treated cultures and decreased after TTX, whereas Gad1 3C interactions were consistently increased in 3 of 3 experiments after PTX-induced increase in neuronal activity (one-way ANOVA, RNA: F(2,12) = 26.74 (p < 0.001), one sample t test, DMSO versus PTX (p < 0.05), DMSO versus TTX (p < 0.01), 3C F(2,6) = 126.6 (p < 0.001), post hoc Bonferroni DMSO versus PTX (p < 0.001). E, CBP occupancy in chromatin from mouse cerebral cortex, expressed as chip-to-input ratio, at multiple positions at the Gad1 locus, as indicated. CBP levels are significantly increased at −55 kb and the interacting sequences at Gad1-TSS, compared with −77 kb upstream and +37 kb downstream from TSS (N = 3 adult mice, mean ± SD). One-way ANOVA: F(3,8) = 88.76 (p < 0.001). Bonferroni-corrected: *p < 0.01; **p < 0.001).
Gad1-TSS-55kbLoop is specific for GABAergic neuron chromatin and regulated by neuronal activity
Of note, GAD1-TSS-50kbLoop in human is lacking in fibroblasts but highly regulated in brain where it is tightly linked to open chromatin and active expression of the GAD1 gene (Fig. 1B–D) and upregulated during the course of neuronal differentiation (Fig. 4). Therefore, we hypothesized that this chromosomal loop is a defining feature of GABAergic neurons, which in brain are the only cell type expressing high levels of GAD1/GAD67 GABA synthesis enzyme (and of a closely related gene, GAD2/GAD65). To address this question, we first generated BAC transgenic mice expressing GFP-conjugated histone H2B under control of the Gad2 gene promoter. We confirmed widespread expression of the transgene in cortical, hippocampal, and striatal GABAergic neurons (Fig. 5B) and then conducted 3C assays separately for GFP+ and GFP− nuclei collected by fluorescence-activated nuclei sorting from cerebral cortex and hippocampus of adult Gad2-H2BGFP mice. Strikingly, Gad1-TSS-55kbLoop was highly specific for the population of GABAergic (GFP+) nuclei and completely absent in chromatin of non-GABAergic cells (Fig. 5C). This effect was consistently observed in 3 of 3 experiments. Therefore, Gad1-TSS-55kbLoop, a higher-order chromatin structure associated with Gad1 gene expression, is part of the genome architecture specific for GABAergic neurons.
Activity-dependent regulation of Gad1/Gad67 gene expression is important for the orderly balance of inhibition and excitation in the cerebral cortex both in rodent and primates. For example, in monkeys, monocular deprivation of sensory input into visual cortex results after 5 d in a strong and prolonged downregulation of Gad1/Gad67 RNA in the ocular dominance columns innervated by the affected eye (Benson et al., 1994). In the rat, loss of hippocampal pyramidal neurons and hippocampal–prefrontal connectivity results in downregulated Gad1/Gad67 expression in hippocampus (Shetty and Turner, 2001) and prefrontal cortex (Lipska et al., 2003). Decreased Gad1/Gad67 expression, in turn, results in reduced levels of cytosolic GABA levels and lower amplitudes of miniature inhibitory synaptic postsynaptic currents (mIPSCs) (Lau and Murthy, 2012). Given that activity-regulated fine-tuning of Gad1/Gad67 expression is of pivotal importance for homeostatic plasticity both in primate and rodent cerebral cortex, we asked whether higher-order chromatin structures around the GAD1 locus, including GAD1-TSS-50kbLoop and its mouse homolog, Gad1-TSS-55kbLoop are involved in these mechanisms. We explored this question in primary cultures from mouse hippocampus, which were exposed for 15 h either to vehicle (DMSO) or the GABAA receptor antagonist picrotoxin (PTX) (100 μm) to increase general neuronal activity, or the sodium channel blocker TTX (1 μm) for silencing. As expected, Gad1/Gad67 RNA levels were consistently increased (3 of 3 experiments) by 70% in PTX-treated cultures but decrease by ∼40% after TTX, compared with vehicle controls (Fig. 5D). This was associated with a consistent (3 of 3 experiments) 50% increase in physical interactions of the Gad1 TSS with its partnering sequences in Gad1-TSS-55kbLoop after treatment with PTX, compared with vehicle control (Fig. 5D). In contrast, Gad1-TSS-55kbLoop was not affected by TTX treatment. We conclude that Gad1 higher-order chromatin is dynamically regulated upon acute changes in neuronal activity, particularly in the context of increased excitation.
Our results show that DNA elements positioned 50 (human) or 55 (mouse) kb upstream of GAD1/Gad1 facilitate transcription and engage in a loop formation with the gene's TSS that is upregulated upon increased neuronal activity and transcription. Therefore, we hypothesized that both portions of the loop, including chromatin at site of the Gad1 TSS and its partnering sequences positioned −55 kb further upstream, show increased occupancy for proteins, such as the CREB-binding protein and histone acetyltransferase, CREBBP/CBP, which, like its close homolog EP300, acts as a broad facilitator of gene expression (Alarcon et al., 2004; Korzus et al., 2004; Wood et al., 2006; Kim et al., 2010). To explore this, we conducted ChIP assays on adult mouse cerebral cortex and measured CBP binding in Gad1-TSS-55kbLoop chromatin and additional positions in chromosome 2qC2. Indeed, CBP load was significantly higher at the Gad1-TSS and its partnering sequences −55 kb further upstream, compared with chromatin positioned −77 kb upstream, or +37 kb downstream from the TSS (Fig. 5E).
Decreased GAD1-TSS-50kbLoop in prefrontal cortex of subjects with schizophrenia
Subjects on the mood and psychosis spectrum, including many cases diagnosed with schizophrenia or bipolar disorder, are frequently affected by dysregulated gene expression in GABAergic interneurons in multiple brain regions (Guidotti et al., 2000; Konradi et al., 2011b). In the PFC (in particular, 30% or 40% of subjects with schizophrenia) are affected by a robust deficit in GAD1/GAD67 gene expression (Volk et al., 2012). Consistent with this observation, open chromatin-associated histone modifications, including trimethylation of H3K4 and acetylation of other lysine residues, are decreased in nucleosomes surrounding the GAD1 TSS in the PFC of a subset of cases with schizophrenia (Huang et al., 2007; Tang et al., 2009). Given that the murine homolog of GAD1-TSS-50kbLoop is specific for GABAergic neuron chromatin (Fig. 5C), and given the tight coregulation of this loop with GAD1/Gad1 expression both in and ex vivo in the human and the mouse (Figs. 1B–D, 4D, and 5D), we hypothesized that this type of higher-order chromatin is altered in cases with schizophrenia that are affected by loss of GAD1 gene expression. To explore this, we conducted 3C assays on PFC tissue of 10 cases with schizophrenia and 7 controls, including 5 case-control pairs (matched for age/gender/autolysis time) previously found to show decreased GAD1/GAD67 RNA expression and H3K4 trimethylation in the disease case (Huang et al., 2007). Indeed, comparison of the general cohort of schizophrenics and controls, and separate analyses of the 5 case-control pairs revealed a significant (at least 35–45%) decrease in physical interaction frequencies between the GAD1-TSS and its partnering sequences positioned −50 kb further upstream (Fig. 6A,B). Consistent with the findings from the aforementioned postmortem studies that loss of transcription-associated epigenetic decorations of sequences GAD1 TSS are not caused by antipsychotic medication (Huang et al., 2007; Tang et al., 2009), no quantitative changes in the strength of Gad1-TSS-55kbLoop were observed in cerebral cortex of mice chronically treated with the conventional antipsychotic and dopamine D2-like receptor antagonist, or atypical antipsychotic clozapine (Fig. 5A).
Figure 6.

Higher-order GAD1 chromatin is altered in PFC of subjects with schizophrenia. GAD1-TSS-50kbLoop in PFC, as measured by PCR for GAD1 TSS with −50 kb upstream sequences. Top, Bar graph, Mean 3C interaction on y-axis generated from N = 10 subjects with schizophrenia (SCZ) compared with N = 7 controls. **p < 0.001 (two-tailed t test). Bottom, Bar graph represents 3C interaction difference between N = 5 SCZ-control pairs matched for age, gender, and autolysis time. There are significant differences between schizophrenia and control group: p < 0.05 (two-tailed t test).
Discussion
Summary of results
Mapping physical interactions of noncontiguous DNA elements across 200 kb surrounding the GAD1/GAD67 GABA synthesis enzyme gene locus in human PFC, we discovered a loop formation GAD1-TSS-50kbLoop. The existence of GAD1-TSS-50kbLoop, and Gad1-TSS-55kbLooop, as its mouse homolog, provides testimony for actively regulated higher-order chromatin structures in the human brain because GAD1-TSS-50kbLoop was absent in 3C assays in which the critical DNA ligase step was omitted; furthermore, the loop was coregulated with GAD1 gene expression and therefore much stronger in cultured neurons compared with their undifferentiated precursors or the donors' skin fibroblasts. In mature cerebral cortex, the Gad genes are selectively transcribed in cortical interneurons; and indeed, our 3C assays on sorted nuclei revealed that Gad1-TSS-55kbLoop was specific for GABAergic neurons. These findings, together, suggest that GAD1-TSS-50kbLoop serves as a classical promoter/enhancer loop (Ong and Corces, 2011), by moving conserved DNA elements positioned 50 kb upstream of GAD1 into close proximity with the gene's TSS to facilitate its expression. In support of this model, the upstream interacting sequences are decorated with sharp peaks of histone H3 acetylated at lysine 27 (H3K27ac) in conjunction with monomethyl and trimethyl H3K4 (H3K4me1/3), which is of interest because co-occurrence of these histone modifications often defines enhancer elements (Barski et al., 2007; Zhou et al., 2011; Maston et al., 2012). In addition, we observed increased occupancy of the transcriptional facilitator, CBP/CREBBP, a protein that on a genome-wide scale preferentially locates both to gene proximal promoters and enhancers (Visel et al., 2009; Kim et al., 2010), at the two interacting sequences in Gad1-TSS-55kbLoop. Furthermore, we deeply sequenced in the present study total RNA from tissue homogenates of human PFC, and from mouse cortex neuronal nuclei, and observed that none of the upstream DNA elements in GAD1-TSS-50kbLoop and Gad1-TSS-55kbLoop was transcribed in the cortex. Instead, these sequences harbored AP-1 transcription factor motifs; and, as expected for an enhancer sequence, when fused to generic promoters, we observed increased expression of the luciferase reporter.
Implications for the neurobiology of schizophrenia
Chromosomal loopings, including the GAD1-TSS-50kbLoop described here, are among the most highly regulated supranucleosomal structures and pivotal for transcriptional regulation, by enabling distal regulatory enhancer or silencer elements positioned a few or many hundred kilobases apart from a gene, to interact directly with that specific promoter (Gaszner and Felsenfeld, 2006; Wood et al., 2010). Surprisingly, however, only very few studies explored loop formations in brain tissue (Horike et al., 2005; Dhar et al., 2009; Jiang et al., 2010; Yasui et al., 2011; Shen et al., 2012; Shulha et al., 2012b). Our study is the first to (1) monitor the emergence of higher-order chromatin at a GABAergic gene locus during the process of neural differentiation, and demonstrate that epigenetic architectures, including a specific promoter/enhancer loop, are (2) conserved between rodent and primate (including human) Gad1/GAD1, (3) sensitive to changes in neuronal activity, and (4) significantly dysregulated in PFC of subjects with schizophrenia affected by loss of GAD1 gene expression. It remains to be determined whether the weakening of prefrontal GAD1-TSS-50kbLoop in a specific disease case is the result of genetic factors (including the GAD1 risk haplotypes in selected populations) (Addington et al., 2005; Lundorf et al., 2005; Straub et al., 2007; Ayalew et al., 2012) or the outcome of a developmental defect (Benes, 2012) or altered glutamate NMDA receptor signaling (Behrens et al., 2007; Homayoun and Moghaddam, 2007; Lisman et al., 2008; Belforte et al., 2010) or simply an adaptive response to cortical dysfunction, or combination thereof. In either case, a prolonged decrease of GAD1 is likely to be detrimental for higher cognitive function and the inhibitory networks in the cortex, given that Gad1 is important for homeostatic synaptic scaling by controlling GABA release and mIPSCs (Lau and Murthy, 2012), and the orderly formation of perisomatic innervation of cortical pyramidal neurons and basket neuron innervation fields in the adolescent cortex (Chattopadhyaya et al., 2007). Furthermore, GAD1 shares genetic risk factors that lead to alterations in the expression of the cation chloride cotransporters NKCC1/KCC2, which are of pivotal importance for the fine-tuning the inhibitory/excitatory effects of postsynaptic GABAA receptor-mediated currents (Hyde et al., 2011).
Outlook
In the present study, we first mapped physical interactions between noncontiguous DNA elements in postmortem brain specimens collected several hours after death, then explored these types of higher-order chromatin in cell culture and animal models. The implications of our study, when viewed as a proof of principle, are obvious: Only 1% of the human genome encodes protein. However, the vast majority of noncoding sequences are engaged in various open and repressive higher-order chromatin structures involved in genome organization and function (Lieberman-Aiden et al., 2009), but in the human brain these mechanisms until now remain completely unexplored. Because both the intergenic portions of the genome and its intronic sequences each harbor at least 40% of DNA polymorphisms and structural variants associated with complex traits and common medical (including psychiatric) conditions (Stranger et al., 2011), the findings presented here will pave the way for a more comprehensive mapping of 3D genome architectures in normal and diseased human brain. Such type of information, in conjunction with genome-wide DNA methylation and histone modification mappings (Mill et al., 2008; Kano et al., 2012; Labonte et al., 2012; Numata et al., 2012; Shulha et al., 2012a; Guintivano et al., 2013), will provide deep insights into the coordinated regulation of the epigenetic landscape of neuronal and glial genomes, including the role of DNA sequence variants, in specific disease cases diagnosed with schizophrenia and other psychiatric disease. Finally, the observation that the GAD1-associated chromosomal loop and the H3K4 trimethylation landscape associated with it are conserved between rodent and primate brain would suggest that higher-order chromatin, just as recently reported for DNA methylation, histone regulation, and transcription factor occupancies, shows robust homologies between species from different mammalian lineages (Xiao et al., 2012). Thus, the “genome in 3D” is fully open to study in human brain and preclinical models alike.
Footnotes
This work was supported by National Institutes of Health Grants R01 MH09332, R21NS076958, and P50MH096890, and by the Brain & Behavior Research Foundation. We thank Dr. Yin Guo for excellent technical assistance.
The authors declare no competing financial interests.
References
- Addington AM, Gornick M, Duckworth J, Sporn A, Gogtay N, Bobb A, Greenstein D, Lenane M, Gochman P, Baker N, Balkissoon R, Vakkalanka RK, Weinberger DR, Rapoport JL, Straub RE. GAD1 (2q31.1), which encodes glutamic acid decarboxylase (GAD67), is associated with childhood-onset schizophrenia and cortical gray matter volume loss. Mol Psychiatry. 2005;10:581–588. doi: 10.1038/sj.mp.4001599. [DOI] [PubMed] [Google Scholar]
- Akbarian S, Huang HS. Molecular and cellular mechanisms of altered GAD1/GAD67 expression in schizophrenia and related disorders. Brain Res Rev. 2006;52:293–304. doi: 10.1016/j.brainresrev.2006.04.001. [DOI] [PubMed] [Google Scholar]
- Akbarian S, Kim JJ, Potkin SG, Hagman JO, Tafazzoli A, Bunney WE, Jr, Jones EG. Gene expression for glutamic acid decarboxylase is reduced without loss of neurons in prefrontal cortex of schizophrenics. Arch Gen Psychiatry. 1995;52:258–266. doi: 10.1001/archpsyc.1995.03950160008002. [DOI] [PubMed] [Google Scholar]
- Alarcón JM, Malleret G, Touzani K, Vronskaya S, Ishii S, Kandel ER, Barco A. Chromatin acetylation, memory, and LTP are impaired in CBP+/− mice: a model for the cognitive deficit in Rubinstein-Taybi syndrome and its amelioration. Neuron. 2004;42:947–959. doi: 10.1016/j.neuron.2004.05.021. [DOI] [PubMed] [Google Scholar]
- Ayalew M, Le-Niculescu H, Levey DF, Jain N, Changala B, Patel SD, Winiger E, Breier A, Shekhar A, Amdur R, Koller D, Nurnberger JI, Corvin A, Geyer M, Tsuang MT, Salomon D, Schork NJ, Fanous AH, O'Donovan MC, Niculescu AB. Convergent functional genomics of schizophrenia: from comprehensive understanding to genetic risk prediction. Mol Psychiatry. 2012;17:887–905. doi: 10.1038/mp.2012.37. [DOI] [PMC free article] [PubMed] [Google Scholar]
- Barski A, Cuddapah S, Cui K, Roh TY, Schones DE, Wang Z, Wei G, Chepelev I, Zhao K. High-resolution profiling of histone methylations in the human genome. Cell. 2007;129:823–837. doi: 10.1016/j.cell.2007.05.009. [DOI] [PubMed] [Google Scholar]
- Behrens MM, Ali SS, Dao DN, Lucero J, Shekhtman G, Quick KL, Dugan LL. Ketamine-induced loss of phenotype of fast-spiking interneurons is mediated by NADPH-oxidase. Science. 2007;318:1645–1647. doi: 10.1126/science.1148045. [DOI] [PubMed] [Google Scholar]
- Belforte JE, Zsiros V, Sklar ER, Jiang Z, Yu G, Li Y, Quinlan EM, Nakazawa K. Postnatal NMDA receptor ablation in corticolimbic interneurons confers schizophrenia-like phenotypes. Nat Neurosci. 2010;13:76–83. doi: 10.1038/nn.2447. [DOI] [PMC free article] [PubMed] [Google Scholar]
- Benes FM. A new paradigm for understanding gamma-aminobutyric acid cell pathology in schizophrenia? Biol Psychiatry. 2012;72:712–713. doi: 10.1016/j.biopsych.2012.09.003. [DOI] [PubMed] [Google Scholar]
- Benson DL, Huntsman MM, Jones EG. Activity-dependent changes in GAD and preprotachykinin mRNAs in visual cortex of adult monkeys. Cereb Cortex. 1994;4:40–51. doi: 10.1093/cercor/4.1.40. [DOI] [PubMed] [Google Scholar]
- Brewer GJ, Torricelli JR, Evege EK, Price PJ. Optimized survival of hippocampal neurons in B27-supplemented Neurobasal, a new serum-free medium combination. J Neurosci Res. 1993;35:567–576. doi: 10.1002/jnr.490350513. [DOI] [PubMed] [Google Scholar]
- Chattopadhyaya B, Di Cristo G, Wu CZ, Knott G, Kuhlman S, Fu Y, Palmiter RD, Huang ZJ. GAD67-mediated GABA synthesis and signaling regulate inhibitory synaptic innervation in the visual cortex. Neuron. 2007;54:889–903. doi: 10.1016/j.neuron.2007.05.015. [DOI] [PMC free article] [PubMed] [Google Scholar]
- Chen Y, Dong E, Grayson DR. Analysis of the GAD1 promoter: trans-acting factors and DNA methylation converge on the 5′ untranslated region. Neuropharmacology. 2011;60:1075–1087. doi: 10.1016/j.neuropharm.2010.09.017. [DOI] [PubMed] [Google Scholar]
- Cheung I, Shulha HP, Jiang Y, Matevossian A, Wang J, Weng Z, Akbarian S. Developmental regulation and individual differences of neuronal H3K4me3 epigenomes in the prefrontal cortex. Proc Natl Acad Sci U S A. 2010;107:8824–8829. doi: 10.1073/pnas.1001702107. [DOI] [PMC free article] [PubMed] [Google Scholar]
- Covington HE, 3rd, Lobo MK, Maze I, Vialou V, Hyman JM, Zaman S, LaPlant Q, Mouzon E, Ghose S, Tamminga CA, Neve RL, Deisseroth K, Nestler EJ. Antidepressant effect of optogenetic stimulation of the medial prefrontal cortex. J Neurosci. 2010;30:16082–16090. doi: 10.1523/JNEUROSCI.1731-10.2010. [DOI] [PMC free article] [PubMed] [Google Scholar]
- Dekker J. The three ‘C’ s of chromosome conformation capture: controls, controls, controls. Nat Methods. 2006;3:17–21. doi: 10.1038/nmeth823. [DOI] [PubMed] [Google Scholar]
- Deng W, Blobel GA. Do chromatin loops provide epigenetic gene expression states? Curr Opin Genet Dev. 2010;20:548–554. doi: 10.1016/j.gde.2010.06.007. [DOI] [PMC free article] [PubMed] [Google Scholar]
- Dhar SS, Ongwijitwat S, Wong-Riley MT. Chromosome conformation capture of all 13 genomic loci in the transcriptional regulation of the multisubunit bigenomic cytochrome C oxidase in neurons. J Biol Chem. 2009;284:18644–18650. doi: 10.1074/jbc.M109.019976. [DOI] [PMC free article] [PubMed] [Google Scholar]
- Dhara SK, Hasneen K, Machacek DW, Boyd NL, Rao RR, Stice SL. Human neural progenitor cells derived from embryonic stem cells in feeder-free cultures. Differentiation. 2008;76:454–464. doi: 10.1111/j.1432-0436.2007.00256.x. [DOI] [PubMed] [Google Scholar]
- Dixon JR, Selvaraj S, Yue F, Kim A, Li Y, Shen Y, Hu M, Liu JS, Ren B. Topological domains in mammalian genomes identified by analysis of chromatin interactions. Nature. 2012;485:376–380. doi: 10.1038/nature11082. [DOI] [PMC free article] [PubMed] [Google Scholar]
- Dunham I, Kundaje A, Aldred SF, Collins PJ, Davis CA, Doyle F, Epstein CB, Frietze S, Harrow J, Kaul R, Khatun J, Lajoie BR, Landt SG, Lee BK, Pauli F, Rosenbloom KR, Sabo P, Safi A, Sanyal A, Shoresh N, et al. An integrated encyclopedia of DNA elements in the human genome. Nature. 2012;489:57–74. doi: 10.1038/nature11247. [DOI] [PMC free article] [PubMed] [Google Scholar]
- Fatemi SH, Hossein Fatemi S, Stary JM, Earle JA, Araghi-Niknam M, Eagan E. GABAergic dysfunction in schizophrenia and mood disorders as reflected by decreased levels of glutamic acid decarboxylase 65 and 67 kDa and Reelin proteins in cerebellum. Schizophr Res. 2005;72:109–122. doi: 10.1016/j.schres.2004.02.017. [DOI] [PubMed] [Google Scholar]
- Ferraiuolo MA, Rousseau M, Miyamoto C, Shenker S, Wang XQ, Nadler M, Blanchette M, Dostie J. The three-dimensional architecture of Hox cluster silencing. Nucleic Acids Res. 2010;38:7472–7484. doi: 10.1093/nar/gkq644. [DOI] [PMC free article] [PubMed] [Google Scholar]
- Fung SJ, Webster MJ, Sivagnanasundaram S, Duncan C, Elashoff M, Weickert CS. Expression of interneuron markers in the dorsolateral prefrontal cortex of the developing human and in schizophrenia. J Psychiatry. 2010;167:1479–1488. doi: 10.1176/appi.ajp.2010.09060784. [DOI] [PubMed] [Google Scholar]
- Futai K, Doty CD, Baek B, Ryu J, Sheng M. Specific trans-synaptic interaction with inhibitory interneuronal neurexin underlies differential ability of neuroligins to induce functional inhibitory synapses. J Neurosci. 2013;33:3612–3623. doi: 10.1523/JNEUROSCI.1811-12.2013. [DOI] [PMC free article] [PubMed] [Google Scholar]
- Gaszner M, Felsenfeld G. Insulators: exploiting transcriptional and epigenetic mechanisms. Nat Rev Genet. 2006;7:703–713. doi: 10.1038/nrg1925. [DOI] [PubMed] [Google Scholar]
- Gheldof N, Tabuchi TM, Dekker J. The active FMR1 promoter is associated with a large domain of altered chromatin conformation with embedded local histone modifications. Proc Natl Acad Sci U S A. 2006;103:12463–12468. doi: 10.1073/pnas.0605343103. [DOI] [PMC free article] [PubMed] [Google Scholar]
- Grayson DR, Guidotti A. The dynamics of DNA methylation in schizophrenia and related psychiatric disorders. Neuropsychopharmacology. 2013;38:138–166. doi: 10.1038/npp.2012.125. [DOI] [PMC free article] [PubMed] [Google Scholar]
- Guenther MG, Jenner RG, Chevalier B, Nakamura T, Croce CM, Canaani E, Young RA. Global and Hox-specific roles for the MLL1 methyltransferase. Proc Natl Acad Sci U S A. 2005;102:8603–8608. doi: 10.1073/pnas.0503072102. [DOI] [PMC free article] [PubMed] [Google Scholar]
- Guenther MG, Levine SS, Boyer LA, Jaenisch R, Young RA. A chromatin landmark and transcription initiation at most promoters in human cells. Cell. 2007;130:77–88. doi: 10.1016/j.cell.2007.05.042. [DOI] [PMC free article] [PubMed] [Google Scholar]
- Guidotti A, Auta J, Davis JM, Di-Giorgi-Gerevini V, Dwivedi Y, Grayson DR, Impagnatiello F, Pandey G, Pesold C, Sharma R, Uzunov D, Costa E, DiGiorgi Gerevini V. Decrease in reelin and glutamic acid decarboxylase67 (GAD67) expression in schizophrenia and bipolar disorder: a postmortem brain study. Arch Gen Psychiatry. 2000;57:1061–1069. doi: 10.1001/archpsyc.57.11.1061. [DOI] [PubMed] [Google Scholar]
- Guintivano J, Aryee MJ, Kaminsky ZZ. A cell epigenotype specific model for the correction of brain cellular heterogeneity bias and its application to age, brain region and major depression. Epigenetics. 2013;8:290–302. doi: 10.4161/epi.23924. [DOI] [PMC free article] [PubMed] [Google Scholar]
- Heinemeyer T, Wingender E, Reuter I, Hermjakob H, Kel AE, Kel OV, Ignatieva EV, Ananko EA, Podkolodnaya OA, Kolpakov FA, Podkolodny NL, Kolchanov NA. Databases on transcriptional regulation: TRANSFAC, TRRD and COMPEL. Nucleic Acids Res. 1998;26:362–367. doi: 10.1093/nar/26.1.362. [DOI] [PMC free article] [PubMed] [Google Scholar]
- Homayoun H, Moghaddam B. NMDA receptor hypofunction produces opposite effects on prefrontal cortex interneurons and pyramidal neurons. J Neurosci. 2007;27:11496–11500. doi: 10.1523/JNEUROSCI.2213-07.2007. [DOI] [PMC free article] [PubMed] [Google Scholar]
- Horike S, Cai S, Miyano M, Cheng JF, Kohwi-Shigematsu T. Loss of silent-chromatin looping and impaired imprinting of DLX5 in Rett syndrome. Nat Genet. 2005;37:31–40. doi: 10.1038/ng1491. [DOI] [PubMed] [Google Scholar]
- Huang HS, Matevossian A, Whittle C, Kim SY, Schumacher A, Baker SP, Akbarian S. Prefrontal dysfunction in schizophrenia involves mixed-lineage leukemia 1-regulated histone methylation at GABAergic gene promoters. J Neurosci. 2007;27:11254–11262. doi: 10.1523/JNEUROSCI.3272-07.2007. [DOI] [PMC free article] [PubMed] [Google Scholar]
- Hyde TM, Lipska BK, Ali T, Mathew SV, Law AJ, Metitiri OE, Straub RE, Ye T, Colantuoni C, Herman MM, Bigelow LB, Weinberger DR, Kleinman JE. Expression of GABA signaling molecules KCC2, NKCC1, and GAD1 in cortical development and schizophrenia. J Neurosci. 2011;31:11088–11095. doi: 10.1523/JNEUROSCI.1234-11.2011. [DOI] [PMC free article] [PubMed] [Google Scholar]
- Jiang Y, Matevossian A, Huang HS, Straubhaar J, Akbarian S. Isolation of neuronal chromatin from brain tissue. BMC Neurosci. 2008;9:42. doi: 10.1186/1471-2202-9-42. [DOI] [PMC free article] [PubMed] [Google Scholar]
- Jiang Y, Jakovcevski M, Bharadwaj R, Connor C, Schroeder FA, Lin CL, Straubhaar J, Martin G, Akbarian S. Setdb1 histone methyltransferase regulates mood-related behaviors and expression of the NMDA receptor subunit NR2B. J Neurosci. 2010;30:7152–7167. doi: 10.1523/JNEUROSCI.1314-10.2010. [DOI] [PMC free article] [PubMed] [Google Scholar]
- Kano S, Colantuoni C, Han F, Zhou Z, Yuan Q, Wilson A, Takayanagi Y, Lee Y, Rapoport J, Eaton W, et al. Genome-wide profiling of multiple histone methylations in olfactory cells: further implications for cellular susceptibility to oxidative stress in schizophrenia. Mol Psychiatry 2012. 2012 doi: 10.1038/mp.2012.120. doi: 10.1038/mp.2012.120. Advance online publication Retrieved Aug 28, 2012. [DOI] [PMC free article] [PubMed] [Google Scholar]
- Kim TK, Hemberg M, Gray JM, Costa AM, Bear DM, Wu J, Harmin DA, Laptewicz M, Barbara-Haley K, Kuersten S, Markenscoff-Papadimitriou E, Kuhl D, Bito H, Worley PF, Kreiman G, Greenberg ME. Widespread transcription at neuronal activity-regulated enhancers. Nature. 2010;465:182–187. doi: 10.1038/nature09033. [DOI] [PMC free article] [PubMed] [Google Scholar]
- Konradi C, Yang CK, Zimmerman EI, Lohmann KM, Gresch P, Pantazopoulos H, Berretta S, Heckers S. Hippocampal interneurons are abnormal in schizophrenia. Schizophr Res. 2011a;131:165–173. doi: 10.1016/j.schres.2011.06.007. [DOI] [PMC free article] [PubMed] [Google Scholar]
- Konradi C, Zimmerman EI, Yang CK, Lohmann KM, Gresch P, Pantazopoulos H, Berretta S, Heckers S. Hippocampal interneurons in bipolar disorder. Arch Gen Psychiatry. 2011b;68:340–350. doi: 10.1001/archgenpsychiatry.2010.175. [DOI] [PMC free article] [PubMed] [Google Scholar]
- Korzus E, Rosenfeld MG, Mayford M. CBP histone acetyltransferase activity is a critical component of memory consolidation. Neuron. 2004;42:961–972. doi: 10.1016/j.neuron.2004.06.002. [DOI] [PMC free article] [PubMed] [Google Scholar]
- Labonté B, Suderman M, Maussion G, Navaro L, Yerko V, Mahar I, Bureau A, Mechawar N, Szyf M, Meaney MJ, Turecki G. Genome-wide epigenetic regulation by early-life trauma. Arch Gen Psychiatry. 2012;69:722–731. doi: 10.1001/archgenpsychiatry.2011.2287. [DOI] [PMC free article] [PubMed] [Google Scholar]
- Lau CG, Murthy VN. Activity-dependent regulation of inhibition via GAD67. J Neurosci. 2012;32:8521–8531. doi: 10.1523/JNEUROSCI.1245-12.2012. [DOI] [PMC free article] [PubMed] [Google Scholar]
- Lewis DA, Curley AA, Glausier JR, Volk DW. Cortical parvalbumin interneurons and cognitive dysfunction in schizophrenia. Trends Neurosci. 2012;35:57–67. doi: 10.1016/j.tins.2011.10.004. [DOI] [PMC free article] [PubMed] [Google Scholar]
- Li H, Handsaker B, Wysoker A, Fennell T, Ruan J, Homer N, Marth G, Abecasis G, Durbin R. The Sequence Alignment/Map format and SAMtools. Bioinformatics. 2009;25:2078–2079. doi: 10.1093/bioinformatics/btp352. [DOI] [PMC free article] [PubMed] [Google Scholar]
- Lieberman-Aiden E, van Berkum NL, Williams L, Imakaev M, Ragoczy T, Telling A, Amit I, Lajoie BR, Sabo PJ, Dorschner MO, Sandstrom R, Bernstein B, Bender MA, Groudine M, Gnirke A, Stamatoyannopoulos J, Mirny LA, Lander ES, Dekker J. Comprehensive mapping of long-range interactions reveals folding principles of the human genome. Science. 2009;326:289–293. doi: 10.1126/science.1181369. [DOI] [PMC free article] [PubMed] [Google Scholar]
- Lipska BK, Lerman DN, Khaing ZZ, Weickert CS, Weinberger DR. Gene expression in dopamine and GABA systems in an animal model of schizophrenia: effects of antipsychotic drugs. Eur J Neurosci. 2003;18:391–402. doi: 10.1046/j.1460-9568.2003.02738.x. [DOI] [PubMed] [Google Scholar]
- Lisman JE, Coyle JT, Green RW, Javitt DC, Benes FM, Heckers S, Grace AA. Circuit-based framework for understanding neurotransmitter and risk gene interactions in schizophrenia. Trends Neurosci. 2008;31:234–242. doi: 10.1016/j.tins.2008.02.005. [DOI] [PMC free article] [PubMed] [Google Scholar]
- Livak KJ, Schmittgen TD. Analysis of relative gene expression data using real-time quantitative PCR and the 2(−delta delta C(T)) Method. Methods. 2001;25:402–408. doi: 10.1006/meth.2001.1262. [DOI] [PubMed] [Google Scholar]
- Lundorf MD, Buttenschøn HN, Foldager L, Blackwood DH, Muir WJ, Murray V, Pelosi AJ, Kruse TA, Ewald H, Mors O. Mutational screening and association study of glutamate decarboxylase 1 as a candidate susceptibility gene for bipolar affective disorder and schizophrenia. Am J Med Genet. 2005;135B:94–101. doi: 10.1002/ajmg.b.30137. [DOI] [PubMed] [Google Scholar]
- Maherali N, Ahfeldt T, Rigamonti A, Utikal J, Cowan C, Hochedlinger K. A high efficiency system for the generation and study of human induced pluripotent stem cells. Cell Stem Cell. 2008;3:340–345. doi: 10.1016/j.stem.2008.08.003. [DOI] [PMC free article] [PubMed] [Google Scholar]
- Maston GA, Landt SG, Snyder M, Green MR. Characterization of enhancer function from genome-wide analyses. Annu Rev Genomics Hum Genet. 2012;13:29–57. doi: 10.1146/annurev-genom-090711-163723. [DOI] [PubMed] [Google Scholar]
- Maunakea AK, Nagarajan RP, Bilenky M, Ballinger TJ, D'Souza C, Fouse SD, Johnson BE, Hong C, Nielsen C, Zhao Y, Turecki G, Delaney A, Varhol R, Thiessen N, Shchors K, Heine VM, Rowitch DH, Xing X, Fiore C, Schillebeeckx M, et al. Conserved role of intragenic DNA methylation in regulating alternative promoters. Nature. 2010;466:253–257. doi: 10.1038/nature09165. [DOI] [PMC free article] [PubMed] [Google Scholar]
- Miele A, Dekker J. Mapping cis- and trans-chromatin interaction networks using chromosome conformation capture (3C) Methods Mol Biol. 2009;464:105–121. doi: 10.1007/978-1-60327-461-6_7. [DOI] [PMC free article] [PubMed] [Google Scholar]
- Miele A, Gheldof N, Tabuchi TM, Dostie J, Dekker J. Ausubel FM, et al., editors. Mapping chromatin interactions by chromosome conformation capture. Current protocols in molecular biology. 2006:11. doi: 10.1002/0471142727.mb2111s74. Chapter 21, Unit 21. [DOI] [PubMed] [Google Scholar]
- Mill J, Tang T, Kaminsky Z, Khare T, Yazdanpanah S, Bouchard L, Jia P, Assadzadeh A, Flanagan J, Schumacher A, Wang SC, Petronis A. Epigenomic profiling reveals DNA-methylation changes associated with major psychosis. Am J Hum Genet. 2008;82:696–711. doi: 10.1016/j.ajhg.2008.01.008. [DOI] [PMC free article] [PubMed] [Google Scholar]
- Numata S, Ye T, Hyde TM, Guitart-Navarro X, Tao R, Wininger M, Colantuoni C, Weinberger DR, Kleinman JE, Lipska BK. DNA methylation signatures in development and aging of the human prefrontal cortex. Am J Hum Genet. 2012;90:260–272. doi: 10.1016/j.ajhg.2011.12.020. [DOI] [PMC free article] [PubMed] [Google Scholar]
- Ong CT, Corces VG. Enhancer function: new insights into the regulation of tissue-specific gene expression. Nat Rev Genet. 2011;12:283–293. doi: 10.1038/nrg2957. [DOI] [PMC free article] [PubMed] [Google Scholar]
- Ribeiro de Almeida C, Stadhouders R, de Bruijn MJ, Bergen IM, Thongjuea S, Lenhard B, van Ijcken W, Grosveld F, Galjart N, Soler E, Hendriks RW. The DNA-binding protein CTCF limits proximal Vkappa recombination and restricts kappa enhancer interactions to the immunoglobulin kappa light chain locus. Immunity. 2011;35:501–513. doi: 10.1016/j.immuni.2011.07.014. [DOI] [PubMed] [Google Scholar]
- Sara Y, Biederer T, Atasoy D, Chubykin A, Mozhayeva MG, Südhof TC, Kavalali ET. Selective capability of SynCAM and neuroligin for functional synapse assembly. J Neurosci. 2005;25:260–270. doi: 10.1523/JNEUROSCI.3165-04.2005. [DOI] [PMC free article] [PubMed] [Google Scholar]
- Schmidt MJ, Mirnics K. Modeling interneuron dysfunction in schizophrenia. Dev Neurosci. 2012;34:152–158. doi: 10.1159/000336731. [DOI] [PubMed] [Google Scholar]
- Shen Y, Yue F, McCleary DF, Ye Z, Edsall L, Kuan S, Wagner U, Dixon J, Lee L, Lobanenkov VV, Ren B. A map of the cis-regulatory sequences in the mouse genome. Nature. 2012;488:116–120. doi: 10.1038/nature11243. [DOI] [PMC free article] [PubMed] [Google Scholar]
- Shetty AK, Turner DA. Glutamic acid decarboxylase-67-positive hippocampal interneurons undergo a permanent reduction in number following kainic acid-induced degeneration of ca3 pyramidal neurons. Exp Neurol. 2001;169:276–297. doi: 10.1006/exnr.2001.7668. [DOI] [PubMed] [Google Scholar]
- Shulha HP, Cheung I, Whittle C, Wang J, Virgil D, Lin CL, Guo Y, Lessard A, Akbarian S, Weng Z. Epigenetic signatures of autism: trimethylated H3K4 landscapes in prefrontal neurons. Arch Gen Psychiatry. 2012a;69:314–324. doi: 10.1001/archgenpsychiatry.2011.151. [DOI] [PubMed] [Google Scholar]
- Shulha HP, Crisci JL, Reshetov D, Tushir JS, Cheung I, Bharadwaj R, Chou HJ, Houston IB, Peter CJ, Mitchell AC, Yao WD, Myers RH, Chen JF, Preuss TM, Rogaev EI, Jensen JD, Weng Z, Akbarian S. Human-specific histone methylation signatures at transcription start sites in prefrontal neurons. PLoS Biol. 2012b;10:e1001427. doi: 10.1371/journal.pbio.1001427. [DOI] [PMC free article] [PubMed] [Google Scholar]
- Simonis M, Kooren J, de Laat W. An evaluation of 3C-based methods to capture DNA interactions. Nat Methods. 2007;4:895–901. doi: 10.1038/nmeth1114. [DOI] [PubMed] [Google Scholar]
- Singh D, Chan JM, Zoppoli P, Niola F, Sullivan R, Castano A, Liu EM, Reichel J, Porrati P, Pellegatta S, Qiu K, Gao Z, Ceccarelli M, Riccardi R, Brat DJ, Guha A, Aldape K, Golfinos JG, Zagzag D, Mikkelsen T, et al. Transforming fusions of FGFR and TACC genes in human glioblastoma. Science. 2012;337:1231–1235. doi: 10.1126/science.1220834. [DOI] [PMC free article] [PubMed] [Google Scholar]
- Stranger BE, Stahl EA, Raj T. Progress and promise of genome-wide association studies for human complex trait genetics. Genetics. 2011;187:367–383. doi: 10.1534/genetics.110.120907. [DOI] [PMC free article] [PubMed] [Google Scholar]
- Straub RE, Lipska BK, Egan MF, Goldberg TE, Callicott JH, Mayhew MB, Vakkalanka RK, Kolachana BS, Kleinman JE, Weinberger DR. Allelic variation in GAD1 (GAD67) is associated with schizophrenia and influences cortical function and gene expression. Mol Psychiatry. 2007;12:854–869. doi: 10.1038/sj.mp.4001988. [DOI] [PubMed] [Google Scholar]
- Tang B, Chang WL, Lanigan CM, Dean B, Sutcliffe JG, Thomas EA. Normal human aging and early-stage schizophrenia share common molecular profiles. Aging Cell. 2009;8:339–342. doi: 10.1111/j.1474-9726.2009.00468.x. [DOI] [PMC free article] [PubMed] [Google Scholar]
- Tang B, Dean B, Thomas EA. Disease- and age-related changes in histone acetylation at gene promoters in psychiatric disorders. Transl Psychiatry. 2011;1:e64. doi: 10.1038/tp.2011.61. [DOI] [PMC free article] [PubMed] [Google Scholar]
- Uhlhaas PJ, Singer W. Neuronal dynamics and neuropsychiatric disorders: toward a translational paradigm for dysfunctional large-scale networks. Neuron. 2012;75:963–980. doi: 10.1016/j.neuron.2012.09.004. [DOI] [PubMed] [Google Scholar]
- Vastenhouw NL, Schier AF. Bivalent histone modifications in early embryogenesis. Curr Opin Cell Biol. 2012;24:374–386. doi: 10.1016/j.ceb.2012.03.009. [DOI] [PMC free article] [PubMed] [Google Scholar]
- Visel A, Blow MJ, Li Z, Zhang T, Akiyama JA, Holt A, Plajzer-Frick I, Shoukry M, Wright C, Chen F, Afzal V, Ren B, Rubin EM, Pennacchio LA. ChIP-seq accurately predicts tissue-specific activity of enhancers. Nature. 2009;457:854–858. doi: 10.1038/nature07730. [DOI] [PMC free article] [PubMed] [Google Scholar]
- Volk DW, Matsubara T, Li S, Sengupta EJ, Georgiev D, Minabe Y, Sampson A, Hashimoto T, Lewis DA. Deficits in transcriptional regulators of cortical parvalbumin neurons in schizophrenia. Am J Psychiatry. 2012;169:1082–1091. doi: 10.1176/appi.ajp.2012.12030305. [DOI] [PMC free article] [PubMed] [Google Scholar]
- Wood AJ, Severson AF, Meyer BJ. Condensin and cohesin complexity: the expanding repertoire of functions. Nat Rev Genet. 2010;11:391–404. doi: 10.1038/nrg2794. [DOI] [PMC free article] [PubMed] [Google Scholar]
- Wood MA, Attner MA, Oliveira AM, Brindle PK, Abel T. A transcription factor-binding domain of the coactivator CBP is essential for long-term memory and the expression of specific target genes. Learn Mem. 2006;13:609–617. doi: 10.1101/lm.213906. [DOI] [PMC free article] [PubMed] [Google Scholar]
- Xiao S, Xie D, Cao X, Yu P, Xing X, Chen CC, Musselman M, Xie M, West FD, Lewin HA, Wang T, Zhong S. Comparative epigenomic annotation of regulatory DNA. Cell. 2012;149:1381–1392. doi: 10.1016/j.cell.2012.04.029. [DOI] [PMC free article] [PubMed] [Google Scholar]
- Yasui DH, Scoles HA, Horike S, Meguro-Horike M, Dunaway KW, Schroeder DI, Lasalle JM. 15q11.2–13.3 chromatin analysis reveals epigenetic regulation of CHRNA7 with deficiencies in Rett and autism brain. Hum Mol Genet. 2011;20:4311–4323. doi: 10.1093/hmg/ddr357. [DOI] [PMC free article] [PubMed] [Google Scholar]
- Zhang Y, Behrens MM, Lisman JE. Prolonged exposure to NMDAR antagonist suppresses inhibitory synaptic transmission in prefrontal cortex. J Neurophysiol. 2008;100:959–965. doi: 10.1152/jn.00079.2008. [DOI] [PMC free article] [PubMed] [Google Scholar]
- Zhou VW, Goren A, Bernstein BE. Charting histone modifications and the functional organization of mammalian genomes. Nat Rev Genet. 2011;12:7–18. doi: 10.1038/nrg2905. [DOI] [PubMed] [Google Scholar]
- Zhu J, Adli M, Zou JY, Verstappen G, Coyne M, Zhang X, Durham T, Miri M, Deshpande V, De Jager PL, Bennett DA, Houmard JA, Muoio DM, Onder TT, Camahort R, Cowan CA, Meissner A, Epstein CB, Shoresh N, Bernstein BE. Genome-wide chromatin state transitions associated with developmental and environmental cues. Cell. 2013;152:642–654. doi: 10.1016/j.cell.2012.12.033. [DOI] [PMC free article] [PubMed] [Google Scholar]