

Abstract
Objectives
To identify miRNA in human T cells that can explain known anti-inflammatory properties of steroids.
Materials and Methods
Activated human CD4+ T cells from healthy donors were exposed to 1 μM of methylprednisolone in vitro were subjected to miRNA and mRNA microarray analysis and changes in expression profiles were recorded. Using qPCR, flow cytometry, and ELISA we confirmed suppression of predicted targets and through miRNA transfection experiments suggest mechanistic links.
Results
We identified numerous steroid-responsive genes and miRNA — many known and some novel — including multiple previously unknown pro-inflammatory genes suppressed by methylprednisolone. Further studies using qPCR, flow cytometry, and ELISA demonstrated that methylprednisolone increased the expression of miR-98 and suppressed the levels of predicted targets including interleukin-13 and three TNF receptors FAS, FASL, and TNFRSF1B. Forced expression of miR-98 into T cells resulted in suppression of the same targets.
Conclusion
In this communication we demonstrate a link between miR-98 expression and the effects of methylprednisolone and provide evidence, which suggests that methylprednisolone acts through miR-98 to inhibit specific pro-inflammatory targets. Identification of this anti-inflammatory mechanism of glucocorticoids is important as it may pave the way toward the elusive goal of dissociating adverse from therapeutic effects.
Glucocorticoids (GC) are important anti-inflammatory medications for numerous diseases, including systemic lupus erythematosus (SLE) and other rheumatologic conditions. However, therapeutic use of GC is limited by serious side effects. Dissociating the therapeutic effects from these side effects is an important but thus far elusive goal.
Glucocorticoids suppress the immune system in numerous ways and by interfering with the function of multiple cell types including suppression of T cell function (1-3). After binding to their cytosolic receptor, GC translocate to the nucleus and regulate gene transcription both by interacting with other transcription factors (e.g. AP-1, NFκB) and by binding directly to DNA at GC response elements (4). However, they can also act post-transcriptionally by destabilizing mRNA (5).
Mature miRNA — as part of a cytosolic RNA-protein complex — impair translation or stability of target mRNA by binding to an 8 nucleotide complementary sequence in their 3′UTR (6). Multiple miRNA have been found to influence immune cells and to modulate the activity of T cells (7-12). Furthermore, dysregulated expression of miRNA has been implicated in the pathogenesis of autoimmune diseases that respond to treatment with GC including SLE, rheumatoid arthritis, Sjogrens syndrome, scleroderma and polymyositis/dermatomyositis (13, 14).
Given the similarities between the actions of GC and miRNA – both can destabilize mRNA – as well as the presence of dysregulated miRNA in GC-responsive diseases, we hypothesized that GC act in part through miRNA. It has already been established that GC alter the levels of miRNA in human B cells (15, 16), macrophages (17) and fibroblasts (18) as well as in murine thymocytes (19). However, it is not known whether GC alter miRNA expression in human T cells or if such changes mediate any therapeutic activity. Each miRNA targets many genes, often modulating cellular processes at multiple levels. Therefore, it is possible that one miRNA could mediate a subset of desirable therapeutic GC actions while another miRNA mediates actions associated with adverse effects.
In this communication we show that human T cells exposed to methylprednisolone (MP) in vitro display altered expression of miRNA important in T cell activation, including increased expression of miR-98 and decreased expression of miR-155. Enhanced expression of miR-98 by MP is accompanied by suppressed expression of predicted targets of miR-98 (FAS, FASL, TNFRSF1B, and IL13). Overexpression of miR-98 also suppressed expression of the same target genes. Our data suggest that some of the beneficial T cell specific anti-inflammatory mechanisms of GC are mediated through miR-98.
Methods
Subjects
The Institutional Review Board of BIDMC approved the study of healthy donor blood samples. Initial studies to determine the optimal dose of MP and experiments using the Wafergen microarrays were done using blood of 9 healthy women who were not taking steroids. Validation studies and transfection experiments were accomplished using blood from healthy platelet donors of the Kraft Family Blood Donor Center (Dana-Farber Cancer Institute, Boston, MA).
T cell isolation, activation and MP exposure
Total T cells were isolated by negative selection (RosetteSep, Stem Cell Technologies, Vancouver, Canada). Naïve T cells were purified using a T cell isolation kit from Miltenyi Biotec according to the manufacturer’s instructions. T cell purity was always ≥96% monitored by flow cytometry. The cells were cultured in XVIVO-15 medium (Lonza) supplemented with gentamycin or in RPMI medium supplemented by 10% fetal bovine serum and antibiotics. Activation was achieved using anti-CD28 and anti-CD3 antibodies. Six-well plates were coated overnight with 1.5 μg/ml anti-CD3 antibody and washed once prior to T cell addition in media containing 1.5 μg/ml anti-CD28 antibody. At the start of stimulation 1 μM MP was added to the cultures. Antibodies and MP remained in the media for the indicated time of culture (usually for 24h, range 0-48h). Supernatants were removed for cytokine analysis by ELISA and cells were collected for flow cytometry analysis or RNA isolation at indicated times.
T cell transfection
Transfection of either miR-scramble (control) or miR-98 mimic (Ambion) into T cells was accomplished with lipofectamine RNAiMAX (Invitrogen) per manufacturer guidelines. Briefly, lipofectamine and miRNA were added separately to culture medium, then combined and left at 37°C for 20 min. 3×10⁶ cells were plated in 3 ml of medium with a final concentration of 0.33 μl/ml of lipofectamine and 33 nM miRNA at 37°C for 2.5h. Cells were collected, washed and transferred to new medium containing 1.5 μg/ml anti-CD28 antibody and placed in new culture plates coated overnight with 1.5 μg/ml anti-CD3 antibody for times indicated.
RNA isolation
Total RNA was isolated from T cells with TRIzol reagent (Life Technologies) using heavy phase lock gel tubes (5-prime), per manufacturer guidelines. Clear phase was loaded to RNA isolation columns (Promega), treated with DNAse, washed, and eluted per manufacturer guidelines. Total RNA quantity and quality was determined by Nanodrop ND-1000 spectrophotometer.
Microarray RNA profiling
Naïve CD4+ T cells were isolated as described. After activation and 24h of culture with or without 1 μM MP, RNA was isolated as described. Both mRNA and miRNA profiles were examined using microarrays (SmartChip v1, provided to us by Wafergen, Biosystems, Inc., Fremont, CA), an oncology panel for the mRNA profile and a miRNA panel for microRNA profile, all following the manufacturers kit guidelines. The 9 subjects were pooled into 3 groups of 3 subjects each. Equal amounts of total RNA were loaded from each subject. 6 miRNA panels, 3 untreated controls and 3 MP-treated groups were compared. Similarly, 6 oncology mRNA panels were utilized. Resultant Ct values were converted to relative copy numbers, by the equation: relative copy number = 10(Ct-38.5)/−3.333, and normalized by dividing with the relative copy number of the housekeeping genes RNU44 and RNU66 for miRNA or B2M for mRNA. These normalized values were compared using a ratio between the untreated and treated groups. We selected RNA species with at least 2-fold expression changes between groups both in the average across the 3 repeats and in at least 2 of 3 repeats.
Flow cytometry
Cells were labeled with fluorochrome-conjugated murine anti-human antibodies (eBioscience, Biolegend, R&D Systems) and subjected to flow cytometric analysis using a FACS II flow cytometer (BD Biosciences Immunocytometry Systems). Data analysis was performed using FACS Diva (BD Biosciences) and FlowJo Flow Cytometry Analysis softwares.
Quantitative PCR
RNA isolated from T cells was reverse transcribed to cDNA using direct reverse transcription for mRNA (Applied Biosystems) or poly-A tail building followed by reverse transcription for miRNA (Exiqon) per manufacturer guidelines. The mRNA cDNA was amplified and measured by quantitative PCR using master mix and primers (Applied Biosystems primer sets [FAS:002363300_m1, FASL:00181225_m1, IL13:00174379_m1, RPLP0:00420895_gH, TNFRSF1:00961749]) in a Light Cycler 480 machine (Roche). Similarly, the miRNA cDNA with extra poly-A tail was amplified and measured using master mix and primers (Exiqon primer sets [hsa-miR-98:204640, hsa-miR-155:204308, SNORD38B(hsa):203901, U6 snRNA(hsa,mmu):203907]). Resultant Ct values were converted and normalized as described using housekeeping U6 or SNOR38b for miRNA or RPLPO for mRNA.
ELISA
Supernatants from cell cultures were collected for cytokine measurements using immunoassay kits per manufacturer guidelines (eBioscience, R&D System). The optical density of the wells was determined using a microplate reader set at 450 nm.
Bioinformatics
Potential targets for selected miRNA were obtained from the bioinformatics resource Targetscan. Potential targets were cross-referenced with the mRNA selected from the mRNA assay and subjected for further analysis. Cytoscape and BiNGO add-on were used for visualization and analysis of microarray data (20, 21).
Statistics
Statistical analysis was accomplished with GraphPad Prism software or with the BiNGO add-on for Cytoscape. For identification of overrepresented biologic processes we compared the list of identified mRNA with the complete gene ontology, using the BiNGO (c) add-on for Cytoscape and the hypergeometric test with Bonferroni Family-Wise Error Rate correction with a corrected p-value cut off of 0.05. Other statistics, Wilcoxon matched pairs test, paired t test or a ratio t test used a p-value cut off of 0.05.
Results
Exposure to 1 μM MP inhibits human CD4+ T cell function in vitro without causing apoptosis
To determine the optimal effective concentration of MP we assessed the expression of IL2RA, the production of cytokines and apoptosis in activated CD4+ T cells exposed to increasing concentrations of MP (0-1 mM) for 30h (Supplemental Figure 1). The selection of these experimental conditions considered data from previous literature and an estimated range of therapeutic levels in autoimmune diseases. For example, using published values of Vd and ½-life, 1 μM of should correspond to the peak level in a 70 kg patient treated with 50 mg IV (0.75 mg/kg) or to the 24h trough level after a 30 mg/kg IV pulse dose (22). Thus, this concentration and duration of exposure is similar to that of patients pulsed with IV MP, a common initial therapy for many rheumatologic diseases.
We found that exposure of T cells to 1 μM MP inhibited IL2RA expression on the surface membrane and cytokine production (Supplemental Figure 1). Exposure to 10-fold lower concentrations of MP did not inhibit T cells while 10-fold higher concentrations inhibited T cell function but also caused cell death (Supplemental Figure 1). Furthermore, compared to unexposed cells and cells exposed to the 1 nM concentration, exposure to 1 μM MP protected cells from apoptosis (Supplemental Figure 1). These observations are in agreement with previous findings (23, 24). Since 1 μM MP optimally inhibited T cell activation without causing apoptosis we used it in all subsequent experiments.
MP inhibits activation of CD4+ T cells through both known and novel GC-responsive miRNA and mRNA
To identify MP-responsive miRNA and mRNA we performed miRNA and mRNA microarray experiments using CD4+ T cells with and without exposure to 1μM MP in vitro for 24h. We selected RNA with at least 2-fold change in expression levels in at least 2 experiments as well and at least 2-fold change in the average of the 3 experiments (Figure 1A).
FIGURE 1.

MP inhibits the expression of many inflammatory genes as well as numerous miRNA. A. Fold change of RNA species from activated CD4+ T cells comparing cells exposed in vitro to 1μM MP with unexposed cells at 24h. Identified miRNA and mRNA by Wafergen microarrays. Each RNA species selected had at least two-fold change in the average as well as in at least two of the three microarrays results with exposure of MP. Each microarray represents data from three pooled subjects. RNA species in each column placed in ascending order of expression level (assessed with MP exposure for positive fold changes, and without MP exposure for negative fold changes). Top 21 expressed miRNA selected (boxed) for GO and cross-reference analysis. Bolded mRNAs are well known targets of GC. B. Validation of select miRNA identified in microarrays with additional subjects. Fold-changes in stimulated T cells comparing cells exposed to 1μM MP to unexposed cells. For miR-98, T cells cultured for 48h. Mean and standard deviation of 5 independent experiments is shown. For miR-155, T cells cultured for 24h. Mean and standard deviation of 8 independent experiments is shown. (* indicates p<0.05, ratio t test)
Many mRNAs that we identified are known targets of GC (decreased BRCA1, CCND3, CDK4, CXCL9, IL1A, IL2, IL2Ra, IL13, MMP9, LTA, RELA, SMAD3, SMAD7, TNF, and TNFRSF9; increased DUSP1 and IL10) (5, 25-34). Most of these genes are involved in inflammation or cell proliferation. We also found other GC-responsive pro-inflammatory genes suppressed by MP. These previously less recognized genes include IL12RB2, IRF1, FAS, TNFRSF1A, TNFRSF1B, TRAF2, TRAF4, and TRAF6.
MP inhibited genes in the TNF superfamily (LTA, TNF), the TNFR superfamily (FAS, TNFRSF1A, TNFRSF1B, TNFRSF9), and the TNF pathway (NFKB2, RELA, TRAF2, TRAF4, TRAF6). In addition, MP increased the expression of genes that suppress the TNF pathway, such as the MAPK regulator DUSP1. We also found that MP enhanced the TGF-β anti-inflammatory pathway manifested by the increased expression of SMAD3 and the decreased expression of SMAD7, a known inhibitor in the SMAD cascade. Other cytokines inhibited or enhanced by MP are known to contribute to anti-inflammatory effects of MP (decreased IL1, IL2, IL13; increased IL10).
Similarly, some of the identified miRNA are known targets of GC (miR-19a, miR-27, miR-28, miR-155, and miR-301) (14-18). We also identified several novel GC-responsive miRNA. The most highly expressed GC-responsive miRNAs were miR-98 and miR-155 (Figure 1A). These miRNA have previously been well characterized as important in the function of the immune system and differentially expressed during T cell activation. Furthermore, they have been implicated in the pathogenesis of autoimmune diseases (9, 11,13, 35-39). Altered expression of miR-98 and miR-155 was further verified by quantitative PCR as shown in Figure 1B.
Predicted mRNA targets of MP-responsive miRNA are inversely altered in human CD4+ T cells following MP exposure
Because each miRNA can target multiple mRNA simultaneously, the biologic activity of a miRNA in a particular cell depends on the specific mRNA expressed in that cell. To determine MP-responsive miRNA important in activated CD4+ T cells, we searched for miRNA altered by MP that had targets, which were also altered, inversely to the miRNA, by MP exposure. Focusing only on the prominent miRNA, we cross-referenced predicted targets of the most highly expressed 21 miRNA of each group (Figure 1A, boxed column 1 or 3) with the inversely altered mRNA (Figure 1A, column 2 or 4). For the miRNA with increased expression this approach yielded 10 potential targets (Table 1). For the miRNA with decreased expression, 11 targets were identified (Table 1). When compared against the complete gene ontology we found these targets were enriched in biological processes consistent with known GC action such as suppression of cell death, cell adhesion, cell cycle and immune response (Supplemental Table 1).
TABLE 1.
Predicted Targets of MP Responsive miRNA are Inversely Altered
| Decreased mRNA with Increased miRNA |
Increased mRNA with Decreased miRNA |
||
|---|---|---|---|
| CCND2 | miR-1271 | BCL2 | miR-1226 |
| miR-767-5p | miR-155 | ||
| miR-98 | |||
| FAS | miR-98 | BMPR2 | miR-300 |
| HBEGF | miR-1271 | CCNG1 | miR-27B-L3 |
| miR-514 | miR-509-5p | ||
| HMGB3 | miR-758 | EPHB4 | miR-300 |
| IL1A | miR-181b_1 | FAM126A | miR-27B_L3 |
| miR-543 | |||
| IL-13 | miR-98 | MAF | miR-1226 |
| SMAD7 | miR-1271 | MEF2A | miR-155 |
| miR-181b_1 | |||
| miR-543 | |||
| miR-590-5p | |||
| TNF | miR-181b_1 | MNT | miR-1298 |
| miR-27B_L3 | |||
| TNFRSF1B | miR-98 | NBEA | miR-300 |
| UHRF1 | miR-549 | NBR1 | miR-300 |
| miR-98 | |||
| NRP1 | miR-1226 | ||
Target predictions (TargetsScanHuman 5.2) of the top 21 most highly expressed miRNA identified in Figure 2 were cross-referenced with mRNA identified in Figure 2. Left Column. Decreased mRNA cross-referenced with increased miRNA that are predicted to target them. Right Column. Increased mRNA cross-referenced with decreased miRNA that are predicted to target them. A pattern of multiple predicted targets for some of the miRNA emerged; miR-27_L3, 98,155, 181, 300,543, 1226, 1271 all target more than one identified mRNA (miR-98 highlighted).
As shown in Table 1, mRNA were often predicted targets of more than one miRNA (e.g. SMAD7) and each miRNA often targeted more than one of the mRNA (e.g. miR-98). Some of the mRNAs targeted by miR-98 were selected for further studies. All the mir-98 target sites further investigated defined 8 nucleotide consensus sequences that were highly conserved across species (Figure 2).
FIGURE 2.
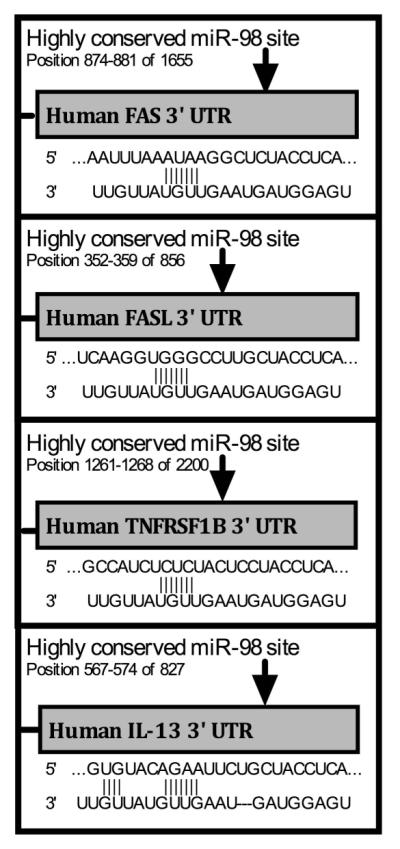
All investigated miR-98 sites have full 8 nucleotide matches in the target sequence and are all highly conserved across species. Predicted target sites and target sequences for miR-98 on the 3′ UTR of select mRNA targets, from TargetScan.org.
MP exposure inhibited miR-98 targets in human T cells
To validate and expand on the microarray data we next performed a series of time-course experiments to determine levels of miR-98 and miR-98 targets in activated human CD4+ and CD8+ T cells exposed to MP. We found that all of the target mRNA transcripts were significantly inhibited by MP at or before 24h (Figure 3A). For example, FASL and IL-13 transcripts were decreased at 4, 24, and 48h (Figure 3A). Protein expression of the target genes was significantly decreased at or before 48h of MP exposure with FAS, TNFRSF1B and IL-13 decreased by 24h (Figure 3B). Differences in the expression levels of any of the targets between CD4+ and CD8+ T cells failed to reach statistical significance. These results clearly show that MP inhibits miR-98 targets in T cells.
FIGURE 3.

MP inhibits expression of predicted miR-98 targets. Fold change in each target shown comparing stimulated T cells exposed in vitro to 1μM MP with unexposed stimulated T cells at indicated times (IL-13 ELISA at 24hrs). A. Predicted target mRNA detected by qPCR. B. Predicted target proteins detected by flow cytometry (top 3) or ELISA (bottom). Mean and SD shown. For flow cytometry cells were gated on lymphoid population (FSC, SSC) then on CD4+ or CD8+. The MFI of each target was then obtained. RNA and protein were obtained from the same experiments. There were at least four independent experiments for all time points. Three experiments were used for ELISA shown. Insets show representative flow histograms of total T cells; dark line without MP exposure grey line with MP exposure and effect of methylprednisolone on miR-98 by qPCR. (* indicates p<0.05, ratio t test)
Overexpression of miR-98 inhibits miR-98 targets in human T cells
To demonstrate that MP-induced miR-98 could account for decreased target mRNA expression, we force-expressed miR-98 in human T cells. The effectiveness of the miR-98 transfection was confirmed by quantitative PCR (Figure 4B, bottom, right inset). Four hours after transfection of miR-98 in human T cells, expression of either target mRNA (Figure 4A) or protein (Figure 4B) were decreased. Trends toward decreased transcript expression are seen in all targets with both FAS and IL-13 reaching statistical significance. Although decreases in protein expression were modest they reached statistical significance for each target in either CD4+ or CD8+ T cells at 4h for flow data and at 24h for ELISA data. While differences exist between responses of CD4+ and CD8+ T cells most differences do not reach statistical significance, only the 4h time point of TNFRSF1B reached significance. These results demonstrate miR-98 inhibits these targets in activated T cells and therefore, enhanced miR-98 expression by MP may explain suppression of these targets.
FIGURE 4.

Forced expression of miR-98 inhibits predicted targets that are steroid responsive. Fold changes in targets comparing stimulated T cells transiently transfected with miR-98 mimic T cells transfected with miRNA control. Time points begin at end of transfection. Mean and SD shown. RNA and protein obtained from the same experiments. Three independent experiments displayed for all time points except 4h data, which shows 4 independent experiments. A. Predicted targets mRNA detected by qPCR. B. Predicted targets protein detected by flow cytometry (top3) or by ELISA (bottom). For flow cytometry cells first gated on lymphoid population (FSC, SSC) then on CD4+ or CD8+. MFI of each target was then recorded. Top 3 insets show representative flow histograms of total T cells (dark line – control transfection, grey line – miR-98 mimic transfection) and the bottom inset shows a representative example of miR-98 transfection. (* indicates p<0.05, all ratio t test except IL13 data compared with two sided paired t test.)
GC antagonist block MP-induced expression of miR-98 and rescues MP-induced inhibition of miR-98 targets
To clearly establish the role of MP on induction of miR-98 and inhibition of miR-98 targets we compared T cells exposed to MP with T cells exposed to both MP in the presence of the GC antagonist, RU-486. We demonstrate a protective effect of RU-486 on MP-induced changes in expression of miR-98 and all of the targets (Figure 5). At 4h, MP-induced expression of miR-98 is blocked by RU-486 (Figure 5C) while inhibition of miR-98 targets are blocked (Figure 5A and 5B). Trends are apparent in all transcripts and meet statistical significance for both FASL and IL-13 by 4h (Figure 5A). Protein synthesis is restored by RU-486 in all targets at or before 48h (Figure 5B). This clearly establishes the GC role in miR-98 induction and miR-98 target suppression.
FIGURE 5.

RU-486 blocks MP-induced expression of miR-98 and rescues MP-induced inhibition of miR-98 targets. Fold change in each target shown comparing stimulated T cells exposed in vitro to 1μM MP + RU-486 with unexposed stimulated T cells at indicated times. Mean and SD shown. RNA and protein were obtained from the same experiments. There were at least four independent experiments for all time points. A. Predicted target mRNA detected by qPCR. B. Predicted target proteins detected by flow cytometry (top 3) or ELISA (bottom). For flow cytometry cells were gated on lymphoid population (FSC, SSC) then on CD3+. The MFI of each target was then obtained. C. miR-98 detected by qPCR (* indicates p<0.05, Wilcoxon matched pairs test)
Discussion
Despite the potential therapeutic implications, few studies to date have investigated the importance of miRNA in the anti-inflammatory effects of GC. To our knowledge, the present study is the first attempt to identify miRNA involved in the mechanism of action of GC in human T cells. In this investigation we validated numerous known steroid-responsive genes and miRNA, identified other pro-inflammatory genes inhibited by MP and discovered novel steroid-responsive miRNA. By cross-referencing the microarray results we then established the relevance of these steroid-responsive miRNA in CD4+ T cells, highlighting the importance miR-98. Through further experiments we validated and expanded these results, demonstrating that miR-98 could play a role in the anti-inflammatory effects of MP, including its anti-TNF activities, by targeting the pro-inflammatory cytokine IL-13 and three TNF receptors FAS, FASL, and TNFRSF1B.
MiR-98 is located in an intron of the HUWE1 gene on the short arm of the X chromosome. HUWE1 is a U3 ubiquitin ligase family gene involved in cell cycle regulation. The gene is not known to be steroid-responsive nor to have a GC response element, so the mechanism of the regulation is not clear, although it is possible that the regulation is through other transcription factors altered by binding to the MP-GC receptor complex.
MiR-98 is part of the let-7/miR-98 family, often referred to as a “tumor-suppressor” miRNA family since its members target proto-oncogenes and is decreased in some tumors (40). These actions of the let-7/miR-98 family are consistent with actions of GC. Previous work supports the role of miR-98 in processes influenced by GC including apoptosis, proliferation, and T cell activation. Moreover, known targets of miR-98 overlap with those of MP. For example IL-13 is GC-responsive and is a validated target of miR-98 (31, 38).
We have presented evidence that GC can inhibit FAS expression through the induction of miR-98 by demonstrating that miR-98 overexpression inhibits FAS expression. This finding is consistent with reported experiments where miR-98 suppressed FAS promoter-driven reporter gene expression and activation induced cell death (AICD) of T cells (37), a known effect of GC (23). Besides its role in T cell AICD, the FAS receptor may be involved in other non-apoptotic functions consistent with GC activities, including cell activation, proliferation, and differentiation as well as pro-inflammatory cytokine production such as IL-6 and IL-17 (41, 42).
Our results demonstrate that FASL, a known target of GC, was inhibited by both MP and miR-98. Downregulation of FASL plays a role in AICD and influences inflammatory cytokine production (41,43). Inhibition of the FAS-FASL pathway by both GC and miR-98 is an important anti-inflammatory mechanism limiting T cell cytotoxicity.
TNFRSF1B mediates the biologic effects of TNF using TRAF2 for signal transduction and can form a heterocomplex with TNFRSF1A. Modulation of the expression of this receptor by both GC and by miR-98 is reported here for the first time.
IL-13 is a pro-inflammatory cytokine usually secreted by Th2 lymphocytes, often observed in “allergic” inflammatory diseases, such as asthma. In reported experiments miR-98 suppressed IL-13 promoter-driven reporter gene expression (38). IL-13 is also a known target of GC (31). We validated these associations and suggest that MP acts through miR-98 to mediate this action.
While our experiments remain correlational they demonstrate a clear link between the increased miR-98 expression and the decreased target gene expression, an association that is obliterated in the presence of a GC antagonist, suggesting that MP acts via miR-98 to inhibit these targets. Based on our data we believe that MP acts by enhancing the expression of miR-98, which then targets these inflammatory genes.
Identification of this anti-inflammatory mechanism of GC is important as it may pave the way to the elusive goal of dissociating GC side effects from therapeutic effects. This dissociation may not be perfect, for instance the miR-98 family has been implicated in glucose intolerance, which is a known adverse effect of GC. Yet even partial dissociation could radically reduce some serious adverse effects of GC (44).
Dissociation of the therapeutic effects from adverse effects of GC may have special clinical relevance in conditions where T cell pathology is apparent, such as SLE (45-47). Several miRNA known to be increased in SLE (e.g. miR-155) were decreased following exposure to MP and several that are known to be decreased in SLE (e.g. let-7/miR-98 family) were increased after exposure to MP (48-50). Our results, contrasted with the dysregulated miRNA in SLE and together with the known therapeutic effect of MP in SLE suggest enhancing the expression of miR-98 in SLE may have clinical benefit. More work is needed to further describe the role of miR-98 in GC action as well as to discover other miRNA important in mediating GC actions.
Supplementary Material
Supplemental FIGURE 1. One μM of MP inhibits T cell function without causing cell death. T cells stimulated and cultured for 30 hours with the indicated concentrations of MP. A. Percent of live total T cells measured by flow cytometric exclusion of PI stain. Mean and standard deviation from 3 independent experiments is shown. B. Fold change of IL2RA on T cells, by flow cytometric analysis. Cells first gated on lymphoid population (FSC,SSC), then CD3+. MFI of IL2RA then recorded. Mean and standard deviation of 3 independent experiments is shown. C. Cytokine levels in supernatents of cultured T cells measured by ELISA. Representative data. (*indicates p<0.05, ratio t test or paired t test)
Acknowledgments
Support: This work was supported by 5T32AI074549-04 and RO1AI4229 to GCT and by Harvard Catalyst | The Harvard Clinical and Translational Science Center (National Center for Research Resources and the National Center for Advancing Translational Sciences, National Institutes of Health Award 8UL1TR000170-05 and financial contributions from Harvard University and its affiliated academic health care centers).
Footnotes
The authors have no conflicts of interest to report.
References
- 1.Xu L, Xu Z, Xu M. Glucocorticoid treatment restores the impaired suppressive function of regulatory T cells in patients with relapsing-remitting multiple sclerosis. Clin Exp Imm. 2009;158:26–30. doi: 10.1111/j.1365-2249.2009.03987.x. [DOI] [PMC free article] [PubMed] [Google Scholar]
- 2.Aristimuno C, Navarro J, Andres C, Martinez-Gines L, Giminez-Roldan S, Ernandez-Cruz E, et al. Expansion of regulatory CD8+ T-lymphocytes and fall of activated CD8+ T-lymphocytes after IV methyl-prednisolone for multiple sclerosis relapse. J Neuroimmunol. 2008;204:131–5. doi: 10.1016/j.jneuroim.2008.08.009. [DOI] [PubMed] [Google Scholar]
- 3.Ashwell JD, Lu FWM, Vacchio MS. Glucocorticoids in T cell Development and Function. Annu Rev Immunol. 2000;18:309–45. doi: 10.1146/annurev.immunol.18.1.309. (review) [DOI] [PubMed] [Google Scholar]
- 4.Papamichail M, Tsokos G, Tsawdaroglou N, Sekeris CE. Immunocytochemical demonstration of glucocorticoid receptors in different cell types and their translocation from the cytoplasm to the cell nucleus in the presence of dexamethasone. Exp Cell Res. 1980;125:490–3. doi: 10.1016/0014-4827(80)90144-5. [DOI] [PubMed] [Google Scholar]
- 5.Ing N. Steroid Hormones Regulate Gene Expression Posttranscriptionally by altering the stabilities of messenger RNAs. Biol Reprod. 2005;72:1290–6. doi: 10.1095/biolreprod.105.040014. (review) [DOI] [PubMed] [Google Scholar]
- 6.Bartel DP. 2004, MicroRNA’s: Genomics, biogenesis, mechanism, and function. Cell. 2004;116:281–97. doi: 10.1016/s0092-8674(04)00045-5. (review) [DOI] [PubMed] [Google Scholar]
- 7.Cobb BS, Nesterova TB, Thompson E, Heratweck A, O’Connor E, Godwin J, et al. T cell lineage choice and differentiation in the absence of the RNase III enzyme Dicer. J Exp Med. 2005;201:1367–73. doi: 10.1084/jem.20050572. [DOI] [PMC free article] [PubMed] [Google Scholar]
- 8.Mulijo SA, Ansel KM, Kanellopoulou C, Livingston DM, Rao A, Rajewsky K. Aberrant T cell differentiation in the absence of Dicer. J Exp Med. 2005;202:261–9. doi: 10.1084/jem.20050678. [DOI] [PMC free article] [PubMed] [Google Scholar]
- 9.Lu LF, Thai TH, Calado DP, Chaudhry A, Kubo M, Tanaka K, et al. Foxp3-dependent microRNA 155 confers competitive fitness to regulatory T cells through targeting SOCS1. Immunity. 2009;30:80–91. doi: 10.1016/j.immuni.2008.11.010. [DOI] [PMC free article] [PubMed] [Google Scholar]
- 10.Li Q-J, Chau J, Ebert P, Sylvester G, Min H, Liu G, et al. miR-181a is an intrinsic modulator of T cell sensitivity and selection. Cell. 2007;129:147–61. doi: 10.1016/j.cell.2007.03.008. [DOI] [PubMed] [Google Scholar]
- 11.Stahl HF, Fauti T, Ullrich N, Bopp T, Kubach J, et al. miR-155 inhibition sensitizes CD4+ Th cells for TREG mediated suppression. PLoS One. 2009;4:e7158. doi: 10.1371/journal.pone.0007158. [DOI] [PMC free article] [PubMed] [Google Scholar]
- 12.Wu H, Neilson JR, Kumar P, Manocha M, Shankar P, Sharp PA, et al. miRNA profiling of naïve, effector and memory CD8 T cells. PlosOne. 2007;10:e1020. doi: 10.1371/journal.pone.0001020. [DOI] [PMC free article] [PubMed] [Google Scholar]
- 13.Ceribelli A, Yao B, Dominguez-Gutierrez PR, Nahid MA, Satoh M, Chan EKL. MicroRNAs in systemic rheumatic diseases. Arthritis Res Ther. 2011;13:229. doi: 10.1186/ar3377. (review) [DOI] [PMC free article] [PubMed] [Google Scholar]
- 14.Amarilyo Gil, La Cava Antonio. miRNA in systemic lupus erythematosus. Clin Immuno. 2012;144:26–31. doi: 10.1016/j.clim.2012.04.005. (review) [DOI] [PubMed] [Google Scholar]
- 15.Harada M, Tamm KP, Soderhall S, Heyman M, Grander D, Corcoran M. Involvement of the miR17 pathway in glucocorticoid-induced cell death in pediatric acute lymphoblastic leukemia. Leuk Lymphoma. 2012 doi: 10.3109/10428194.2012.678004. epub ahead of print. [DOI] [PubMed] [Google Scholar]
- 16.Molitoris JK, McColl KS, Distelhorst CW. Glucocorticoid-mediated repression of the oncogenic microRNA cluster miR-17~92 contributes to the induction of Bim and initiation of apoptosis. Mol Endocrinol. 2011;25:409–20. doi: 10.1210/me.2010-0402. [DOI] [PMC free article] [PubMed] [Google Scholar]
- 17.Zheng Y, Xiong S, Jiang P, Liu R, Liu X, Qian J, et al. Glucocorticoids inhibit lipopolysaccharide-mediated inflammatory response by downregulating microRNA-155: a novel anti-inflammation mechanism. Free Radic Biol Med. 2012;52:1307–17. doi: 10.1016/j.freeradbiomed.2012.01.031. [DOI] [PubMed] [Google Scholar]
- 18.Liu L, Walker EA, Kissane S, Khan I, Murray PI, Rauz S, et al. Gene Expression and miR Profiles of Human Corneal Fibroblasts in Response to Dexamethasone. Invest Ophthalmol Vis Sci. 2011;52:7282–8. doi: 10.1167/iovs.11-7463. [DOI] [PubMed] [Google Scholar]
- 19.Smith LK, Shah RR, Cidlowsk JA. Glucocorticoids Modulate MicroRNA Expression and Processing. J Biol Chem. 2010;285:36698–708. doi: 10.1074/jbc.M110.162123. [DOI] [PMC free article] [PubMed] [Google Scholar]
- 20.Smoot M, Ono KK, Ruscheinski J, Wang P-L, Ideker T. Cytoscape 2.8: new features for data integration and network visualization. Bioinformatics. 2011;27:431–2. doi: 10.1093/bioinformatics/btq675. [DOI] [PMC free article] [PubMed] [Google Scholar]
- 21.Maere S, Heymans K, Kuiper M. BiNGO: a Cytoscape plugin to assess overrepresentation of Gene Ontology catagories in biological networks. Bioinformatics. 2005;21:3448–9. doi: 10.1093/bioinformatics/bti551. [DOI] [PubMed] [Google Scholar]
- 22.Al-Habat SMH, Rogers HJ. Methylprednisolone pharmacokinetics after intravenous and oral administration. Br J Clin Pharmac. 1989;27:285–90. doi: 10.1111/j.1365-2125.1989.tb05366.x. [DOI] [PMC free article] [PubMed] [Google Scholar]
- 23.Lanza L, Scudeletti M, Puppo F, Bosco O, Peirano L, et al. Prednisone increases apoptosis in vitro activated human peripheral blood T lymphocytes. Clin Exp Immunol. 1996;103:482–90. doi: 10.1111/j.1365-2249.1996.tb08306.x. [DOI] [PMC free article] [PubMed] [Google Scholar]
- 24.Zacharchuk CM, Mercep M, Chakraborti PK, Simons SS, Ashwell JD. Programmed T lymphocyte death cell activation-and steroid-induced pathways are mutually antagonistic. J Immunol. 1990;145:4037–45. [PubMed] [Google Scholar]
- 25.Jiang W, Zhu Z, Bhatia N, Agarwal R, Thompson HJ. Mechanisms of Energy Restriction: Effects of Corticosterone on Cell Growth, Cell Cycle Machinery, and Apoptosis. Cancer Res. 2002;62:5280–7. (review) [PubMed] [Google Scholar]
- 26.Garcia-Gras EA, Chi P, Thompson EA. Glucocorticoid-mediated Destabilization of Cyclin D3 mRNA Involves RNA-Protein Interactions in the 3′-Untranslated Region of the mRNA. J Bio Chem. 2000;275:22001–8. doi: 10.1074/jbc.m001048200. [DOI] [PubMed] [Google Scholar]
- 27.Wu J, Li Y, Dietz J, Lala DS. Repression of p65 Transcriptional Activation by the Glucocorticoid Receptor in the Absence of Receptor-Coactivator Interactions. Mol Endocrinol. 2004;18:53–62. doi: 10.1210/me.2002-0373. [DOI] [PubMed] [Google Scholar]
- 28.Antonova L, Mueller CR. Hydrocortisone down-regulates the tumor suppressor gene BRCA1 in mammary cells: a possible molecular link between stress and breast cancer. Genes Chromosomes Cancer. 2008;47:341–52. doi: 10.1002/gcc.20538. [DOI] [PubMed] [Google Scholar]
- 29.de Kruif MD, Lemaire LC, Giebelen IA, Groot AP, Pater JM, van den Pangaart PS, et al. Effects of prednisolone on the systemic release of mediators of cell-mediated cytotoxicity during human endotoxemia. Shock. 2008;29:458–61. doi: 10.1097/shk.0b013e3181598a6a. [DOI] [PubMed] [Google Scholar]
- 30.Schroen DJ, Brinckerhoff CE. Nuclear hormone receptors inhibit matrix metalloproteinase (MMP) gene expression through diverse mechanisms. Gene Expr. 1996;6:197–207. [PMC free article] [PubMed] [Google Scholar]
- 31.Richards DF, Fernandez M, Caulfield J, Hawrylowicz CM. Glucocorticoids drive human CD8(+) T cell differentiation towards a phenotype with high IL-10 and reduced IL-4, IL-5 and IL-13 production. Eur J Immunol. 2000;30:2344–54. doi: 10.1002/1521-4141(2000)30:8<2344::AID-IMMU2344>3.0.CO;2-7. [DOI] [PubMed] [Google Scholar]
- 32.Lasa M, Abraham SM, Boucheron C, Saklatvala J, Clark AR. Dexamethasone Causes Sustained Expression of Mitogen-Activated Protein Kinase (MAPK) Phosphatase 1 and Phosphatase-Mediated Inhibition of MAPK p38. Mol Cell Biol. 2002;22:7802–11. doi: 10.1128/MCB.22.22.7802-7811.2002. [DOI] [PMC free article] [PubMed] [Google Scholar]
- 33.Issa R, Xie S, Khorasani N, Sukkar M, Adcock IM, Lee K-Y, et al. Corticosteroid Inhibition of Growth-Related Oncogene Protein-α via Mitogen-Activated Kinase Phosphatase-1 in Airway Smooth Muscle Cells. J Immunol. 2007;178:7366–75. doi: 10.4049/jimmunol.178.11.7366. [DOI] [PubMed] [Google Scholar]
- 34.Toh M-L, Yang Y, Leech M, Santos L, Morand EF. Expression of Mitogen-Activated Protein Kinase Phosphatase 1, a Negative Regulator of the Mitogen-Activated Protein Kinases, in Rheumatoid Arthritis Up-Regulation by Interleukin-1′ and Glucocorticoids. Arthritis Rheum. 2004;50:3118–28. doi: 10.1002/art.20580. [DOI] [PubMed] [Google Scholar]
- 35.Thai TH, Calado DP, Casola S, Ansel KM, Xiao C, Xue Y, et al. Regulation of the germinal center response by MicroRNA-155. Science. 2007;316:604–7. doi: 10.1126/science.1141229. [DOI] [PubMed] [Google Scholar]
- 36.Yang Y, Ago T, Zhai P, Abdellatif M, Sadoshima J. Thioredoxin 1 negatively regulates Angiotensin II-Induced cardiac hypertrophy through up-regulation of miR-98/let-7. Circ Res. 2003;108:305–13. doi: 10.1161/CIRCRESAHA.110.228437. [DOI] [PMC free article] [PubMed] [Google Scholar]
- 37.Wang S, Tang Y, Cui H, Zhao X, Luo X, Pan W, et al. Let-7/miR-98 regulate Fas and Fas-mediated apoptosis. Genes Immun. 2011;12:149–54. doi: 10.1038/gene.2010.53. [DOI] [PubMed] [Google Scholar]
- 38.Kumar M, Ahmad T, Sharma A, Mabalirajan U, Kulshreshtha A, Agrawal A, et al. Let-7 microRNA-mediated regulation of IL-13 and allergic airway inflammation. J Allergy Clin Immunol. 2011;128:1077–85. doi: 10.1016/j.jaci.2011.04.034. [DOI] [PubMed] [Google Scholar]
- 39.O’Connell RM, Kahn D, Gibson WS, Round JL, Scholz RL, Chaudhuri AA, et al. MicroRNA-155 promotes autoimmune inflammation by enhancing inflammatory T cell development. Immunity. 2010;33:607–1. doi: 10.1016/j.immuni.2010.09.009. [DOI] [PMC free article] [PubMed] [Google Scholar]
- 40.Wang Y, Lee LC. MicroRNA and cancer-focus on apoptosis. J Cell Mol Med. 2009;13:12–23. doi: 10.1111/j.1582-4934.2008.00510.x. (review) [DOI] [PMC free article] [PubMed] [Google Scholar]
- 41.Umemura M, Kawabe T, Shudo K, Kidoya H, Fukui M, Asano M, et al. Involvement of Il-17 in Fas Ligand-induced inflammation. Int Immunol. 2004;16:1099–108. doi: 10.1093/intimm/dxh111. [DOI] [PubMed] [Google Scholar]
- 42.Wajant H, Pfizenmaier K, Scheurich P. Non-apoptotic Fas signaling. Cytokine Growth Factor Rev. 2003;14:53–66. doi: 10.1016/s1359-6101(02)00072-2. (review) [DOI] [PubMed] [Google Scholar]
- 43.Baumann S, Dostert A, Novac N, Bauer A, Schmid W, Fas SC, et al. Glucocorticoids inhibit activation-induced cell death (AICD) via direct DNA-dependent repression of the CD95 ligand gene by a glucocorticoid receptor dimer. Blood. 2005;106:617–25. doi: 10.1182/blood-2004-11-4390. [DOI] [PubMed] [Google Scholar]
- 44.Zhu H, Shyh-Chang N, Segrè AV, Shinoda G, Shah SP, Einhorn WS, et al. The Lin28/let-7 axis regulates glucose metabolism. Cell. 2011;147:81–94. doi: 10.1016/j.cell.2011.08.033. [DOI] [PMC free article] [PubMed] [Google Scholar]
- 45.Tsokos GC. Systemic Lupus Erythematosus. N Engl J Med. 2011;365:2110–21. doi: 10.1056/NEJMra1100359. (review) [DOI] [PubMed] [Google Scholar]
- 46.Shin MS, Lee N, Kang I. Effector T-cell subsets in systemic lupus erythematosus: update focusing on Th17 cells. Curr Opin Rheumatol. 2011;23:444–8. doi: 10.1097/BOR.0b013e328349a255. [DOI] [PMC free article] [PubMed] [Google Scholar]
- 47.Kuhn A, Beissert S, Krammer PH. CD4(+)CD25(+) regulatory T cells in human lupus erythematosus. Arch Dermatol Res. 2009;301:71–81. doi: 10.1007/s00403-008-0891-9. [DOI] [PubMed] [Google Scholar]
- 48.Stagakis E, Bertsias G, Verginis P, Nakou M, Hatziapostolou M, Kritikos H, et al. Identification of novel microRNA signatures linked to human lupus disease activity and pathogenesis: miR-21 regulates aberrant T cell responses through regulation of PDCD4 expression. Ann Rheum Dis. 2011;70:1496–506. doi: 10.1136/ard.2010.139857. [DOI] [PubMed] [Google Scholar]
- 49.Wang G, Tam LS, Kwan BC, Li EK, Chow KM, Luk CC, et al. Expression of miR-146a and miR-155 in the urinary sediment of systemic lupus erythematosus. Clin Rheumatol. 2012;31:435–40. doi: 10.1007/s10067-011-1857-4. [DOI] [PubMed] [Google Scholar]
- 50.Wang G, Tam LS, Li EK, Kwan BC, Chow KM, Luk CC, et al. Serum and urinary cell-free MiR-146a and MiR-155 in patients with systemic lupus erythematosus. J Rheumatol. 2010;37:2516–22. doi: 10.3899/jrheum.100308. [DOI] [PubMed] [Google Scholar]
Associated Data
This section collects any data citations, data availability statements, or supplementary materials included in this article.
Supplementary Materials
Supplemental FIGURE 1. One μM of MP inhibits T cell function without causing cell death. T cells stimulated and cultured for 30 hours with the indicated concentrations of MP. A. Percent of live total T cells measured by flow cytometric exclusion of PI stain. Mean and standard deviation from 3 independent experiments is shown. B. Fold change of IL2RA on T cells, by flow cytometric analysis. Cells first gated on lymphoid population (FSC,SSC), then CD3+. MFI of IL2RA then recorded. Mean and standard deviation of 3 independent experiments is shown. C. Cytokine levels in supernatents of cultured T cells measured by ELISA. Representative data. (*indicates p<0.05, ratio t test or paired t test)