

Abstract
Oxidatively generated DNA damage induced by the aromatic radical cation of the pyrene derivative 7,8,9,10-tetrahydroxytetrahydrobenzo[a]pyrene (BPT), and by carbonate radicals anions, was monitored from the initial one-electron transfer, or hole injection step, to the formation of hot alkali-labile chemical end-products monitored by gel electrophoresis. The fractions of BPT molecules bound to double-stranded 20–35-mer oligonucleotdes with non-contiguous guanines G, and grouped as contiguous GG and GGG sequences, were determined by a fluorescence quenching method. Utilizing intense nanosecond 355 nm Nd: Yag laser pulses, the DNA-bound BPT molecules were photoionized to BPT•+ radicals by a consecutive two-photon ionization mechanism. The BPT•+ radicals thus generated within the duplexes selectively oxidize guanine by intraduplex electron transfer reactions, and the rate constants of these reactions follow the trend 5′-..GGG.. > 5′-..GG.. > 5′-..G… In the case of CO3•− radicals, the oxidation of guanine occurs by intermolecular collision pathways and the bimolecular rate constants are independent of base sequence context. However, the distributions of the end-products generated by CO3•− radicals, as well as by BPT•+, is base sequence context-dependent and is greater than in isolated guanines at the 5′-G in 5′-…GG… sequences, and the first two 5′-guanines in the 5′-..GGG sequences. These results help to clarify the conditions that lead to a similar or different base sequence dependence of the initial hole injection step and the final distribution of oxidized, alkali-labile guanine products. In the case of the intermolecular one-electron oxidant CO3•−, the rate constant of hole injection is similar for contiguous and isolated guanines, but the subsequent equilibration of holes by hopping favors trapping and product formation at contiguous guanines, and the sequence dependence of these two phenomena are not correlated. In contrast, in the case of the DNA bound oxidant BPT•+, the hole injection rate constants, as well as hole equilibration, exhibit a similar dependence on base sequence context, and are thus correlated to one another.
Introduction
The Human genome is under continuous attack by free radicals, ionizing radiation and other DNA-damaging species. These reactions give rise to diverse, potentially mutagenic oxidative modifications (lesions) of the nucleic acid bases. The generation of DNA lesions in tissues under conditions of oxidative stress accompanying chronic inflammation and various diseases, increases the risk of malignant cell transformation leading to the development of tumors.1,2 The distribution of oxidatively modified bases along the DNA helix is a nonrandom process.3–5 Damage of guanine, the most easily oxidizable nucleic acid base6 occurs with greater frequencies than damage to other natural DNA bases (A, C and T). In early experiments it was shown that photoexcitation of DNA in its normal B-type double helical form by intense nano- or picosecond 266 nm laser pulses induces a greater damage of guanines positioned on the 5′-side of purine bases, especially adjacent to guanine, than on guanines adjacent to pyrimidines.7 This selectivity of G oxidation in different sequence context has been also observed employing one-electron oxidants generated by photosensitization of metal complexes,3,8 anthraquinones,4,9 naphthalimides,10 riboflavin (RF),11,12 4′-pivaloyl derivatives,13,14 cyanobenzoyl and cyanobenzophenone substituted 2′-deoxyuridine15,16 and other chemical one-electron oxidants.17,18 Saito and co-workers have shown that the enhancement of oxidative guanine damage increases with the number of contiguous guanines according to 5′-G < 5′-GG < 5′-GGG and that this phenomenon is correlated with the calculated gas phase ionization potentials (IP) for guanines in different sequence contexts.11,19,20 Siebbeles and co-workers calculated distributions of a positive charge in sequences of two or three adjacent guanines, flanked by other nucleobases that provide a useful model for mapping the reactivities of guanines in different sequence contexts.21,22 By analyzing the detailed kinetics of electron transfer reactions, Lewis, Wasielewski and co-workers determined the rate constants of forward- and back-transfer from single G to a GG doublet and a GGG triplet.23,24 The free energy values for these reversible hole transfer reactions are ~ − 0.052 V and −0.077 V, respectively. The rate constants for oxidation of isolated guanines vs. 5′-guanines in a GG sequence context was elucidated by Sistare et al. using an electrochemical method.25
Recently we have explored the oxidation of guanine in different sequence contexts by nitrosoperoxycarbonate26 and carbonate radical anion 27–30 arising from the decomposition of this a chemical mediator of inflammation in vivo.2 The CO3•− radicals oxidize guanine in DNA by a one-electron abstraction reaction that, by a series of subsequent oxidation steps and chemical reactions, culminates in the formation of guanine oxidation products (mainly the hot alkali- and Fpg-labile spiroiminodihydantoin lesions).27–30 Because of the lower ionization potentials of runs of guanines as compared to isolated guanines in double-stranded DNA, a higher rate constant of the initial CO3•− -mediated electron transfer step was anticipated in duplexes with isolated …G… or …GG.. and …GGG… sequences. Paradoxically, this rate constant exhibits only small variations within a narrow interval [(1.5 – 3.0)× 107 M−1s−1] and is thus independent of sequence context.30 This result is in seeming contradiction to the Saito model11,19,20 because the yields of oxidized guanine end-products within contiguous …G1G2… and …G1G2G3… sequences are usually significantly higher at G1 and G1G2, respectively.4,5,11
There are few direct kinetic measurements of electron transfer rate constants relevant to the oxidation of guanines in double-stranded DNA in different sequence contexts. In this work we have sought to correlate the rate constants of the first one-electron oxidation of guanine in DNA with the yield of chemical oxidation products that are initiated by this electron transfer step. The objectives of this work were to compare the sequence dependence of the initial one-electron oxidation of guanine using the bulky aromatic radical cation of the pyrene derivative, 7,8,9,10-tetrahydroxytetrahydrobenzo[a]pyrene (BPT) and to compare the oxidation rates and the distributions of oxidized guanine end-products with those produced by CO3•− radicals.
Experimental Section
Materials
All organic solvents and inorganic salts were obtained from Sigma-Aldrich Fine Chemicals, and were used as received. The oligonucleotides from Sigma Genosys (Woodlands, TX) were purified, and desalted using reversed-phase HPLC. The integrity of the oligonucleotides was confirmed by MALDI-TOF mass spectrometry. The damaged strands presented in the oligonucleotide samples in minor quantities were digested by a standard hot piperidine treatment31 and removed by polyacrylamide gel electrophoresis. A pyrene derivative with enhanced water-solubility, 7,8,9,10-tetrahydroxytetrahydrobenzo[a]pyrene (BPT) was prepared by hydrolysis of racemic anti-BPDE (7r,8t-dihydroxy-t9,10-epoxy-7,8,9,10-tetrahydrobenzo[a]pyrene, a gift from Dr. S. Amin, Pennsylvania State University, Hershey, PA) and purified by reverse phase HPLC. A stock solution of BPT (0.5 – 1mM) in methanol was prepared and small aliquots were added to the oligonucleotide solutions; concentrations of BPT in the sample solutions were generally ~ 10 μM estimated from the molar extinction coefficient of BPT, ε343 = 2.9×10⁴ M−1cm−1.32
Laser Flash Photolysis and Measurements of Electron Transfer Rates
The kinetics of oxidative reactions initiated by free radicals were monitored using a fully-computerized kinetic spectrometer system (~7 ns response time) described elsewhere.33 Briefly, in the experiments using BPT as the photosensitizer, the samples were excited by 355 nm nanosecond Nd:YAG laser (35 – 40 mJ/pulse/cm2, 10 Hz) or by 308 nm nanosecond XeCl excimer laser (60 mJ/pulse/cm2, 10 Hz) in the experiments using CO3•− radicals as oxidant employing a computer-controlled electromechanical shutter to select a single actinic laser shot. The transient absorbance was probed along a 1 cm optical path of a 0.4 × 1 cm quartz cell (0.25 mL sample volume) by a light beam (75 W xenon arc lamp) oriented perpendicular to the laser beam. The signal was detected with a Hamamtsu 928 photomultiplier tube and recorded by a Tektronix TDS 5052 oscilloscope operating in its high resolution mode that provided a satisfactory signal/noise ratio after a single laser shot. The rate constants were determined by least squares fits of the appropriate kinetic equations to the experimentally measured transient absorption profiles as described in detail elsewhere.28,32 The values reported are averages of five independent measurements.
The relevant and important steps leading to the oxidation of oligonucleotides by BPT•+ radicals are summarized in Table 1.
TABLE 1.
Basic Reactions Relevant to the Oxidation of Guanines in 2′-Deoxyribooligonucleotides (oligo) by BPT•+ Radicals
| N | Reaction | kn, M−1s−1 | ref |
|---|---|---|---|
| 1 | BPT + 2 hν → BPT•+ + eh− | 32,34 | |
| 2 | eh− + O2 → O2•− | 1.9×10¹⁰ (~ 0.2 μs)a | 35 |
| 3 | BPT•+ + oligo → | (0.04 – 2)× 109 | |
| 4c | eh− + N2O + H+ → N2 + OH• | 9.1×10⁹ (~ 4 ns)b | 35 |
Lifetime of hydrated electrons in air-equilibrated solutions, [O2] = 0.27 mM.
Lifetime of hydrated electrons in N2O-saturated solutions, [N2O] = 26.5 mM.
This reaction is mentioned here only because it was used to identify the fast kinetic phase of the transient absorption decay at 455 nm (see, Figure 2) attributed to hydrated electrons that are scavenged by N2O.
Intense 355 nm nanosecond laser pulse excitation induces two-photon ionization of BPT, a pyrene-derivative with enhanced water solubility, to form the BPT•+ radical cations and hydrated electrons (reaction 1 in Table 1).32,34 In the presence of oxygen, the hydrated electrons are rapidly scavenged by O2 to form superoxide radical anions (reaction 2) that do not react directly with DNA.36 Thus, the BPT•+ radicals can be used to oxidize guanine in oligonucleotides (reaction 3).32
The CO3•− radicals are generated by two consecutive reactions that begin with the photodissociation of persulfate anions into SO4•− radical anions (reaction 5, Table 2) induced by intense 308 nm excimer laser pulses. In turn, SO4•− radicals detectable via their characteristic absorption band at 455 nm with extinction coefficient37 of 1600 M−1cm−1, oxidize bicarbonate anions into CO3•− radical anions (reaction 4, Table 2). The CO3•− radicals thus formed were directly monitored by the appearance of their characteristic absorption band at 600 nm with extinction coefficient38 of 1970 M−1cm−1. The SO4•− radicals can also oxidize the DNA bases,27,28 and both the SO4•− and the CO3•− radicals can undergo recombination (reactions 6 and 10). It is therefore important to optimize the reaction conditions in order to predominantly observe the reaction kinetics of the electron transfer between CO3•− radicals and the oligonucleotide strands.27
TABLE 2.
Reactions Relevant to the Oxidation of Guanines in 2′-Deoxyribooligonucleotides by CO3•− Radicals
The optimal conditions27,28 were determined by considering the set of rate constants in Table 2. In order to minimize the contribution of the reactions of SO4•− radicals with oligonucleotides (reaction 7 in Table 2), we used high concentrations of HCO3− (300 mM) and much lower concentrations of oligonucleotides (≤ 0.1 mM). Under these conditions, the contribution of the direct oxidation of the oligonucleotides by SO4•− radicals, determined from the ratio of the pseudo first-order rate constants, k7[oligo]/(k8[HCO3−] + k7[oligo]), can be estimated. In the spectroscopic transient absorption experiments, a high oligonucleotide concentration (100 μM) was required in order to maximize the signal/noise ratio. Under these conditions, the k7[oligo]/(k8[HCO3−] + k7[oligo]) ratio was ~ 0.2 and thus ~ 20% of the DNA oxidation events occurred via the SO4•− radicals. However, this did not influence the measurements of the rates of DNA oxidation by CO3•− radicals on submillisecond time scales (τ= 1/k9 [oligo] = 0.4 – 1.7 ms) since the SO4•− radical reactions decay on much faster time scales (τ = 1/{k7 [oligo] + k8 [HCO3−]} ≈ 0.6 μs (Table 2).
Time-Correlated Single-Photon Counting Measurements of Fluorescence Decay Profiles
In the picosecond time-correlated single-photon counting system, the samples were excited by a Coherent Mira 900 fs Ti:Sp laser pumped by an Innova 310 argon ion laser. The output of the Ti:Sp laser (700 nm) is passed through a Conoptics electrooptic light modulator system consisting of a model 350–160 Modulator, a model 25D Digital Amplifier, and a M305 Synchronous countdown device, to reduce the laser pulse frequency from 76 to 1.617 MHz (optimal frequency for monitoring the BPT fluorescence decay profiles), which is then frequency-doubled to provide excitation at 352 nm. The fluorescence was detected at 380 nm using an Aries FF250 monochromator. A Time Harp 100 PC card (PicoQuant, Germany) controlled by an IBM PC computer provided registration of the counts with rates of up to 80 MHz. After deconvolution (PicoQuant FluoFit software), the time resolution of this apparatus is ca. 35 ps. All experiments, including data collection and analysis, were controlled by an IBM PC computer using PicoQuant software.
Preparation of 32P-Endlabeled Oligonucleotides for Strand Cleavage Assays
The oligonucleotide strands (~50 pmol) were labeled at their 5′-termini using OptiKinase (USB, Cleveland, Ohio) and [γ-32P]ATP (Perkin Elmer Life and Analytical Sciences, Boston, MA) at 37 °C for 30 min. Labeling at the 3′-termini was achieved using terminal deoxynucleotidyl transferase (Fermentas Inc., Hanover, MD) and [α-32P]ddATP (Amersham Bioscience Corp. Piscataway, NJ). The labeled samples were purified by polyacrylamide gel electrophoresis and exposed to Kodak X-OMAT AR film (Eastman Kodak Co., Rochester, NY); the required bands were cut out and soaked overnight in 0.4 mL of an elution buffer (0.5 M ammonium acetate, 0.01 M magnesium diacetate). Pure oligonucleotides from the extracted samples were isolated by the standard ethanol precipitation. The samples used in the photocleavage experiments were prepared by mixing “cold” and radiolabeled strands to obtain ~ 50 μL of the oligonucleotide with final concentrations of ~ 100 μM. The DNA duplexes were prepared by annealing the two strands in 20 mM phosphate buffer solution (pH 7) containing 0.1 M NaCl at 90 °C for 2 min, and then allowing the samples to cool slowly back to room temperature overnight.
Polyacrylamide DNA Strand Cleavage Assay
The 10 μL samples of duplexes (~ 10 μM) containing 32P 5′- or 3′-end labeled strands in 2×2 mm square pyrex capillary tubes (Vitrocom, Inc., Mountain Lakes, NJ) were irradiated for fixed periods of time to initiate strand cleavage. To generate BPT•+ and CO3•− radicals we used 355 nm and 308 nm laser pulses (~ 20 mJ pulse−1 cm−2, 10 Hz), respectively. The reaction mixtures containing ~50 μM riboflavin (A355 ~ 0.3/1 cm) were excited by 100 mW Xe arc lamp using a dichroic mirror to select the 320 – 360 spectral range. After the irradiation, the reaction mixtures containing persulfate were quenched by the addition of 1μL of 0.1 M β-mercaptoethanol (or 0.1 M Na2S2O4) solution. The oxidatively modified DNA was isolated from the photoirradiated samples by the standard ethanol precipitation and treated with hot piperidine to induce strand breaks. The irradiated samples were mixed with 100 μL 1 M piperidine, heated at 90 °C for 30 min, vacuum dried, and piperidine traces were removed by repeated lyophilization (2 times). The cleaved oligonucleotide fragments were resolved on a 20% denaturing acrylamide/bisacrylamide (19:1) gel containing 7 M urea on a 38×50 cm Sequi-Gen Cell (Bio-Rad, Melville, NY). The vacuum dried gels were quantitatively assayed using a Storm 840 Phosphorimage System (GE Healthcare). The extent of cleavage was estimated from densitometric traces of the autoradiograms utilizing Storm 840 software package. Here, we have investigated in detail the cleavage patterns of double-stranded oligonucleotides exposed to the oxidation by CO3•− radicals in air-saturated solutions. In these experiments, the oligonucleotide duplex concentration was only 10 μM, and thus ~ 98% of the observed cleavage results from the oxidation of the oligonucleotides by CO3•− rather than by SO4•− radicals (see above). The fractions of cleaved oligonucleotide strands were kept below 20% to minimize non-linear effects.4
Results and Discussion
The kinetics of oxidation of guanines in duplexes with non-contiguous or contiguous guanines in isolated G, or contiguous GG, or GGG sequence contexts (Table 3) by BPT•+ and CO3•− radicals were compared using transient absorption methods. The formation of oxidized guanine products was observed by treating the irradiated oligonucleotides with hot piperidine and viewing the cleavage products by high resolution gel elctrophoresis methods. The objectives were to elucidate the relationships between one-electron oxidation rates and the sequence-dependent distributions of alkali-labile strand breaks initiated by the primary electron abstraction events in different oligonucleotide duplexes.
TABLE 3.
Oligonucleotides Studied
| designation | Oligodeoxyribonucleotide |
|---|---|
| 1d | 5′-d(AGATTTTTTTTTTTTTTAGA) 3′-d(TCTAAAAAAAAAAAAAATCT) |
| 2d | 5′-d(AAATTTGTTTTTTGTTTAAA) 3′-d(TTTAAACAAAAAACAAATTT) |
| 3d | 5′-d(AAATTTTTTGGTTTTTTAAA) 3′-d(TTTAAAAAACCAAAAAATTT) |
| 4d | 5′-d(AAATTTGTTTGTTTGTTTAAA) 3′-d(TTTAAACAAACAAACAAATTT) |
| 5d | 5′-d(AAATTTTTTGGGTTTTTTAAA) 3′-d(TTTAAAAAACCCAAAAAATTT) |
| 6d | 5′-d(AAATTTTTTTTTTTTTTTAAA) 3′d(TTTAAAAAAAAAAAAAAATTT) |
| 7d | 5′-d(TTGTTTGTGGGTGTTTGTT) 3′-d(AACAAACACCCACAAACAA) |
| 8d | 5′-d(TTGTTTGTTTGGGTTTGTTTGTT) 3′-d(AACAAACAAACCCAAACAAACAA) |
| 9d | 5′-d(TTGTTTGTTTTTTTTTGGGTTTTTTTTTGTTTGTT) 3′-d(AACAAACAAAAAAAAACCCAAAAAAAAACAAACAA) |
Fractions of BPT Molecules Bound to the DNA
The BPT molecules are known to form noncovalent intercalation complexes with double-stranded DNA40 and with oligonucleotides, with moderate association constants.41 Therefore, the laser pulse-induced photoionization of BPT can occur either within a DNA complex or in solution. In order to better understand the kinetics of decay of the BPT•+ radical cations, it was necessary to determine the fractions of BPT molecules bound to the oligonucleotide duplexes under our experimental conditions (100 μM double-stranded oligonucleotides, 100 mM NaCl). The fractions of BPT molecules in complexes with the DNA were deduced from an analysis of the fluorescence decay profiles determined by time-correlated single-photon counting techniques42 as described by us earlier.41
In air-equilibrated aqueous solutions, the decay of the BPT fluorescence is close to mono-exponential with lifetime, τ0 = 129 ns (see, Figure S1A in Supporting Information). However, in 100 μM solutions of the duplexes (Table 3), the fluorescence of the BPT is strongly quenched,43 and the fluorescence decay profiles can be analyzed in terms of a sum of three exponentials:
| (11) |
with lifetimes, τ1, τ2, and τ3, and relative amplitudes, I1, I2, and I3, respectively, where I1+I2+I3 = 1. (Figure S1B in Supporting Information). The lifetimes τ3 are in the range of 106 – 120 ns, i.e., somewhat shorter than the lifetime of free BPT (τ0 = 129 ns) due to the contribution of the dynamic quenching of BPT in the singlet excited state by DNA molecules.42 The values of I3 are in the range of ~ 0.1 to 0.2 and are attributed to the fraction of free BPT molecules. The lifetimes τ1 and τ2 are significantly shorter and are in the range of 0.8 – 2.3 ns and 12 – 20 ns, respectively. These short lifetimes are attributed to BPT molecules in complexes with double-stranded DNA molecules, and the sum of amplitudes I1 and I2 are assumed to be equal to the fractions of BPT molecules (ϕ) bound to the DNA.41–43
The values of ϕ monotonously increase with increasing concentrations of DNA duplexes (see, Figure S2 in Supporting Information); at a duplex concentration ([duplex]) of 100 μM, practically all BPT molecules are bound to DNA and the ϕ values are in the range of 0.8 to 0.9 for a series of six oligonucleotide duplexes (Table S2, Supporting Information). The binding constants, K = (1.4±0.3)× 105 M−1 were obtained by fitting the following equation
| (12) |
to the experimental data points (Figure S2). The values of K are not a function of the number of guanines or of their mode of grouping into separated or contiguous guanines. These observations are consistent with our previous experiments that showed that the BPT fluorescence is efficiently quenched by G, T (and C) bases,42,44 while A is at best a very weak quencher.44
Heterogeneous Kinetics of Guanine Oxidation by BPT•+ Radicals in DNA
The one-electron oxidation of DNA duplexes by BPT•+ radical cations was triggered by intense 355 nm nanosecond laser pulses that induce efficient tandem two-photon absorption and ionization of BPT.32,34,42 We have shown previously that BPT•+ radical cations selectively oxidize guanine but not any of the other DNA bases, A, C or T.32,34,42
The photoionization of BPT is accompanied by the ejection of electrons into the aqueous environment thus generating hydrated electrons (Table 1). In the absence of any DNA, the decay of BPT•+ radical cations and the hydrated electrons are detected by their characteristic absorption bands with maxima at 455 and near 720 nm, respectively (Figure 1A).
Figure 1.
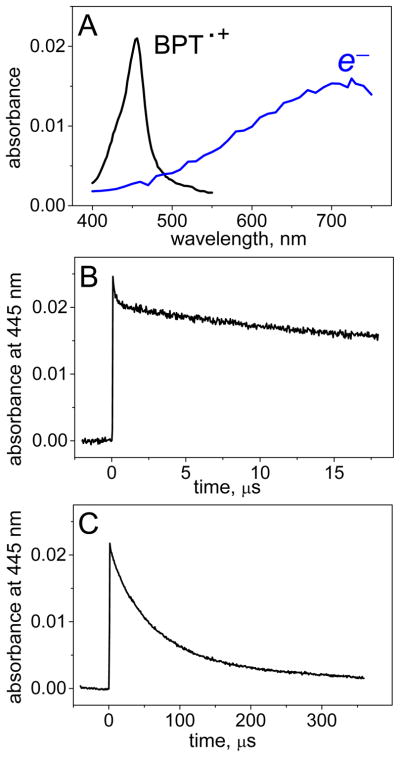
Kinetics of decay of BPT•+ radicals recorded at 455 nm in solution in the absence of DNA. Panel A: transient absorption spectra of BPT•+ radicals and hydrated electrons (e−) after a single-laser pulse excitation. Panels B and C: decay profiles of BPT•+ radicals shown on two different time scales. The experiments were recorded after photoexcitation of free BPT (8.3 μM) by actinic 355 nm Nd: Yag laser pulses in air-equilibrated buffer solutions (pH 7.5) containing 100 mM NaCl.
The hydrated electrons have a very broad absorption spectrum with a short wavelength tail that overlaps with the absorption spectrum of the BPT•+ radicals at 455 nm (Figure 1A). In air-equilibrated solutions, the decay monitored at 455 nm occurs in two phases: the fast nanosecond kinetic component with τe ~ 200 ns (Figure 1B) attributed to the trapping of hydrated electrons in reaction with molecular oxygen (reaction 2, Table 1), and the slow microsecond kinetic component assigned to decay of the BPT•+ radicals (Figure 1C). Typical transient absorption profiles of the BPT – DNA duplex (3d) in air-equilibrated solutions, following excitation with 355 nm pulses, are depicted in Figure 2.
Figure 2.

Decay profiles of BPT•+ radicals recorded at 455 nm in the presence the oligonucleotide duplex 3d (100 μM) that contains two contiguous guanines (…GG… sequence context). Panel A: transient absorptions recorded in air-equilibrated (black) and N2O-purged (red) solutions; the inset shows the decay of hydrated electrons at 650 nm. Panel B: complete decay of BPT•+ in N2O-purged solution. The kinetic traces were recorded after photoexcitation with actinic 355 nm Nd: Yag laser pulses of BPT (8.3 μM) in buffer solutions (pH 7.5) containing 100 mM NaCl.
The major portion of the decay at 455 nm occurs in the microsecond range (Figure 2B), but a fast decay component in a submicrosecond time range is also observed (Figure 2A). This fast component with τe ~ 200 ns (Figure 2A) is attributed to the decay of hydrated electrons in reaction 2 (Table 1). This component is evident in Figures 1B and 2A, and at 650 nm (Figure 2A, inset), and disappears in the presence of N2O (Figure 2A) that reduces τe up to ~ 4 ns in N2O-saturated solutions (reaction 4, Table 1). Therefore, this fast component has been neglected in analyzing the decay profiles of the BPT•+ radicals, and our focus is on the second component in the microsecond time range (Figure 1C) that represents the decay of BPT•+ radical cations.
The microsecond time scale decay profile due to BPT•+ radicals can be described by the following two-exponential model with rate constants, k1, k2, and relative amplitudes, a1, a2, and a3 (a1+a2+a3=1):
| (13) |
The amplitude A(t) does not return to zero, indicating that a small fraction (a3 = 0.03) of the BPT•+ radicals decay by chemical reaction pathways that are characterized by broad absorption spectra in the 350 – 600 nm range, as reported by us earlier.32 The rate constant k1, k2 and amplitudes a1 and a2 for different duplexes are summarized in Table 4.
TABLE 4.
Kinetic Parameters of the Duplex Oxidation by the BPT•+ Radicals
| oligodeoxyribonucleotide | k1, s−1 (a1) | k2, s−1 (a2) | ka, s−1 | |
|---|---|---|---|---|
| 1d | 5′-d(AGATTTTTTTTTTTTTTAGA) 3′-d(TCAAAAAAAAAAAAAATCT) |
(3.5±0.3)× 105 (0.46) | (4.0±0.4)×104 (0.46) | (1.8±0.2)×105 |
| 2d | 5′-d(AAATTTGTTTTTTGTTTAAA) 3′-d(TTTAAACAAAAAACAAATTT) |
(8.4±0.8)×104 (0.40) | (1.6±0.2)×104 (0.47) | (4.2±0.4)×104 |
| 3d | 5′-d(AAATTTTTTGGTTTTTTAAA) 3′-d(TTTAAAAAACCAAAAAATTT) |
(2.2±0.2)×105 (0.26) | (4.1±0.4)×104 (0.71) | (8.4±0.4)×104 |
| 4d | 5′-d(AAATTTGTTTGTTTGTTTAAA) 3′-d(TTTAAACAAACAAACAAATTT) |
(1.2±0.1)×105 (0.40) | (1.9±0.2)×104 (0.40) | (5.4±0.5)×104 |
| 5d | 5′-d(AAATTTTTTGGGTTTTTTAAA) 3′-d(TTTAAAAAACCCAAAAAATTT) |
(2.0±0.2)×105 (0.74) | (1.8±0.2)×105 | |
| 6d | 5′-d(AAATTTTTTTTTTTTTTTAAA) 3′d(TTTAAAAAAAAAAAAAAATTT) |
(2.4±0.2)×104 (0.50) | (5.4±0.5)×103 (0.43) | (1.5±0.2)×104 |
| 8d | 5′-d(TTGTTTGTTTGGGTTTGTTTGTT) 3′-d(AACAAACAAACCCAAACAAACAA) |
(2.4±0.2)×105 (0.59) | (1.9±0.2)×104 (0.39) | (1.5±0.2)×105 |
| no DNA | (2.3±0.2)×104 (0.68) | (6.2±0.6)×103 (0.29) | (1.8±0.2)×104 |
The decay kinetics of BPT•+ radicals in air-equilibrated solutions depend on base sequence context (Figure 3).
Figure 3.

Rate constants of decay of BPT•+ radicals (defined by eq. 3) in the absence and presence of different oligonucleotide duplexes (100 μM). Panel A: decay parameters k1 and k2. Panel B: amplitudes a1 and a2. BPT: no DNA, duplex 1d: two single G near the ends of the duplex; 2d: two single G in the interior of the duplex; 3d: two contiguous G; 4d: three single G in the interior of the duplex; 5d: three contiguous G in the interior of the duplex; 6d: no guanines in the duplex. The values of the kinetic parameters were obtained by the best least squares fits of eq 12 to the BPT•+ radical decay profiles (455 nm) recorded in air-equilibrated buffer solutions (pH 7.5) containing 100 mM NaCl.
As in the case of free BPT•+, the two-exponential model (eq 13) provides the best fit to the microsecond transient absorption profiles. Since 80 – 90% of the BPT molecules are bound noncovalently to the DNA duplexes at the 100 μM concentrations used (Table S1), it is concluded that most of the BPT•+ radicals generated are also bound to the DNA. The decay constants k1 and k2 in the presence of duplex 6d that contains only A and T are the same, within experimental error, as in the absence of any DNA. However, the rate of decay of BPT•+ radicals is markedly accelerated in duplexes that contain guanines, and the rate constant k1 is more significantly enhanced than k2. As shown previously, the decay of BPT•+ radicals occurs by a one-electron transfer reaction from guanine, while the decay of BPT•+ radicals by dTMP, dAMP, and dCMP is more than 104 times less efficient than for dGMP.32
Effects of Distribution of Guanines on the Decay of BPT•+ Radicals
In the presence of the duplexes 1d – 5d that contain guanines, the decay rate of BPT•+ radicals is significantly enhanced, and this effect depends on the number of guanine bases and their positions in the sequence (Figure 3). In the duplex 1d with two separated G near the termini of the duplexes, the values of k1 and k2 are greater by factors of ~ 15 and 8, respectively, than those in duplex 6d containing no guanines (Figure 3A). The values of k1 and k2 in the duplex 2d with two separated G in the middle of the duplex are smaller by factors of ~ 4 and 2.5, respectively, than the values in duplex 1d with two G near the ends of the duplexes. In duplex 4d with three non-contiguous G in the interior of the duplex, the values of k1 and k2 are similar [k1(4d) = 1.4 k1(2d), and k2(4d) = 1.2 k2(2d)] to those in duplex 2d in the interior of the duplex. In all these duplexes with two or three non-contiguous guanines, the values of a1 are close in value to the values of a2 (Figure 3B). The decay rate constants are enhanced when two or three non-contiguous guanines (2d and 4d) are grouped as contiguous guanines (3d and 5d). In duplex 3d with two contiguous guanines, the values of k1 and k2 are greater by a factor of 2.6 than those in duplex 2d with two separated gaunines (Figure 3A). In duplex 5d with three contiguous guanines, the decay of BPT•+ becomes close to mono-exponential with k1 being greater by a factor of 1.7 than k1 in duplex 4d with three non-contiguous guanines. Thus, the decay rate constants depend less on the number of guanines present in the interior regions of the duplexes studied than on their grouping into two or three contiguous guanines. However, it is evident that non-contiguous guanines near the end of the duplexes are particularly reactive.
Dependence of Decay Rates of BPT•+ Radicals on DNA Concentration
To simplify the kinetic analysis, we define the mean rate constant of BPT•+ decay rate constant defined as follows:
| (14) |
Increasing the concentration of DNA enhances the ka values that are higher at all concentrations in the case of duplex 5d with three contiguous guanines than in the case of duplex 4d with three isolated guanines (Figure 4).
Figure 4.

Dependence of the averaged BPT•+ radical decay constant ka (defined by eq 14) on the concentration of duplex 4d (three isolated guanines) and 5d (three contiguous guanines). The ka values were obtained from the rate constants k1 and k2 (and a1, a2) by a least squares fit of eq 13 to the measured BPT•+ (455 nm) decay profiles recorded in air-equilibrated buffer solutions (pH 7.5) containing 100 mM NaCl, and different concentrations of the DNA duplexes.
The ka vs duplex concentration plots are clearly non-linear, and indicate that rate constants are a function of the fractions of BPT molecules bound to the DNA. However, the enhancement in ka with increasing DNA concentration is less steep than the increase in the fractions of BPT molecules bound to the DNA duplexes determined by the fluorescence quenching method (Supporting Information). This difference can be attributed to the fact that not all BPT molecules bound to the DNA duplexes are capable of undergoing electron transfer reactions with guanines, while the fluorescence of all bound BPT molecules is subject to quenching by both T and G residues. Thus, the DNA concentration dependence ka reflects only the BPT molecules that are close enough to G bases to undergo electron transfer reactions. In contrast, in the case of 2′-deoxyguanosine 5′-monophosphate, dGMP, the decay of the BPT•+ radicals is mono-exponential, and the ka vs [dGMP] plot remains linear up to 2 mM dGMP.32 At [dGMP] ≤ 2 mM, the oxidation of dGMP by BPT•+ can be considered as a typical bimolecular reaction with rate constant, kb = 1.7 × 10⁹ M−1s−1 that is by a factor of ~3 lower than the diffusion-controlled rate constant.
At [duplex] = 100 μM, practically all BPT molecules are bound to the DNA (ϕ = 0.8 – 0.9) and the averaged rate constant, ka (Table 4) is mostly associated with the intraduplex reactions of the oxidation of guanine by BPT•+ radicals (rate constant kG) and also by other pathways (rate constant k0) that do not depend on guanine. A crude estimate of this constant can be obtained by setting ka(6d) ≈ k0, where ka(6d) is the observed decay constant of BPT•+ radicals in duplex 6d that does not contain any guanines. A net overall rate constant of oxidation of guanines in a given duplex by BPT•+ radicals can be defined by:
| (eq 15) |
The values of kG depend strongly on base sequence context as shown in Figure 5A.
Figure 5.

The net rate constants of guanine oxidation (kG) in DNA duplexes by BPT•+ radicals (Panel A) and bimolecular rate constants of DNA oxidation by CO3•− radicals (Panel B). The rate constants were obtained from the analysis of the BPT•+ and CO3•− decay profiles in the presence of the DNA duplexes containing two separated guanines near the ends of the duplex (1d), two single or isolated guanines in the interior of the duplex (2d), two interior contiguous guanines (duplex 3d), three interior separated guanines (duplex 4d), and three contiguous guanines (duplex 5d). All DNA concentrations were 100 μM in 100 mM NaCl, pH 7.5 buffer solution. Note, that dimensions of kG and k9 are different; kG is a first order rate constant (s−1), and k9 is a second order rate constant (M−1s−1).
For example, the value of kG for duplex 3d with two contiguous guanines is larger by a factor ~ 2.6 than for duplex 2d with two separated guanines, while the value of kG for duplex 5d with three contiguous G is larger by a factor of ~ 4.1 than for duplex 4d with three non-contiguous guanines. The value of kG for duplex 4d that has three non-contiguous guanines is about 20% greater than for duplex 2d that has two non-contiguous guanines. On the other hand, the values of kG are similar in the case of duplexes 5d and 8d; both of these have one contiguous GGG sequence, but 8d has four non-contiguous guanines as well. Therefore, there is no simple relationship between the number of guanines in a duplex and kG, although GGG sequences exhibit a significantly greater kG value than those with a single GG sequence (5d and 3d, respectively). The enhanced rate constants of oxidation at GG and GGG sequences are consistent with the Saito model.11,19,20 The kG value for sequence 1d with isolated guanines near the ends in AGA sequence contexts are similar in value to kG in the GGG sequence context in duplex 5d. We attribute this large value of kG to end effects rather than to sequence effects (AGA vs. TGT) for the following reasons. According to Saito et al. who studied the effects of flanking bases on rates of oxidation of guanines in double-stranded DNA, the oxidation of guanine in an AGA sequence context is ~ 7 smaller than in a GGG sequence context,11 in contrast to our findings that kG has the same value in duplexes 1d as in duplex 5d (Figure 5A). Furthermore, the kG value for G in isolated TGT sequences in duplex 4d is four times smaller than in the GGG sequence of duplex 5d, is therefore characterized by a low reactivity, and sequence effects are unlikely to account for the large kG value in duplex 1d.
Kinetics of DNA Oxidation by CO3•− Radicals
A typical transient absorption spectrum of CO3•− radicals generated by the 308 nm laser pulses is depicted in Figure 6 (inset).
Figure 6.

Kinetics of CO3•− decay in the absence and presence of an oligonucleotide duplex 5d containing a single contiguous GGG-triplet, recorded after a single-pulse photoexcitation pulse with an actinic 308 nm excimer laser pulse in air-equilibrated buffer solutions (pH 7.5). The inset shows the transient absorption spectrum of CO3•− radicals recorded 0.1 ms after the 308 nm laser pulse.
The kinetics of the decay of CO3•− radicals can be monitored by following the decay of the absorbance at the 600 nm absorption maximum of the carbonate radical anions.27,28 Typical decay curves depicted in Figure 6 show that in a solution containing the duplex 3d (100 μM), the decay of the CO3•− radicals is faster than in the absence of DNA. The rate constants of DNA oxidation by CO3•− radicals are extracted from these decay curves by methods that have been previously described in detail.27,28 These rate constants, k9 (defined in Table 2), have been measured using the same set of oligonucleotide duplexes as in Figure 5A, are summarized in Table S2 (Supporting Information). We found that in the duplexes (2 – 5) with single G, and contiguous GG and GGG sequences, the values of k9 are close to one another (Figure 5B), in contrast to the effects observed in the case of the oxidation of G by BPT•+ radicals (Figure 5A). Regardless of the number or distribution of guanines in these duplexes 2d, 3d, 4d, or 5d, the guanines are oxidized by CO3•− radicals with rate constants that are almost equal to one another within the narrow range of 1.5×10⁷ – 3.0×10⁷ M−1s−1.30 Within this narrow range of values, the impact of end-effects, as in the case of BPT, cannot be discerned. Nevertheless, such end-effects have been observed on product formation initiated by CO3•− radicals as shown below. These observed end-effects may depend not only on the primary rate constants of electron abstraction from guanine, but also on the subsequent chemical reactions that may depend on solvent exposure as well.
The differences in the effects of base sequence context on the oxidation rate constants of guanine by CO3•− and BPT•+ radicals cannot be explained in terms of differences in reduction potentials alone. Both radicals are strong one-electron oxidants with similar reduction potentials Eo(CO3•− /CO32−) = 1.59 V vs NHE,45 and Eo(BPT•+/BPT) ~ 1.5 V vs NHE32). The reduction potential of guanine is E7 = 1.29 V vs NHE).6 These reduction potentials suggest that both the CO3•− and BPT•+ radicals can oxidize guanine by one-electron transfer mechanisms. The differences in base sequence effects on the electron transfer rate constants can be explained by considering the classical Marcus electron transfer equations46 that defines the rate constant of electron transfer, ket, as follows:
| (16) |
where ΔG0 is the free energy term that is proportional to the differences in redox potentials of the electron donor and acceptor couple, and λ is the reorganization energy. We propose that ket is sensitive to differences in ΔG0 values (or reduction potentials) of ..G.., ..GG.., and ..GGG.. sequences as long as ΔG0 ≥ λ This is the case for large polycyclic aromatic molecules such as the BPT•+ radical cation since the reorganization energy, λ is relatively small.46 This limit is pertinent to the oxidation of guanine by the BPT•+ radical cations since the rate constant, kG (Figure 5A) is sensitive to a lowering of the redox potentials of guanines in contiguous guanine sequences such as GG and GGG.11,19–21 However, the CO3•−/CO32− pair is characterized by a very small self-exchange rate constant (k ~ 0.4 M−1s−1) and thus a relatively high internal reorganization energy,47 characteristic of the one-electron oxidation of diverse organic molecules such as ascorbate, tryptophan, cysteine, and methinone by CO3•− radicals.48 In such cases, λ> ΔG0 and kel can be less sensitive or even insensitive to changes in ΔGo, as observed in the case of the CO3•− radical and discussed in greater detail elsewhere.30
Base Sequence Effects on DNA Cleavage Patterns Induced by Different Oxidants Revealed by Gel Electrophoresis Methods
In order to correlate the initial electron transfer reactions with the formation of photochemical products, we evaluated the extent of oxidative damage at the different guanine residues in single- and double-stranded oligonucleotide as described previously.27,28 Damage to the guanine base residues is revealed in the form of strand cleavage after treatment of the irradiated sequences with hot piperidine, followed by polyacrylamide gel electrophoresis to resolve the cleavage products.27,30 These methods were used to explore the distributions of DNA cleavage patterns generated by three different one-electron oxidants, BPT•+, CO3•− radicals, and riboflavin. The latter was included for comparison because it is a typical and extensively studied type 1 photosensitizer that initiates the oxidation of DNA by a one-electron abstraction mechanism.11,49–51
The laser flash photolysis experiments showed that the rates of guanine oxidation by BPT•+ radicals depend on the sequence context (Figure 5A). Oxidation of contiguous guanines (duplexes 3d and 5d) occurs with rates close to those for the oxidation of guanines positioned near the termini of the duplexes, as in duplex 1d. The oxidation of non-contiguous guanines positioned in the interior of duplexes 2d and 4d is significantly slower. To explore the relationship between the kinetics of one-electron transfer rates and distributions of strand cleavage patterns, we designed a series of additional duplexes (7d – 9d). These duplexes contain two single non-contiguous G near each of the two ends of the duplexes to evaluate end-effects on photochemical damage, and two single guanines in the interior of the duplexes separated by different numbers of T bases from the central contiguous GGG sequence.
The cleavage patterns obtained after exposure of the DNA duplex 7d to the BPT•+ and CO3•− radicals and riboflavin photosensitizer, and after standard hot piperidine treatment, are compared in the gel autoradiographs shown in Figure 7.
Figure 7.

Comparisons of strand cleavage patterns of double-stranded DNA (duplex 7d, 10 μM) generated by CO3•− and BPT•+ radicals, and by riboflavin after incubation with hot piperidine and gel electrophoresis. Autoradiographs of denaturating gels (7 M urea, 20% polyacrylamide gel) showing the cleavage patterns of the duplex 7d labeled at the 5′-termini and excited (A) by a train of 308 nm (~60 mJ/pulse/cm2, 10 pulse/s), or (B) by 355 nm laser pulses (20 mJ/pulse/cm2, 10 pulse/s), or (C) a 100 W Xe arc lamp in air-equilibrated buffer solutions (pH 7.5). Panel A: Lane G: guanine Maxam-Gilbert sequencing lane of unirradiated sequence; Lane 1: Unirradiated sequence (without piperidine treatment); Lane 2: Unirradiated sequence (after hot piperidine treatment); Lane 3: Unirradiated sequence in the presence of Na2S2O8 (after hot piperidine treatment); Lanes 4 – 11: Irradiated sequence (after hot piperidine treatment) irradiated for 2, 5, 10, 15, 20, 30, 40 and 60 s. Panel B – Lane 1: Unirradiated sequence in the absence of BPT (without piperidine treatment); Lane 2: Unirradiated sequence in the absence of BPT (after hot piperidine treatment); Lane 3: Unirradiated sequence in the presence of BPT (after hot piperidine treatment); Lanes 4 – 9: Irradiated sequence (after hot piperidine treatment) irradiated for 5, 10, 15, 20, 40 and 60 s. Panel C – Lane 1: Unirradiated sequence (without piperidine treatment) in the absence of riboflavin; Lane 2: Unirradiated sequence in the absence of riboflavin (after hot piperidine treatment); Lane 3: Unirradiated sequence in the presence of riboflavin (after hot piperidine treatment) Lanes 4 – 11: Irradiated sequence with riboflavin (after hot piperidine treatment) irradiated for 2, 5, 10, 15, 20, 30, 40 and 60 s.
The lane labeled “G” refers to a Maxam-Gilbert sequencing reaction of unirradiated duplex 7d. Strand cleavage is negligible in the unirradiated control sample with or without hot piperidine treatment (lanes 1 and 2). However, after irradiation of the samples, hot piperidine-induced cleavage is observed predominantly at guanine sites and the extent of cleavage increases with irradiation time (lanes 3 – 11, or 3 – 9). Representative histograms obtained by scanning the original gel autoradiograph (Figure 7) are shown in Figure 8 for the case of a short irradiation time of 15 s when the overall level of cleavage is still below 20%.
Figure 8.

Histograms of the autoradiographs of denaturating gels shown in Figure 7 for the three oxidants (A) by CO3•−, (B) BPT•+, and (C) riboflavin. In each case, the profiles are derived from the respective lanes for a 15 s irradiation time of duplex 7d.
In the case of CO3•− radicals, the extent of cleavage is significantly higher at the guanines positioned near the ends of the duplexes (G1 and G7) than cleavage at the other single guanines in the interior of the duplexes (G2 and G6), and at the contiguous G3G4G5 guanines. In contrast, oxidation of the contiguous G3G4G5 sequences is more efficient in the case of oxidation by BPT•+ radicals and by riboflavin. The cleavage efficiencies are highest at the central guanine G4 in the 5′-…TG3G4G5T… sequence context in the case of BPT•+ radicals and by riboflavin. In the case of the CO3•− radicals, the cleavage is also greater at the contiguous G3G4 guanines in the contiguous G3G4G5 sequence than at the isolated neighboring G2 and G6, although the enhancement is smaller than in the case of the BPT•+ and CO3•− radicals. Thus, although the rate constant of one-electron oxidation of guanine in the oligonucleotides studied here by CO3•− radical anions do not follow the Saito relationship in the case of the first electron transfer step (Figure 5B), the distribution of the damaged, hot alkali-labile guanines is in agreement with this model.11,21 Nevertheless, the smaller enhancement of cleavage at G3G4 relative to G2 and G6 (Figure 8A) indicates that both the initial oxidation step and the subsequent equilibration of holes by the hole hopping mechanism influence the observed cleavage pattern (Figure 8A).
The increased damage at guanines G1 and G7 near the two ends of the duplexes evident in Figure 8A, is attributed to an increased solvent exposure and thus a greater reactivity of these guanines with CO3•−radicals, as already discussed. Analogous results are obtained with the duplex 9d containing nine T residues between G2 and G3 and G5 and G6 bases (Figures S3 and S4 in Supporting Information).
Base Sequence Effects on DNA Cleavage Patterns Induced by BPT•+ radicals
The effects of isolated and contiguous guanines in the inner portions DNA duplexes 2d – 5d on the distributions of alkali-labile lesions generated by BPT•+ radicals are compared in Figure 9.
Figure 9.

Histograms of the autoradiographs of denaturating gels (7M urea, 20 % polyacrylamide gel) showing the cleavage patterns generated by BPT•+ radicals after incubation with hot piperidine in duplexes containing two isolated guanines (duplex 2d, A), a GG doublet (duplex 3d, B), three isolated guanines (duplex 4d, C), and a GGG triplet (duplex 5d, D). The samples were excited by 355 nm laser pulses (20 mJ/pulse/cm2, 10 pulse/s) for 20 s.
Oxidative damage of the two single guanines G2 and G1 separated by six T bases in the interior of the duplex 2d occurs with similar efficiencies (Figure 9A). In contrast, cleavage of 5′- G1 is more efficient in duplex 3d containing only two contiguous guanines, G1 and G2 (Figure 9B). Three single interior guanines G1, G2 and G3 separated by three T bases in duplex 4d are also damaged with similar efficiencies (Figure 9C) as in duplex 2d, whereas damage of the GGG sequence in the duplex 5d follows the Saito model.
Effects of Base Sequence Context: Insights into Relationships between the First Electron Abstraction Step and Final Product Formation
The rate constants of the first oxidation step of guanine in DNA by one electron transfer mechanisms depends strongly on base sequence context in the case of BPT•+ radicals, but not in the case of CO3•− radicals (Figure 5). On the other hand, the base sequence patterns of alkali-labile products show similar, preferred cleavage at contiguous GG and GGG sites in both cases. These differences may be understood by considering the series of consecutive steps that result in the ultimate formation of guanine oxidation products: (1) electron abstraction from guanine in the DNA duplex (hole injection), (2) redistribution of the initially injected holes through hole hopping, (3) chemical trapping of holes by chemical reactions, and (4) strand cleavage by hot-piperidine or enzymatic treatment. This series of events is represented schematically in Figure 10.
Figure 10.

Oxidative DNA damage triggered by one-electron oxidation of guanine base by BPT•+ (red arrows) and CO3•− (blue arrows) radicals.
In the first step, the rate of hole injection depends on the rates of one-electron oxidation of guanine that is proportional to the sequence-dependent rate constants, kG (BPT•+) and kg (CO3•−). The data in Figure 5B predict that, in the case of CO3•− radicals, the probability of hole injection will be similar at contiguous GG and GGG sequences and at isolated Gs. In the case of BPT•+ (or riboflavin), the probability of hole injection is greater at contiguous than isolated Gs (Figure 5A). If hole hopping between the different Gs (contiguous and isolated) is fast as compared to trapping of holes by irreversible chemical reaction, there will be a redistribution of holes among the different guanines, being greater at guanines with lowest oxidation potentials.21,22,52–54 In the limit of fast hole equilibration (in comparison with chemical trapping), the hole distribution will thus depend on the base sequence context. All correlation with the initial sequence dependence of hole injection rates, which depends on the oxidant, and the presence or absence of contiguous guanines, will be lost. In such cases, the distribution of oxidation products will be modulated by the rates of the chemical trapping, which can be also sequence-dependent. We have shown that, in the case of BPT•+, the lifetimes of guanine radicals are determined by bimolecular reactions with O2•− radicals derived from the trapping of hydrated electrons by dissolved O2,55 or by bimolecular reactions with CO3•− radicals.29,36 Hence, the distributions of oxidatively modified guanines can differ from the distributions created by hole hopping mechanisms, because chemical trapping can be also sequence dependent. In gel electrophoresis experiments, oxidatively modified bases are cleaved by hot piperidine or enzymatic treatments.31 This step can also contribute to the observed strand cleavage patterns because not all guanine lesions may be hot alkali – labile, e.g., 8-oxoguanine,56 or may be partially labile like 5-guanidino-4-nitroimidazole.57
Conclusions
The formation of alkali-labile bases and the observations of strand cleavage patterns initiated by hole injection into double-stranded DNA is a complex multi-step processes that may or may not directly correlate with the initial rates of one-electron oxidation of guanine bases (hole injection). In the case of oxidation by BPT•+ radical cations, the lower oxidation potentials at contiguous guanines favor higher rate constants of oxidation, kG, than at isolated guanines. Once injected into the …GG… or …GGG… sequences, hole transfer leads to equilibration of holes favoring trapping at the 5′-side guanines with the lowest ionization potentials11, thus generating the observed characteristic hot-alkali-mediated strand cleavage patterns. Therefore, the base sequence context of kG(BPT•+) and the hot-alkali-mediated strand cleavage patterns are similar, as predicted by the Saito model.11 In the case of the CO3•− radical, the one-electron hole injection rate constant kG is nearly independent of sequence context,30 but the patterns of strand cleavage are not too different from those exhibited by the BPT•+ radical. Thus, the oxidation of guanines by CO3•− radicals leads to cleavage patterns that are more influenced by hole hopping and the equilibration of holes in …GG… and …GGG… sequences than by the sequence dependence of the primary hole injection step.
Supplementary Material
Acknowledgments
This work was supported by the National Institutes of Health, Grants 1 R01 CA110261 and CA26735 (P.C.D.), and by a grant from the Kresge Foundation. Components of this work were conducted in the Shared Instrumentation Facility at NYU that was constructed with support from Research Facilities Improvement Grant C06 RR-16572 from the National Center for Research Resources, NIH.
Footnotes
Supporting Information Available: This material is available free of charge via the Internet at http://pubs.acs.org.
References
- 1.Beckman KB, Ames BN. J Biol Chem. 1997;272:19633–19636. doi: 10.1074/jbc.272.32.19633. [DOI] [PubMed] [Google Scholar]
- 2.Dedon PC, Tannenbaum SR. Arch Biochem Biophys. 2004;423:12–22. doi: 10.1016/j.abb.2003.12.017. [DOI] [PubMed] [Google Scholar]
- 3.Nunez ME, Hall DB, Barton JK. Chem Biol. 1999;6:85–97. doi: 10.1016/S1074-5521(99)80005-2. [DOI] [PubMed] [Google Scholar]
- 4.Schuster GB. Acc Chem Res. 2000;33:253–260. doi: 10.1021/ar980059z. [DOI] [PubMed] [Google Scholar]
- 5.Giese B. Annu Rev Biochem. 2002;71:51–70. doi: 10.1146/annurev.biochem.71.083101.134037. [DOI] [PubMed] [Google Scholar]
- 6.Steenken S, Jovanovic SV. J Am Chem Soc. 1997;119:617–618. [Google Scholar]
- 7.Kovalsky OI, Panyutin IG, Budowsky EI. Photochem Photobiol. 1990;52:509–517. doi: 10.1111/j.1751-1097.1990.tb01793.x. [DOI] [PubMed] [Google Scholar]
- 8.Hall DB, Holmlin RE, Barton JK. Nature. 1996;382:731–735. doi: 10.1038/382731a0. [DOI] [PubMed] [Google Scholar]
- 9.Ly D, Kan Y, Armitage B, Schuster GB. J Am Chem Soc. 1996;118:8747–8748. [Google Scholar]
- 10.Saito I, Takayama M, Sugiyama H, Nakatani K, Tsuchida A, Yamamoto M. J Am Chem Soc. 1995;117:6406–6407. [Google Scholar]
- 11.Saito I, Nakamura T, Nakatani K, Yoshioka Y, Yamaguchi K, Sugiyama H. J Am Chem Soc. 1998;120:12686–12687. [Google Scholar]
- 12.Yoshioka Y, Kitagawa Y, Takano Y, Yamaguchi K, Nakamura T, Saito I. J Am Chem Soc. 1999;121:8712–8719. [Google Scholar]
- 13.Meggers E, Kusch D, Spichty M, Wille U, Giese B. Angew Chem, Int Ed Engl. 1998;37:460–462. doi: 10.1002/(SICI)1521-3773(19980302)37:4<460::AID-ANIE460>3.0.CO;2-U. [DOI] [PubMed] [Google Scholar]
- 14.Meggers E, Michel-Beyerle ME, Giese B. J Am Chem Soc. 1998;120:12950–12955. [Google Scholar]
- 15.Nakatani K, Fujisawa K, Dohno C, Nakamura T, Saito I. Tetrahedron Letters. 1998;39:5995–5998. [Google Scholar]
- 16.Nakatani K, Dohno C, Saito I. J Am Chem Soc. 1999;121:10854–10855. [Google Scholar]
- 17.Muller JG, Hickerson RP, Perez RJ, Burrows CJ. J Am Chem Soc. 1997;119:1501–1506. [Google Scholar]
- 18.Hickerson RP, Prat F, Muller JG, Foote CS, Burrows CJ. J Am Chem Soc. 1999;121:9423–9428. [Google Scholar]
- 19.Sugiyama H, Saito I. J Am Chem Soc. 1996;118:7063–7068. [Google Scholar]
- 20.Yoshioka Y, Kawai H, Sato T, Yamaguchi K, Saito I. J Am Chem Soc. 2003;125:1968–1974. doi: 10.1021/ja028039m. [DOI] [PubMed] [Google Scholar]
- 21.Senthilkumar K, Grozema FC, Guerra CF, Bickelhaupt FM, Siebbeles LDA. J Am Chem Soc. 2003;125:13658–13659. doi: 10.1021/ja037027d. [DOI] [PubMed] [Google Scholar]
- 22.Senthilkumar K, Grozema FC, Guerra CF, Bickelhaupt FM, Lewis FD, Berlin YA, Ratner MA, Siebbeles LDA. J Am Chem Soc. 2005;127:14894–14903. doi: 10.1021/ja054257e. [DOI] [PubMed] [Google Scholar]
- 23.Lewis FD, Liu X, Liu J, Miller S, Hayes RT, Wasielewski MR. Nature. 2000;406:51–53. doi: 10.1038/35017524. [DOI] [PubMed] [Google Scholar]
- 24.Lewis FD, Liu J, Zuo X, Hayes RT, Wasielewski MR. J Am Chem Soc. 2003;125:4850–4861. doi: 10.1021/ja029390a. [DOI] [PubMed] [Google Scholar]
- 25.Sistare MF, Codden SJ, Heimlich G, Thorp HH. J Am Chem Soc. 2000;122:4742–4749. [Google Scholar]
- 26.Margolin Y, Cloutier JF, Shafirovich V, Geacintov NE, Dedon PC. Nat Chem Biol. 2006;2:365–366. doi: 10.1038/nchembio796. [DOI] [PubMed] [Google Scholar]
- 27.Shafirovich V, Dourandin A, Huang W, Geacintov NE. J Biol Chem. 2001;276:24621–24626. doi: 10.1074/jbc.M101131200. [DOI] [PubMed] [Google Scholar]
- 28.Joffe A, Geacintov NE, Shafirovich V. Chem Res Toxicol. 2003;16:1528–1538. doi: 10.1021/tx034142t. [DOI] [PubMed] [Google Scholar]
- 29.Crean C, Geacintov NE, Shafirovich V. Angew Chem, Int Ed Engl. 2005;44:5057–5060. doi: 10.1002/anie.200500991. [DOI] [PubMed] [Google Scholar]
- 30.Lee YA, Yun BH, Kim SK, Margolin Y, Dedon PC, Geacintov NE, Shafirovich V. Chem Eur J. 2007;13:4571–4581. doi: 10.1002/chem.200601434. [DOI] [PubMed] [Google Scholar]
- 31.Burrows CJ, Muller JG. Chem Rev. 1998;98:1109–1151. doi: 10.1021/cr960421s. [DOI] [PubMed] [Google Scholar]
- 32.Kuzmin VA, Dourandin A, Shafirovich V, Geacintov NE. Phys Chem Chem Phys. 2000;2:1531–1535. [Google Scholar]
- 33.Shafirovich V, Dourandin A, Huang W, Luneva NP, Geacintov NE. J Phys Chem B. 1999;103:10924–10933. [Google Scholar]
- 34.Shafirovich VY, Levin PP, Kuzmin VA, Thorgeirsson TE, Kliger DS, Geacintov NE. J Am Chem Soc. 1994;116:63–72. [Google Scholar]
- 35.Buxton GV, Greenstock CL, Helman WP, Ross AB. J Phys Chem Ref Data. 1988;17:513–886. [Google Scholar]
- 36.Misiaszek R, Crean C, Joffe A, Geacintov NE, Shafirovich V. J Biol Chem. 2004;279:32106–32115. doi: 10.1074/jbc.M313904200. [DOI] [PubMed] [Google Scholar]
- 37.McElroy WJ. J Phys Chem. 1990;94:2435–2441. [Google Scholar]
- 38.Lymar SV, Schwarz HA, Czapski G. Radiat Phys Chem. 2000;59:387–392. [Google Scholar]
- 39.Ivanov KL, Glebov EM, Plyusnin VF, Ivanov YV, Grivin VP, Bazhin NM. J Photochem Photobiol A. 2000;133:99–104. [Google Scholar]
- 40.Ibanez V, Geacintov NE, Gagliano AG, Brandimarte S, Harvey RG. J Am Chem Soc. 1980;102:5661–5666. [Google Scholar]
- 41.Pirogov N, Shafirovich V, Kolbanovskiy A, Solntsev K, Courtney SA, Amin S, Geacintov NE. Chem Res Toxicol. 1998;11:381–388. doi: 10.1021/tx980006q. [DOI] [PubMed] [Google Scholar]
- 42.Shafirovich VY, Courtney SH, Ya N, Geacintov NE. J Am Chem Soc. 1995;117:4920–4929. [Google Scholar]
- 43.Ibanez V, Geacintov NE, Gagliano AG, Brandimarte S, Harvey RG. J Am Chem Soc. 1980;102:5661–5666. [Google Scholar]
- 44.Geacintov NE, Zhao R, Kuzmin VA, Kim SK, Pecora LJ. Photochem Photobiol. 1993;58:185–194. doi: 10.1111/j.1751-1097.1993.tb09547.x. [DOI] [PubMed] [Google Scholar]
- 45.Huie RE, Clifton CL, Neta P. Radiat Phys Chem. 1991;38:477–481. [Google Scholar]
- 46.Marcus RA, Sutin N. Biochem Biophys Acta. 1985;811:265–320. [Google Scholar]
- 47.Schindler S, Castner EW, Creutz C, Sutin N. Inorg Chem. 1993;32:4200–4208. [Google Scholar]
- 48.Huie RE, Shoute LC, Neta P. Int J Chem Kinet. 1991;23:541–552. [Google Scholar]
- 49.Ravanat JL, Saint-Pierre C, Cadet J. J Am Chem Soc. 2003;125:2030–2031. doi: 10.1021/ja028608q. [DOI] [PubMed] [Google Scholar]
- 50.Buchko GW, Cadet J. Photochem Photobiol. 2006;82:191–199. doi: 10.1562/2005-06-01-RA-562. [DOI] [PubMed] [Google Scholar]
- 51.Douki T, Cadet J. Int J Radiat Biol. 1999;75:571–581. doi: 10.1080/095530099140212. [DOI] [PubMed] [Google Scholar]
- 52.Berlin YA, Burin AL, Ratner MA. J Phys Chem A. 2000;104:443–445. [Google Scholar]
- 53.Berlin Y, Burin AL, Ratner MA. J Am Chem Soc. 2001;123:260–268. doi: 10.1021/ja001496n. [DOI] [PubMed] [Google Scholar]
- 54.Grozema FC, Siebbeles LDA, Berlin YA, Ratner MA. ChemPhysChem. 2002;3:536–539. doi: 10.1002/1439-7641(20020617)3:6<536::AID-CPHC536>3.0.CO;2-6. [DOI] [PubMed] [Google Scholar]
- 55.Yun BH, Lee YA, Kim SK, Kusmin VA, Kolbanovsiy A, Dedon PC, Geacintov NE, Shafirovich V. J Am Chem Soc. 2007;129:9321–9332. doi: 10.1021/ja066954s. [DOI] [PMC free article] [PubMed] [Google Scholar]
- 56.Cullis PM, Malone ME, Merson-Davies LA. J Am Chem Soc. 1996;118:2775–2781. [Google Scholar]
- 57.Neeley WL, Essigmann JM. Chem Res Toxicol. 2006;19:491–505. doi: 10.1021/tx0600043. [DOI] [PubMed] [Google Scholar]
Associated Data
This section collects any data citations, data availability statements, or supplementary materials included in this article.