Abstract
A novel system was developed to acquire synchronous echocardiography, electrocardiography (EKG), and seismocardiography (SCG) data. The system was developed to facilitate the study of the relationship between the mechanical and electrical characteristics of the heart. The system has both a hardware and software component. The hardware component consists of an application-specific device designed and built to acquire both SCG and EKG signals simultaneously. The software component consists of a package developed to record and synchronize data from both the device and a clinical ultrasound machine. A feasibility test was performed by simultaneous acquisition of a synchronous dataset from a human subject.
I. INTRODUCTION
We were motivated by a desire to find the quasistationary phases within a cardiac cycle: determination of these phases is critical for triggering cross-sectional imaging modalities such as computed tomography (CT) and magnetic resonance imaging (MRI) for cardiac imaging. If imaging is triggered in a sub-optimal phase, the cardiac motion results in blurring. Thus far, triggering has invariably depended on electrocardiographic (EKG) signals, which are a surrogate representation of cardiac motion [1]. EKG signals are an excellent representation of cardiac mechanical motion on average since there is no net motion; however, we believe that on a beat-by-beat basis, EKG is not a reliable or accurate representation of instantaneous cardiac motion. On the other hand, ultrasound of the heart, or echocardiography, and perhaps even seismocardiography (SCG), both of which can directly evaluate in real-time the mechanical motion of the heart, could potentially provide more reliable triggers for CT and MRI [2]. With this in mind, we developed a system to acquire synchronous echocardiography, EKG, and SCG data in order to facilitate a greater understanding of the relationship between the mechanical and electrical characteristics of the heart.
Echocardiography, EKG, and SCG data each provide different benefits. By combining these data types, the benefits of each can be leveraged to gain a better understanding than any one type alone could provide. Echocardiography is the imaging of the heart using ultrasound techniques and provides dynamic visual representation of two-dimensional slices through the heart. The most basic echocardiography imaging modes are B-mode and M-mode. B-mode data consists of a sequence of two-dimensional frames of the heart. M-mode data is a single straight-line trace through the heart, recorded in time. This allows for dynamic cardiac behavior to be viewed as a single image. EKG data gives a representation of the electrical activity of the heart and is recorded as voltage function of time. Lastly, SCG data is captured by placing one or more accelerometers on the chest wall and recording the superficially transmitted cardiac vibrations. This data is collected as acceleration versus time [3].
The measurement system was developed to record each of these data types simultaneously, allowing for the acquisition of synchronized data. The system is composed of both a hardware and a software component. The hardware component consists of (1) a custom-built device for acquiring EKG and SCG data at high accuracy and rate, and (2) a commercial, clinical ultrasound machine capable of acquiring both echocardiography and EKG data. The software component of the system is responsible for controlling and recording from the hardware system. The software component has two parts, the interface programmed to control and record from the custom device, and the interface used to control and record from the ultrasound machine.
The feasibility of the measurement system was tested by acquiring synchronous echocardiography, EKG, and SCG data from a subject. This was accomplished by simultaneously recording EKG and SCG data from our custom device, and echocardiography and EKG data from the commercial ultrasound machine.
The driving goal in designing a system for synchronous acquisition of echocardiography, EKG, and SCG data is to ultimately evaluate the utility of triggering cardiac imaging based on the mechanical (echocardiography and/or SCG) rather than the electrical (EKG) signals of the heart.
The rest of this paper is organized as follows. In Section II, a system description including the hardware and software components is provided. In Section III, feasibility of this system is demonstrated by acquiring data from a human subject. Conclusions and avenues for future work are presented in Section IV.
II. System Description
A. Hardware
The hardware component of the system consists of two main subsystems. The first hardware subsystem is a compact custom device designed and built to simultaneously acquire both EKG and SCG data. A custom solution was necessary to acquire EKG and SCG data simultaneously in hardware at high precision and rate (16-bit, 1.2kHz). The second hardware subsystem is the ultrasound scanner. Synchronized data is acquired through the integration of these two subsystems.
The custom-built device consists chiefly of amplifiers, a power supply unit, a multi-channel analog-to-digital converter (ADC), and a hardware interface (Fig. 1). Signals from the EKG leads and accelerometer (ADXL327, Analog Devices, Inc., Norwood, MA) are first fed through two similar two-stage amplifiers (Fig. 2) with adjustable gain to reach a peak-to-peak amplitude of approximately 1V [4]. The accelerometer has a range and sensitivity of ±2.5 g and 420 mV/g respectively where g is the earth’s gravitational acceleration. The total gain of the signal path is the product of G1 and G2. The gain of the first stage instrumentation amplifier, G1, is fixed at 5, whereas the inverting amplifier gain, G2, is tunable from 0 to 20 for the accelerometer or 0 to 200 for the EKG channel. To solve the problem of unpredictable offset-voltage fluctuation caused by static charge on the human body or gravitational force, an integrator low-pass filter feeds back the DC level from the output of the first stage amplifier to cancel out the input offset. The common-mode feedback (CMFB) stage, which has a gain of 20, is essential to the EKG system, since the unknown human body potential easily exceeds the input common mode range. Also, the CMFB stage provides resistance against any electrical noise from the power supply or from the charge distribution on the human body.
Fig. 1.
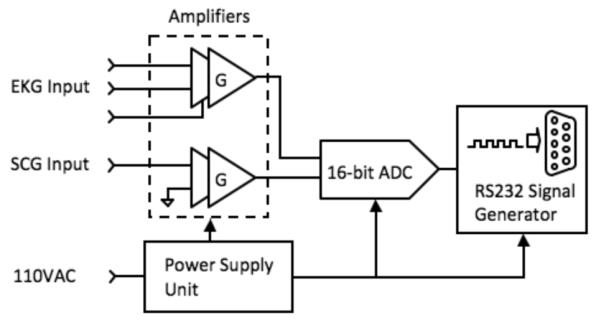
Overview of the hardware subsystem for simultaneously acquiring EKG and SCG data.
Fig. 2.
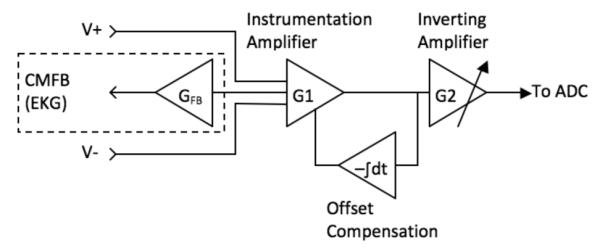
Amplifier design overview.
The acquired analog data is digitized before being recorded by the host computer. A 16-bit analog-to-digital converter (ADC) followed by an RS232 code generator and driver encodes the bit stream from the ADC into RS232 format (Fig. 3). The RS232 protocol was chosen because of its ease of implementation with regards to hardware and software design. A system clock running at 1.8432MHz is divided to produce an ADC output baud rate of 115.2 kHz, resulting in an overall data rate of 1200 samples per ADC channel per second. The RTS and DTR pin of the RS232 interface are used to initialize the system and establish communication between the host and the device.
Fig. 3.
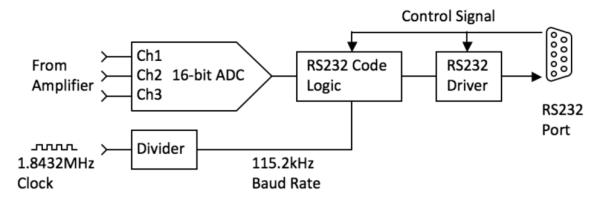
Hardware interface diagram.
The system is powered by a traditional linear power supply (Fig. 4). This avoids switching noise and most electromagnetic interference, both problematic to the small signals associated with EKG and SCG. The power supply is composed of a transformer, a rectifier, and a linear IC regulator. The first regulator in our system generates 5 VDC to supply the ADC and the conventional CMOS digital circuit. The following second stage regulator yields a ±1.65 VDC dual supply to power the two amplifiers.
Fig. 4.

Power supply diagram.
The ultrasound machine used, the SonixTouch Research (Ultrasonix Medical Corp., Richmond, B.C., Canada), is capable of acquiring raw streams of data types associated with echocardiography, Data types of primary interest for this work are B-mode, M-mode, and EKG. The data rates of each of these, in addition to those of the custom device, are provided in Table 1.
TABLE I.
Hardware System Data Rates
| Data Source | Data Type | Data Rate |
|---|---|---|
| Custom Device | EKG Data | 1.2 kHz |
| Custom Device | SCG Data | 1.2 kHz |
| Ultrasound Machine | B-Mode Data | 27 fps |
| Ultrasound Machine | M-Mode Data | 83 Hz |
| Ultrasound Machine | EKG Data | 200 Hz |
B. Software
The software component of the system consists of a host computer interface for the custom device and the commercial software for the ultrasound machine used.
The software for the custom device interfaces through the RS232 port of the device. The control program was written in Visual Basic, and allows for real-time visualization and recording of both the EKG and SCG signals (Fig. 5). The data is stored as signed 16-bit integers at a rate of 1200 samples per second.
Fig. 5.
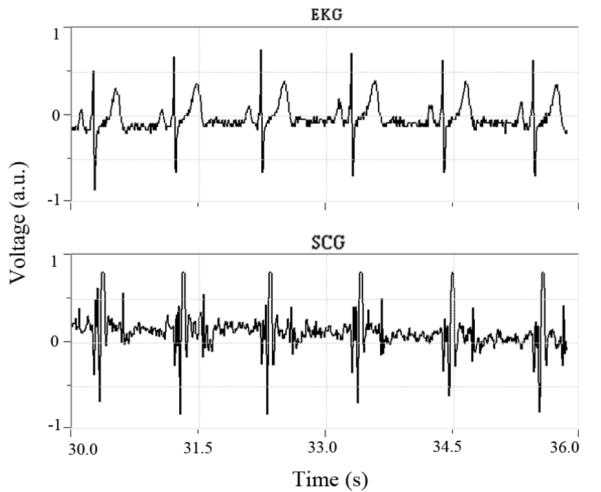
Software interface for our custom device displaying the simultaneously acquired EKG data (top) and SCG data (bottom).
The ultrasound machine software interface allows for the direct capture of B-mode, M-mode, and EKG data. A software development kit (SDK) is available for direct data access and manipulation while the ultrasound system is acquiring data [5].
III. Results
Approval for human subjects testing was obtained from the Emory University Institutional Review Board. A 26-year-old male volunteer subject with no known cardiac conditions was examined, simultaneously recording echocardiography, EKG, and SCG data using both the custom device and the ultrasound machine. An overview of sensor placement is provided is Fig. 6. The data was then synchronized with the primary intent of demonstrating the feasibility of acquiring synchronous echocardiography, EKG, and SCG data.
Fig. 6.
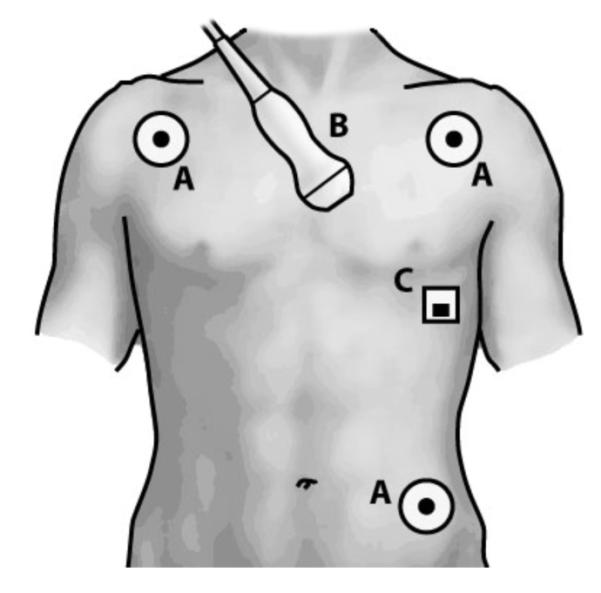
Sensor placement: (A) EKG leads, (B) echocardiography transducer, (C) SCG accelerometer.
The echocardiography data (B-mode and M-mode) was recorded using the parasternal short-axis view at the mitral valve level showing the left ventricle (LV). For reference, a frame of B-mode data is provided in Fig. 7. EKG data was acquired using both the custom device and the ultrasound machine. For SCG data acquisition, the accelerometer connected to the custom device was affixed superficial to the subject’s cardiac apex.
Fig. 7.
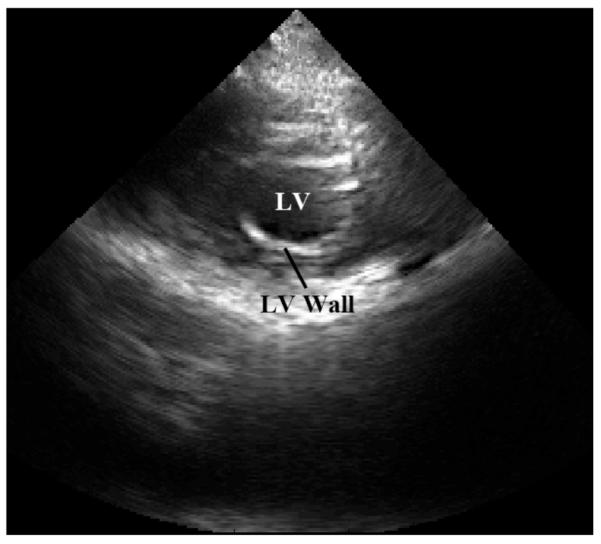
B-mode reference frame of the subject’s heart obtained from a parasternal approach showing the left ventricle (LV) in s hort-axis at the level of the mitral valve. LV and LV wall are shown.
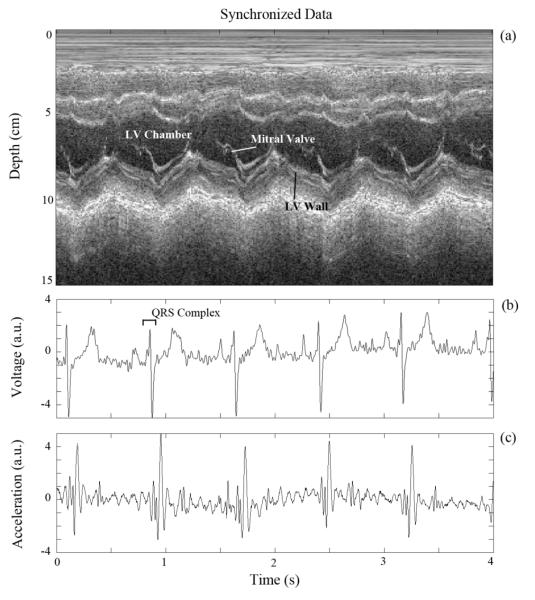
The data was synchronized using the EKG signal, which was common to both the custom device and the ultrasound machine (Fig. 8). As expected, the QRS complex of the EKG signal, associated with peak electrical activity in the cardiac cycle, precedes the major mechanical activity of the SCG signal as shown in Fig. 8 (b) and (c). The EKG data was smoothed with a mild Savitzky-Golay digital filter [6] with a polynomial order of 3 and a frame length of 31 samples (25.8 ms).
Fig. 8.
Synchronized subject data: (a) M-mode echocardiography data, (b) EKG data, and (c) SCG data.
As a pilot investigation, the delays from the R-peak in the QRS complex to multiple features in the SCG signal were calculated. A preliminary analysis of these delays from two different human subjects suggests that the position of the SCG features relative to the EKG R-peak varies between subjects. Assuming SCG features correspond to specific cardiac states, this implies that variation between patients exists regarding the physical state of the heart with respect to the EKG signal.
IV. Conclusion
A system capable of obtaining synchronous echocardiography, EKG, and SCG data was designed and implemented. By collecting these data, the mechanical and electrical nature of the heart can be observed simultaneously.
Having access to this data encourages a number of possible applications. One such application is the possibility of coronary computed tomography gating based on real-time mechanical data from the heart, such as echocardiography or SCG [2]. Other possible applications stemming from the study of synchronized data include the use of SCG to monitor changes in ventricular function [7], as an alternative to EKG to monitor cardiac stress [8], and heart-rate variability in general [9].
The synchronous acquisition system is currently being modified by adding a second accelerometer, making it possible to acquire SCG data along two orthogonal directions at different locations on the chest. It has been demonstrated that SCG measurements provide different cardiac information based on accelerometer placement [10], and by observing two locations simultaneously, we hope to obtain a more accurate model of the cardiac motion.
The novel system described in this paper will be used in a clinical setting to study the variability between EKG and echocardiography/SCG as a function of the individual subject and heart rate. The system will then be used to determine the feasibility of triggering different cardiac imaging techniques, namely CT and MRI, using echocardiography or SCG signals.
Our ultimate goal is to develop a real-time system that evaluates the mechanical motion of the heart to determine the quasi-stationary periods within a cardiac cycle during which acquisition of cross-sectional data by CT or MRI can be triggered.
Acknowledgment
We thank Diana Fouts for her assistance in preparing the figures and for formatting the paper, and Robert House for his assistance in building the custom device. Both are with the Georgia Institute of Technology School of Electrical and Computer Engineering. The paper also benefitted from comments from an anonymous reviewer.
This work was supported in part by the PHS Grant (UL1 RR025008, KL2 RF025009) from the Clinical and Translational Science Award program, National Institutes of Health, National Center for Research Resources, and in part by an Elio-Bracco/American Roentgen Ray Scholarship.
Contributor Information
Carson A. Wick, Department of Radiology and Imaging Sciences, Emory University, Atlanta, GA 30322, USA.
Jin-Jyh Su, School of Electrical and Computer Engineering, Georgia Institute of Technology, Atlanta, GA 30332, USA..
Oliver Brand, School of Electrical and Computer Engineering, Georgia Institute of Technology, Atlanta, GA 30332, USA..
James H. McClellan, School of Electrical and Computer Engineering, Georgia Institute of Technology, Atlanta, GA 30332, USA..
Pamela T. Bhatti, School of Electrical and Computer Engineering, Georgia Institute of Technology, Atlanta, GA 30332, USA..
Srini Tridandapani, Department of Radiology and Imaging Sciences, Emory University, Atlanta, GA 30322, USA..
References
- [1].Desjardins B, Kazerooni EA. ECG-Gated Cardiac CT. Am. J. Roentgenol. 2004 Apr;vol. 182(4):993–1010. doi: 10.2214/ajr.182.4.1820993. [DOI] [PubMed] [Google Scholar]
- [2].Tridandapani S, et al. Echocardiography-Based Selection of Quiescent Heart Phases, Implications for Cardiac Imaging. J. Ultrasound Med. 2005 Nov;vol. 24(11):1519–1526. doi: 10.7863/jum.2005.24.11.1519. [DOI] [PubMed] [Google Scholar]
- [3].Salerno D, Zanetti J. Seismocardiography: A new technique for recording cardiac vibrations. concept, method, and initial observations. J. Cardiovasc. Technol. 1990;vol. 9:111–118. [Google Scholar]
- [4].Kugelstadt T. Getting the most out of your instrumentation amplifier design. 4Q. Texas Instruments Inc; Dallas, TX: 2005. [Google Scholar]
- [5].Yuan L. Ulterius SDK Document. Worcester Polytechnic Inst; Ultrasound Lab: Mar, 2010. [Google Scholar]
- [6].Savitzky A, Golay MJE. Smoothing and Differentiation of Data by Simplified Least Squares Procedures. Analytical Chemistry. 1964 Aug;vol. 36(8):1627–1639. [Google Scholar]
- [7].Salerno DM, Zanetti J. Seismocardiography for monitoring changes in left ventricular function during ischemia. Chest. 1991 Oct;vol. 100(4):991–993. doi: 10.1378/chest.100.4.991. [DOI] [PubMed] [Google Scholar]
- [8].Jerosch-Herold M, et al. The seismocardiogram as magnetic-field-compatible alternative to the electrocardiogram for cardiac stress monitoring. Int. J. of Cardiac Imaging. 1999;vol. 15:523–531. doi: 10.1023/a:1006364518204. [DOI] [PubMed] [Google Scholar]
- [9].Stork M, Trefny Z. Biosignal. Czech Rep; Brno: 2010. Quantitative Seismocardiography System With Separate QRS Detection; pp. 61–68. [Google Scholar]
- [10].Chuo Y, et al. Evaluation of a Novel Integrated Sensor System for Synchronous Measurement of Cardiac Vibrations and Cardiac Potentials. J. of Med. Syst. 2009 Oct;:1–11. doi: 10.1007/s10916-009-9380-8. [DOI] [PubMed] [Google Scholar]


