Abstract
Seismocardiography (SCG), a representation of mechanical heart motion, may more accurately determine periods of cardiac quiescence within a cardiac cycle than the electrically derived electrocardiogram (EKG) and, thus, may have implications for gating in cardiac computed tomography. We designed and implemented a system to synchronously acquire echocardiography, EKG, and SCG data. The device was used to study the variability between EKG and SCG and characterize the relationship between the mechanical and electrical activity of the heart. For each cardiac cycle, the feature of the SCG indicating Aortic Valve Closure was identified and its time position with respect to the EKG was observed. This position was found to vary for different heart rates and between two human subjects. A color map showing the magnitude of the SCG acceleration and computed velocity was derived, allowing for direct visualization of quiescent phases of the cardiac cycle with respect to heart rate.
Keywords: Cardiac gating, computed tomography (CT), coronary angiography, echocardiography, electrocardiography (EKG), seismocardiography (SCG)
I. Introduction
A. Motivation and Background
We are developing a robust technique for identifying, in real time, the quiescent phases of heart motion within a cardiac cycle. This will provide a gating signal to obtain motion-free computed tomographic (CT) images of coronary arteries. We believe that the current electrocardiogram (EKG)-based gating methods are suboptimal and that cardiac imaging can be improved by using a gating signal more representative of cardiac motion.
According to the American Heart Association 2010 statistics [1], one in every six deaths nationally can be attributed to coronary heart disease. The gold standard for evaluating coronary arteries, diagnostic catheter coronary angiography (CCA), is invasive and expensive [2]. More than 1.1 million CCAs are performed annually in America costing approximately $30 billion and resulting in more than 14000 major complications [1]. Nearly 40% of these tests reveal no coronary artery disease (as defined by less than 20% vessel stenosis) [3]. Thus, there is a critical need for an alternative test that is accurate, cost effective, and noninvasive for evaluating coronary arteries.
An alternative diagnostic tool, CT coronary angiography (CTCA) [4], [5], is at the cusp of revolutionizing cardiac diagnosis but is limited by a fundamental problem: the heart is a moving target and images need to be acquired when the heart is in a quiescent phase within a cardiac cycle. The problem is analogous to using a slow shutter speed camera where motion can cause blurring. For CT scanning, such blurring can limit diagnostic capabilities and often leads to expensive and invasive CCAs. This is particularly disconcerting in patients who are ultimately found to have no coronary artery disease.
Current attempts at determining cardiac quiescence using EKG are limited because EKG, although an excellent predictor of the heart’s instantaneous electrical state and the average mechanical state, is an imperfect predictor of the instantaneous mechanical state. In one EKG-based CTCA approach, retrospective-gating [4]-[7], images are obtained throughout the cardiac cycle and only those images obtained at some fixed interval of the EKG R–R interval are used for reconstruction; this approach, while quite reliable, is radiation intensive. In another approach, prospective-gating [5], [8], [9], CT images are obtained only when the heart is presumed to be in quiescence; while this approach minimizes radiation dose [4], [5], [8], it currently depends on EKG for predicting cardiac quiescence and is thus less reliable than retrospective gating, particularly with irregular heart rates. An example of motion artifacts and blurring at various phases within the cardiac cycle is shown in Fig. 1.
Fig. 1.

Coronary CT Angiogram cropped view over the right coronary artery (RCA, indicated by arrow) obtained at various intervals in the cardiac cycle using retrospective gating. Images obtained during the 70% phase minimize motion in this example. However, a priori estimation of the period and duration of this quiescent phase can be inaccurate using EKG alone.
Optimal prospective gating is also critical for reliable atherosclerotic risk screening based on Agatston et al.’s [10] coronary artery calcium scoring. It was shown by Schlosser et al. [11] that both Agatston et al.’s and volumetric scores proved to be highly dependent on the reconstruction (or gating) interval used even with advanced CT scanners. It was also shown that the variable Agatston et al., scores of diastolic reconstructions from different phases of the cardiac cycle in the same patient can result in completely different estimations of coronary risk, ranging from low risk to increased risk. Even more surprisingly, nearly 63% of patients could be assigned to more than one risk group and 10% could be assigned to three risk groups [11].
It was previously shown that another measure of mechanical state, ultrasound (US), may predict quiescent periods within the cardiac cycle more reliably than EKG [12]. While US can evaluate cardiac motion in real time, there are some challenges with integrating US within a CT scanner including 1) difficulties with processing large volumes of 2-D US data quickly and 2) image artifacts caused by the presence of bulky US transducer in the CT scan field. Additionally, US is an active device and requires that CT technologists undergo US training before it can be effectively deployed as a gating tool. A potentially simpler approach for evaluating cardiac mechanical motion in real time is seismocardiography (SCG), which is a passive measurement [13], [14]. SCG data can be captured by placing one or more linear accelerometers on the chest wall and recording the cardiac motion transmitted to the chest wall. These data are collected as acceleration versus time and have been shown to be an accurate indication of cardiac mechanical state [15]-[17].
B. Goal
The ultimate goal of our work is to develop SCG as alternative to EKG for gating cardiac CT scanners. As intermediate steps, in this study, we wish to:
Obtain a greater understanding of the relationship between the mechanical and electrical signals of the heart. To this end, a system was developed to acquire synchronous US, EKG, and SCG data. An earlier version of this hardware system, with only a single SCG input, was reported in [18]. The system includes a custom acquisition device designed and built to synchronously record both EKG and two SCG accelerometer channels at high rate and precision, allowing for a more detailed comparison between these modalities.
Conduct a preliminary comparison of EKG versus SCG in two human subjects and determine the beat-to-beat variability between the electrical state as defined by EKG and the mechanical state of the heart as defined by SCG. This analysis provides further evidence that the relative positions of cardiac events within a cycle may not be constant across all individuals and heart rates and supports the argument for using SCG as a gating device.
C. Paper Organization
The rest of this paper is organized as follows. In Section II, the methods used in designing the hardware system, acquiring human subject data, and signal processing are presented. In Section III, we present the results of a preliminary evaluation of two human subjects showing that SCG can determine quiescent phases within the cardiac cycle. Finally, a detailed discussion, conclusions, and avenues for future work are presented in Section IV.
II. Methods
In this section, we begin with an overview of the trimodal acquisition system, where we provide a hardware description of our EKG-SCG acquisition device. The details of the human subject data acquisition are then given. Finally, the processing methods used to analyze SCG behavior are presented.
A. Design of the Hardware System
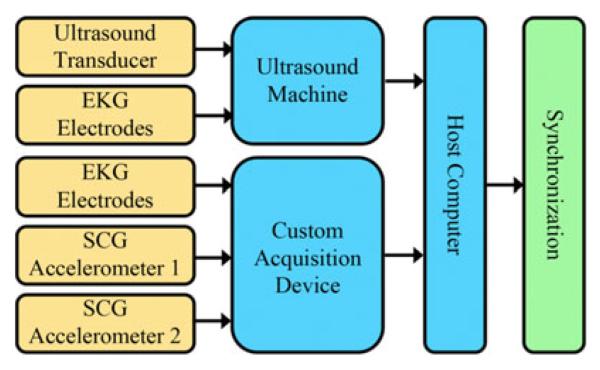
To acquire synchronous US, EKG, and SCG data, as well as compare EKG to SCG, a complete hardware system was developed (see Fig. 2). The US machine used was a SonixTOUCH Research scanner (Ultrasonix Medical Corp., Richmond, BC, Canada) capable of acquiring raw streams of US B-mode, US M-mode, and EKG data. The new hardware system enables synchronization of echocardiographic data with the EKG and SCG data using a custom sensor interface and data acquisition device, i.e., synchronization across all three modalities. The data rates of each data type are provided in Table I.
Fig. 2.
Hardware system overview. The redundancy of the EKG signals from both a custom device and the US scanner allows for temporal synchronization across all three data streams. Two accelerometer inputs are provided to investigate potential interference between CT table and CT gantry motion with the SCG signal, as well as multiple SCG recordings on a single subject.
TABLE I.
Hardware System Data Rates
| Data Source | Data Type | Data Rate |
|---|---|---|
| Custom Device | EKG Data | 1.2 kHz |
| Custom Device | SCG Data | 1.2 kHz |
| Ultrasound Machine | B-Mode Data | 27 fps |
| Ultrasound Machine | M-Mode Data | 83 Hz |
| Ultrasound Machine | EKG Data | 200 Hz |
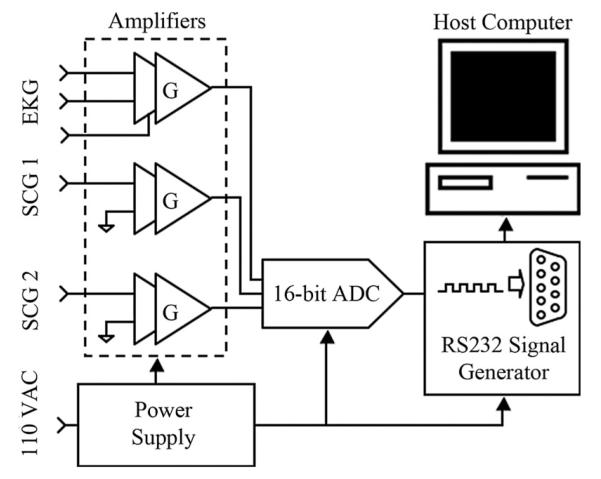
The new compact hardware device simultaneously acquires synchronous EKG and SCG data at high precision and rate (16-bit, 1.2 kHz). The device consists of three amplifier channels, a four-channel analog-to-digital converter (ADC), an output driver interface, and a power supply unit (see Fig. 3). The custom-built device serves to condition, amplify, and digitize signals from the EKG leads and accelerometers. The accelerometers (ADXL327, Analog Devices, Inc., Norwood, MA) each weigh approximately 5 g and have a dynamic range and sensitivity of ±2.5 g and 420 mV/g, respectively, where g is the earth’s gravitational acceleration. The accelerometers have an RMS noise of and are tuned to have a passband of 50 Hz. Signals from the EKG and SCG channels are each fed through similar independent two-stage amplifier channels with adjustable gain to reach a peak-to-peak amplitude of approximately 1.0 V [19]. Each amplification signal path shown in Fig. 3 consists of a first-stage instrumentation amplifier with gain G1, followed by an inverting amplifier with gain G2. The instrumentation amplifier gain G1 is fixed at 5 for all channels, whereas the inverting amplifier gain G2 is tunable from 0 to 20 for the accelerometer channels and 0 to 200 for the EKG channel. To eliminate unpredictable offset voltages caused by static charge on the human body in the EKG channel or the gravitational force in the SCG channels, dc offset removal circuitry was incorporated into each amplification stage. This dc offset removal is critical for the SCG channels as the amplitude of the SCG acceleration is very small in comparison to the earth’s gravitational acceleration. By removing the large constant offset due to gravity from the accelerometer channels, effectively centering the signal at zero magnitude, the gain can be greatly increased so that the SCG signal uses the full dynamic range of the ADC. Without the tunable gain and dc offset compensation, the accuracy of the SCG data would be decreased significantly due to ADC quantization error associated with digital signals that have small magnitude relative to the dynamic range of the system. DC offset compensation also has the added benefit of removing most of the respiratory motion from the SCG. Specific to the EKG channel, a common-mode feedback (CMFB) stage, which has a gain of 20, is essential because the unknown human body potential easily exceeds the input common-mode range. Additionally, the CMFB stage provides resistance against electrical noise from both the power supply and charge distribution of the hum
Fig. 3.
Schematic of the custom device to synchronously acquire an EKG and two SCG data streams. The total gain of each signal path is the product of G1 and G2 (G).
A four-channel, 16-bit ADC (ADS7825, Texas Instruments, Dallas) digitizes the three analog data channels. The system clock, running at 1.8432 MHz, is divided to produce an ADC output baud rate of 115.2 kHz, resulting in an overall data rate of 1200 samples per ADC channel per second. Even though the accelerometer bandwidth of 50 Hz is much less than the sampling bandwidth of 600 Hz, the high sampling rate provides increased temporal resolution. Selected for its ease of implementation and compatibility with hardware and software design, the RS232 protocol was implemented for the interface with a personal computer. An RS232 code generator and driver encode the bit stream from the ADC into RS232 format.
The system is powered by a traditional linear power supply, consisting of a transformer, a rectifier, filtering capacitors, and linear regulator ICs. This design was chosen to avoid switching noise and most electromagnetic interference, both of which are problematic to the small signals associated with EKG and SCG. At the low current levels associated with the device, a commercial 5-VDC fixed output regulator (LM7805) is suitable to supply both the ADC and the CMOS digital circuit. The amplifiers require an unconventional ±1.65 VDC dual supply achieved using a tunable regulator (LM317) and its reciprocal part (LM337) to handle the positive and negative supplies, respectively.
B. Human Subject Data Acquisition
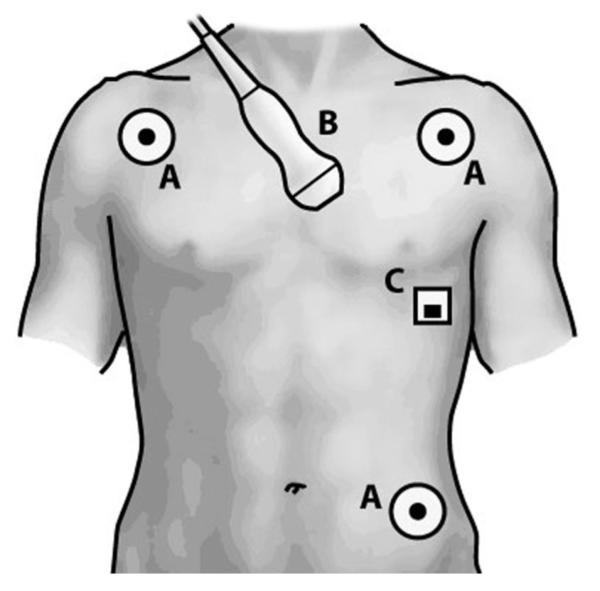
All human subjects evaluations reported in this paper were approved by Emory University’s Institutional Review Board, and full, written, informed consent was obtained from the subjects. A 23-year-old female and 26-year-old male volunteer (referred to henceforth as Subject 1 and Subject 2, respectively) with no known cardiac conditions were examined. Echocardiography, EKG, and SCG data were simultaneously recorded using both the custom device and the US machine [18]. An overview of sensor placement is provided in Fig. 4. The data were synchronized using the common EKG signal from both the custom device and the US machine with the primary intent of demonstrating the feasibility of acquiring synchronous echocardiography, EKG, and SCG data. By aligning the EKG signals, synchronized time indices for all data were generated.
Fig. 4.
Sensor placement: (A) EKG leads, (B) echocardiography transducer, and (C) SCG accelerometer.
The echocardiography data (B-mode and M-mode) were recorded using the parasternal short-axis view at the mitral valve level showing the left ventricle. EKG data were acquired using both the custom device and the US scanner. For SCG data acquisition, the accelerometer connected to the custom device was taped superficial to the subject’s chest wall at the point of maximal impulse.
C. Signal Processing for Analyzing the SCG
Synchronous SCG and EKG data were acquired for Subject 1 and Subject 2 in order to observe the variability of the relationship between the two modalities as a function of heart rate for different individuals. For these experiments, the EKG and one accelerometer channel of the device were used.
1) Variation Between EKG and SCG Features
Subject 1 and Subject 2 were examined at low (mean ~51 beats/min) and high (mean ~79 beats/min) heart rates at different times, resulting in four datasets. Elevated heart rates were achieved using exercise. The accelerometer was taped to the chest wall over the point of maximal impulse, as this provided the strongest SCG signal.
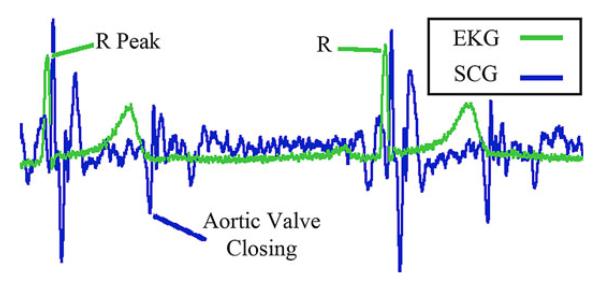
For each cardiac cycle, the R–R interval length and the time delay from the leading R-peak of the EKG to a specific feature in the SCG waveform was calculated using a semiautomated routine (see Fig. 5). For this preliminary evaluation, we selected the SCG feature that can be attributed to the Aortic Valve Closing (ac peak) [15]-[17] because it can be consistently identified across all four datasets and is an indication of the end of systole.
Fig. 5.
Synchronized EKG and SCG feature definitions. R-peaks of the EKG and Aortic Valve Closing feature of the SCG shown.
The R-peaks of the EKG signal were found by first high-pass filtering the EKG signal with a cutoff frequency of approximately 50 Hz. This was done to ensure that the sharper R-peak was found rather than the sometimes higher peak of the broader T wave. The quasi-periodic peaks of the resulting signal were identified using a sliding window technique where each point was compared against the maximum value of a window centered at that point. If a point corresponded to the maximum value of the window, it was labeled as an R-peak. The sliding window length was chosen to be 1.33 times the estimated average cardiac cycle length to ensure that it covered at least one cardiac cycle accounting for heart rate variability (HRV).
The AC negative peaks of the SCG signal were identified by first high-pass filtering the SCG signal with a cutoff of approximately 50 Hz. Just as with the EKG R-peak detection, this was done because the AC negative peak has more high-frequency content than the surrounding SCG features. A range of the resulting signal was then specified relative to the preceding R-peak of the EKG signal. The index corresponding to the minimum of this range was used as the position of the AC feature for the corresponding SCG cycle.
The R-peak to AC time delay was calculated for each cardiac cycle where a pair of successive R-peaks and the AC feature of the SCG were identified. In addition to the time delay representation, the R-AC delay for each cycle was calculated as a percentage of the cardiac cycle. This was found by dividing each R-AC delay by its corresponding cardiac cycle length. Finally, the beat-to-beat variability of the R-AC delay was calculated as the difference of the R-AC delay (in ms) for pairs of consecutive cardiac cycles. This variability was recorded as a function of the instantaneous heart rate of the first cycle of each pair. This choice was made to simulate prediction error of the AC position using knowledge of the AC position and cardiac cycle length of the preceding cycle.
2) Variation of SCG Signal Relative to Cardiac Cycle
In order to gain a better understanding of the overall nature of the SCG, composite SCG signals were measured across a range of heart rates. The SCG was segmented by the R–R intervals of the EKG signal. After segmentation, the instantaneous heart rate for each cycle was derived from the known cycle length in seconds. The SCG cycles were then sorted into groups by their instantaneous heart rates. After sorting, the SCG cycles were time-scaled to equal length, allowing the groups to be averaged and compared with respect to cycle percentage. This process is summarized by
| (1) |
where is the average signal for heart rate range Ai, e.g., 47.5–52.5 beats/min. Each of the SCG cycles is time-scaled to equal length. Here, xn is the nth time-scaled SCG cycle in heart rate range Ai. All xn in the set Ai are then averaged to obtain .
III. Results
In this section, we begin with a demonstration of the trimodal acquisition system. The results of the SCG investigation are then provided. Variation of the position of a feature in the SCG with respect to the EKG R-peak is analyzed. In addition, the SCG signal behavior relative to the cardiac cycle is observed for a range of heart rates for Subject 1 and Subject 2.
A. Synchronized Data Output of the System
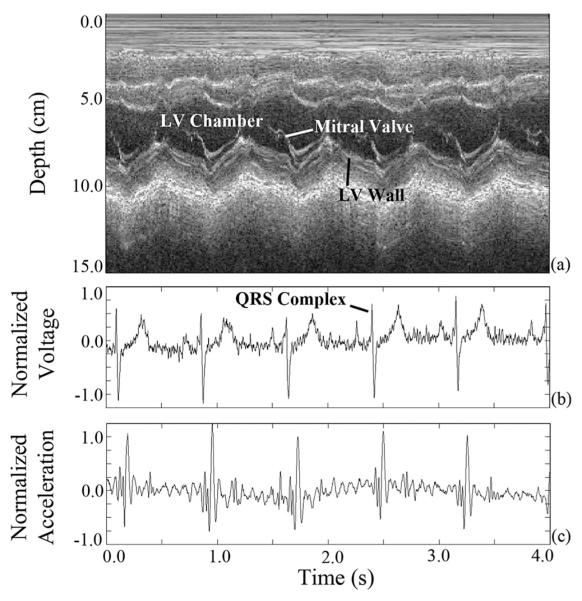
The subject data were synchronized using the EKG signal common to both the custom device and the US scanner (see Fig. 6). As expected, the QRS complex of the EKG signal [see Fig. 6(b)], associated with peak electrical activity in the cardiac cycle, precedes the major mechanical activity of the SCG signal [see Fig. 6(c)]. The trimodal representation of cardiac activity is crucial because US [see Fig. 6(a)] will be used in future work to verify the phase and temporal position of the quasi-stationary periods of the cardiac cycle and confirm their relation to the SCG. This differs from the analysis presented in [15] in that cardiac quiescence with respect to the SCG will be studied. For our work, the majority of the respiratory motion in the SCG has been removed at acquisition by the dc offset compensation circuitry. If respiratory motion proves problematic in the future, it can be easily removed with a high-pass digital filter or the patient could be examined during breath-hold.
Fig. 6.
(a) Synchronized M-mode US, (b) normalized EKG, and (c) normalized SCG data acquired using the synchronous acquisition hardware system.
B. SCG Signal Analysis
1) Analysis of SCG-EKG Variation
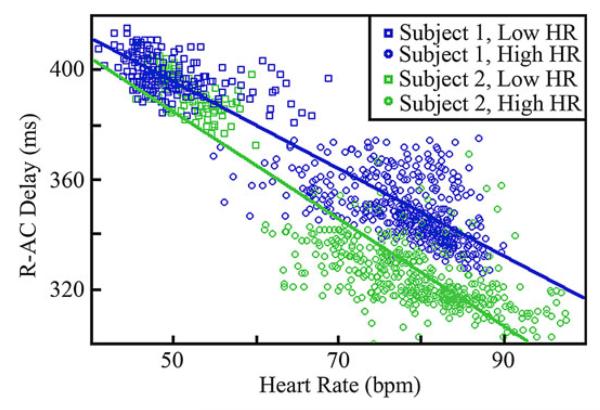
The statistics of the delay from the R-peak to the AC-peak, referred to as R-AC delay, show variations between the two individuals at a specified heart rate and also within an individual at different heart rates. The subject statistics are summarized in Table II for high and low heart rates. The results shown in the table were obtained by grouping the R-AC delays corresponding to the n cycles with an instantaneous heart rate within ± 2.5 beats/min of the indicated rate. This range was chosen in order to form signal sets with a large number of cycles while retaining specificity with respect to the center heart rate. Table II shows that the characteristics of the R-AC delay for both subjects are very similar at lower heart rates, while varying at higher heart rates. In addition, the mean percent offset at which the AC-peak occurs within the R–R interval, referred to as R-AC percentage, is not constant between the two patients for a given heart rate, suggesting that a specific cardiac phase does not occur at a consistent percentage offset within the EKG R-R interval. This is depicted further in Fig. 7, which shows a scatter plot of the heart rate against R-AC delay.
TABLE II.
Summary of R-AC Delay Characteristics
| Subject 1 | Subject 2 | |||||||
|---|---|---|---|---|---|---|---|---|
|
| ||||||||
| Heart Rate (bpm) |
Mean R-AC Delay (ms) |
Mean R-AC % |
σp (ms) |
n | Mean R-AC Delay (ms) |
Mean R-AC % |
σp (ms) |
n |
| 45 | 401 ± 6.7 | 30.7 % | 8.8 | 88 | 396 ±7.3 | 30.5 % | 3.3 | 5 |
| 50 | 397 ±5.9 | 32.8 % | 8.7 | 78 | 395 ± 6.6 | 32.7 % | 3.1 | 49 |
| 55 | 394 ±5.1 | 35.6 % | 8.0 | 24 | 386 ±4.5 | 35.0 % | 4.2 | 37 |
| 70 | 356 ±8.7 | 41.5 % | 9.8 | 38 | 334 ±7.8 | 39.1 % | 5.4 | 61 |
| 75 | 353 ± 9.4 | 44.3 % | 12.0 | 94 | 328 ±9.7 | 41.1 % | 9.0 | 87 |
| 80 | 348 ±9.5 | 46.5 % | 13.7 | 180 | 323 ± 9.0 | 42.8 % | 10.4 | 106 |
| 85 | 341 ± 10.4 | 48.0 % | 14.1 | 122 | 319 ± 8.6 | 45.0 % | 9.6 | 99 |
σp: standard deviation of beat-to-beat difference in AC position in ms.
Fig. 7.
Scatter plot of R-AC time delay against heart rate for Subject 1 and Subject 2. Best linear fit trend lines are also shown.
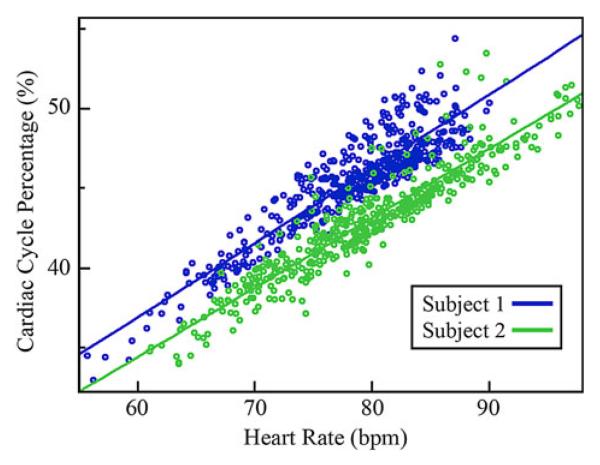
In Fig. 8, the R-AC offset percentage is plotted against heart rate for the elevated heart rate dataset. A linear relationship between the R-AC offset percentage and heart rate is observed. In addition, the R-AC offset percentage of the two subjects differs by approximately 4% throughout this heart rate range.
Fig. 8.
Scatter plot showing cardiac cycle position of the AC feature as a percentage of the R–R interval, relative to heart rate. Best linear fit trend lines are also shown.
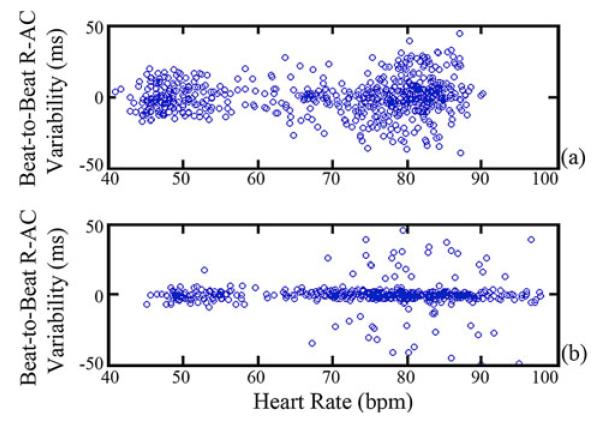
Finally, in Fig. 9, the beat-to-beat variability of the R-AC delay for both subjects is shown. The standard deviation of this variability in ms, defined as σp, is shown in Table II for each subject across multiple heart rates. The difference between the two subjects is a result of Subject 1 having higher HRV. When compared with Fig. 8, the results indicate that predictive performance for Subject 2 with low HRV is better when the location of the AC-peak and cycle length is known for the previous cardiac cycle. For Subject 1 with higher HRV, predictive performance is comparable to predicting based solely on knowing the average R-AC delay for a given heart rate.
Fig. 9.
Variability in beat-to-beat R-AC delay for (a) Subject 1 and (b) Subject 2. Each data point corresponds to the difference in the R-AC delay for two consecutive cycles plotted against the heart rate defined by the first cycle.
2) SCG Signal Morphology as a Function of Heart Rate
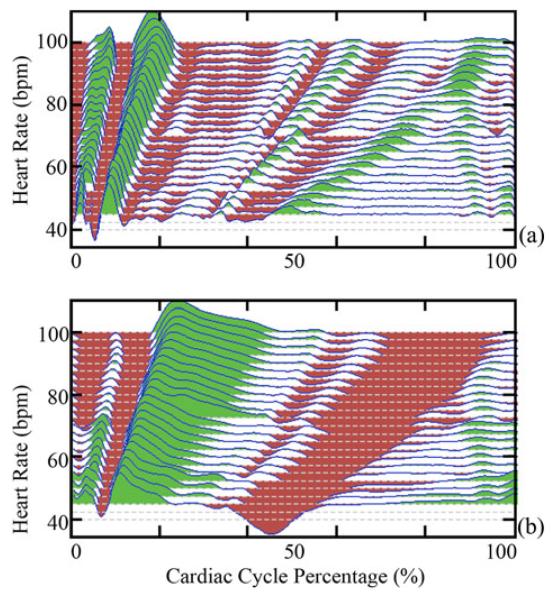
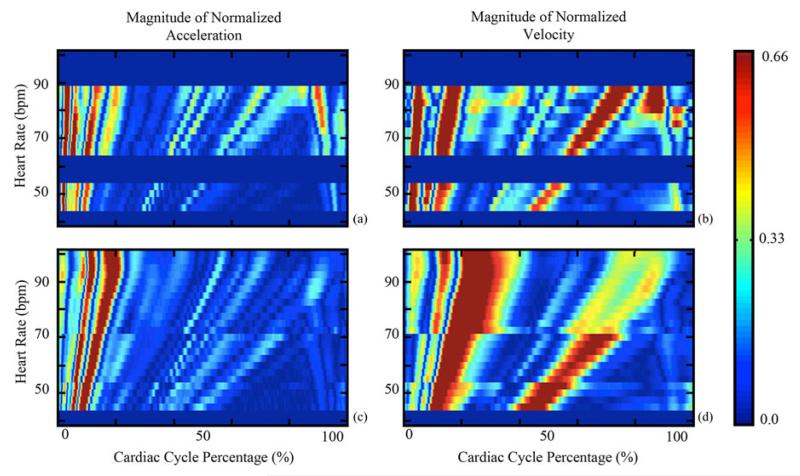
In order to obtain a better understanding of how the SCG-derived quiescence varies with heart rate, average SCG signals, from (1), were generated for nonoverlapping heart rate range sets. All were then normalized to have a range of ±1.0. The average SCG signals of Subject 2 are shown in Fig. 10(a). Each average signal represents all SCG signals with an instantaneous heart rate within ±1.25 beats/min of the rate indicated. Fig. 10(a) shows that the position of SCG features varies with heart rate. Fig. 10(b) depicts the relative velocity transmitted to the chest wall, calculated by integrating the acceleration signals from Fig. 10(a). The velocity signals were normalized to ±1.0 and their dc component was removed, as the heart has zero average velocity over a cardiac cycle. The regions in Fig. 10(b) with near-zero velocity, corresponding to cardiac quiescence, vary in both duration and position relative to heart rate. Nonshaded regions are a result of the white background of the plot being visible due to low signal magnitude. The absolute value of the normalized SCG acceleration is plotted as a function of heart rate and cycle percentage for both subjects [see Fig. 11(a) and (c)]. Each row in Fig. 11(a) and (c) corresponds to the absolute value of one average from (1). Analogously, the absolute value of the normalized velocity signals derived from the average SCG signals is depicted in Fig. 11(b) and (d). The slight discontinuities present in the data for Subject 2 can be attributed to the fact that data were collected at different times and under different physical conditions in order to obtain data from all heart rates. The discontinuities demonstrate that the behavior of the SCG relative to the EKG can vary between acquisitions even if the subject and heart rate are constant. Points of large acceleration, which are shown in red, based on the color scale on the right, correspond to specific known SCG features, and consequently specific cardiac states [15]-[17]. The position of SCG features, and hence cardiac states, varies with heart rate suggesting that periods of cardiac quiescence would vary similarly. From Fig. 11(b) and (c), there are two phases of minimal velocity corresponding to cardiac quiescence occurring at end-systole and mid-diastole; the dark-blue-colored regions correspond to areas of low velocity. The duration of the period of minimal velocity during mid-diastole decreases as heart rate increases, whereas the duration of the period of minimal velocity during end-systole increases minimally as heart rate increases.
Fig. 10.
Normalized composite signals of the (a) SCG and (b) computed velocity relative to cycle percentage for a range of heart rates from Subject 2. The vertical axis is heart rate, but the vertical displacement of the plots corresponds to magnitude of the signal or velocity. Green and red indicate positive and negative values, respectively. White regions are a result of the white background being visible when the signal magnitude is low.
Fig. 11.
Variation of the SCG acceleration and velocity in terms of cycle percentage for (a), (b) Subject 1 and (c), (d) Subject 2. Solid blue horizontal stripes represent heart rates where insufficient data were obtained. As defined by the color scale on the right, red represents phases within the cardiac cycle where there is significant acceleration (velocity) and blue represents areas where acceleration (velocity) is minimal.
IV. Discussion
Our goal in this study was to demonstrate whether SCG has the potential to serve as a gating signal within the context of cardiac CT imaging. To enable this investigation, a hardware system capable of obtaining synchronous echocardiography, EKG, and SCG data was designed and implemented. The system was used to acquire data to study the variation between cardiac states and the EKG signal.
The implication of the results from Table II is that EKG demonstrates variability with respect to the SCG, and since the latter has been shown to be an accurate indicator of cardiac state based on US [15], EKG may be a less optimal trigger for gating CTCA. The result shown in Fig. 8 implies that if SCG analysis is performed prior to prospectively gated CTCA based on EKG gating, tighter padding intervals could be used, which would further decrease the amount CT tube current ON time, thus decreasing radiation dose. Of course, this will require that the gating period marked by these padding intervals is sufficiently large to include a complete CT slice acquisition duration; otherwise, segmented acquisition approaches must be followed (i.e., slice acquisition may have to be performed over several rotations). Finally, the results of Figs. 10 and 11 show that the average cycle percentage of SCG features and periods of minimal velocity, and hence periods of cardiac quiescence, varies predictably with heart rate for a given individual.
In summary, we have shown that the timing, both in terms of cardiac cycle position and time delay of SCG features, varies across heart rates, strongly suggesting that the timings of cardiac events also vary in a similar manner [15]-[17]. More importantly, even when the heart rate is similar for two individuals, the timing within the cardiac cycle when these events occur demonstrates slight variations. Such variations imply that using the same absolute percentage interval with respect to the EKG as a gating interval within a cardiac cycle for different patients may lead to suboptimal cardiac CT examinations even if these patients have similar heart rates.
A limitation of this study is that only two normal subjects were studied. We are currently acquiring data from more subjects to better understand the variation of cardiac mechanics between individuals. An additional limitation of this study is that only one linear accelerometer was placed on the chest wall, and thus, only cardiac motion in the antero-posterior direction was considered. Finally, for patients with pathological cardiac conditions resulting in decreased cardiac acceleration, such as cardiomyopathies or pericardial effusions, the SCG signal may be too weak for use as a gating signal.
Several important questions must be answered in the future before SCG can be used for improving cardiac CT gating. A complete understanding of the interactions between the accelerometer device and a CT machine is essential. Initial investigations show that acceleration from the table motion during a step-and-shoot cardiac sequence is much smaller than that of actual cardiac motion observed at the chest wall (SCG). We have performed preliminary work in this regard by placing one accelerometer over the patient’s chest wall and a second accelerometer directly on the CT table and comparing the two signals. We found that the noise from the table motion and the gantry rotation is largely dampened out by the subject’s body. Additionally, streaking in the CT image from the accelerometer did not lower the diagnostic quality of the images. If streak artifacts prove problematic, a number of existing streak-removal techniques may be adequate to combat these [20]-[23].
Further investigation is needed to identify the relation between SCG events and quasi-stationary phases of the cardiac cycle, and the ultimate effect on the diagnostic quality of CT images when SCG gating is employed. One issue to evaluate is whether the heart is in the same position for all low-velocity regions. Further study is also needed to determine if the use of SCG can reduce the gating period, i.e., padding interval, for prospectively gated coronary CT angiography, thus decreasing radiation dose, while maintaining diagnostic quality images of the coronary vessels. In addition, SCG gating methods must be explored. Predictive gating methods could be based on either a patient prescan with the SCG device or detecting SCG features of quiescence in real time during a cardiac CT exam. Furthermore, stand-alone SCG gating methods may be desirable, especially for those with heart rate irregularities, and should be investigated. Variability between an SCG feature that can trigger acquisition and quiescent phases should be studied as a function of heart rate and between individuals. If this variability is shown to be small, gating directly from the SCG could eliminate the need for predictive EKG gating. Finally, we are also implementing a multichannel SCG device with linear accelerometers to be placed at multiple points along the chest wall; akin to a 12-lead EKG device, this will permit evaluation of 3-D motion of the heart, essentially providing a vector-seismocardiogram. This representation may better capture cardiac mechanics and hence allow for improved gating.
Acknowledgment
The authors would like to thank the reviewers for their extensive comments that improved this manuscript. Fig. 1 was provided by Dr. S. Tigges and Dr. G. Sirineni. The content is solely the responsibility of the authors and does not necessarily represent the official views of the NBIB or the NIH.
This work was supported in part by the National Institute of Biomedical Imaging and Bioengineering under Award K23EB013221 and in part by PHS Grant KL2 RR025009 from the Clinical and Translational Science Award program, National Institutes of Health, National Center for Research Resources.
Biographies
Carson A. Wick (S’10) received the B.S. and M.S. degrees in electrical engineering from the Georgia Institute of Technology, Atlanta, in 2006 and 2007, respectively, where he is currently working toward the Ph.D. degree in electrical engineering. In 2008 and 2009, he completed Ph.D. Student Internships with the Digitally Enhanced Analog Systems Group of the Texas Instruments DSP Research and Development Center in Dallas.
His current research is focused on digital signal processing of cardiac signals, with applications for motion analysis and tracking. He currently balances his research efforts between the Center for Signal and Image Processing, the Georgia Institute of Technology, and the Department of Radiology and Imaging Sciences, Emory University School of Medicine, Atlanta.
Mr. Wick is a member of Eta Kappa Nu.
Jin-Jyh Su (S’12) was born in Tainan, Taiwan, in 1982. He received the B.S. degree in electro-physics from National Chiao-Tung University, Hsinchu, Taiwan, in 2005. He began his graduate study in 2007 at the Georgia Institute of Technology, Atlanta, where he received the M.S. degree in electrical engineering in 2009, and is currently working toward the Ph.D. degree in Integrated Sensor System Group.
From 2007 to 2009, he was with Georgia Tech Analog and Power IC Design Lab at the Georgia Institute of Technology in designing power converter IC for energy harvesting applications. In 2010, he joined a cooperative project at Emory University in which he designed a signal acquisition system for generating triggering signals in cardiac imaging applications. His research interests include sensor system design in mixed-signal CMOS IC, low-power electronic circuits, and development of CMOS-compatible chemical sensors.
James H. McClellan (S’69–M’74–SM’79–F’85) received the B.S. degree in electrical engineering from Louisiana State University, Baton Rouge, in 1969, and the M.S. and Ph.D. degrees from Rice University, Houston, TX, in 1972 and 1973, respectively.
From 1973 to 1982, he was a member of the Research Staff at Lincoln Laboratory and then a Professor at the Massachusetts Institute of Technology. From 1982 to 1987, he was with Schlumberger Well Services. Since 1987, he has been a Professor in the School of Electrical and Computer Engineering, Georgia Institute of Technology, Atlanta, where he is currently the John and Marilu McCarty Chair. He is a coauthor of Number Theory in Digital Signal Processing (Englewood Cliffs, NJ: Prentice-Hall, 1979), Computer-Based Exercises for Signal Processing Using MATLAB (Englewood Cliffs, NJ: Prentice-Hall, 1998), and Signal Processing First: A Multimedia Approach (Upper Saddle River, NJ: Prentice-Hall, 1998).
Prof. McClellan received the McGraw-Hill Jacob Millman Award for an Outstanding Innovative Textbook in 2003, the W. Howard Ector Outstanding Teacher Award at Georgia Tech in 1998, and the Education Award from the IEEE Signal Processing Society in 2001. In 1987, he received the Technical Achievement Award for work on finite impulse response filter design, and in 1996, the Society Award, both from the IEEE Signal Processing Society. In 2004, he was a co-recipient of the IEEE Jack S. Kilby Signal Processing medal. He is a member of Tau Beta Pi and Eta Kappa Nu.
Oliver Brand (M’97–SM’03) received the Diploma degree in physics from Technical University Karlsruhe, Karlsruhe, Germany, in 1990, and the Ph.D. degree from ETH Zurich, Zurich, Switzerland, in 1994.
From 1995 to 1997, he was a Postdoctoral Fellow at the Georgia Institute of Technology. From 1997 to 2002, he was a Lecturer at ETH Zurich, and Deputy Director of the Physical Electronics Laboratory. In 2003, he joined the Electrical and Computer Engineering Faculty at the Georgia Institute of Technology, Atlanta, where he is currently a Professor. He has coauthored more than 160 publications in scientific journals and conference proceedings. He is a Co-Editor of the Wiley-VCH book series Advanced Micro and Nanosystems, a member of the Editorial Board of Sensors and Materials, and has served as General Co-Chair of the 2008 IEEE International Conference on Microelectromechanical Systems. His research interests include the areas of integrated microsystems, microsensors, microelectromechanical systems fabrication technologies, and microsystem packaging.
Dr. Brand is a co-recipient the 2005 IEEE Donald G. Fink Prize Paper Award.
Pamela T. Bhatti (S’05–M’06) received the B.S. degree in engineering science (bioengineering) from the University of California, Berkeley, in 1989, the M.S. degree in electrical engineering from the University of Washington, Seattle, in 1993, and the Ph.D. degree in electrical engineering from the University of Michigan, Ann Arbor, in 2006 with an emphasis on microelectromechanical systems.
She is currently an Assistant Professor in the School of Electrical and Computer Engineering, Georgia Institute of Technology, Atlanta. Before completing the Ph.D. degree, she researched the detection of breast cancer with ultrasound imaging at the University of Michigan’s Department of Radiology (during 1997–1999). Her industry experience includes embedded systems software development at Microware Corporation, Des Moines, IA (during 1996–1997), local operating network applications development and customer support at Motorola Semiconductor in Austin, TX (during 1994–1995), and research and fabrication of controlled-release drug delivery systems at Alza Corporation in Palo Alto, CA (during 1986–1990). Committed to translating technology to the clinical setting, she is a KL2 Scholar with the Atlanta Clinical and Translations Sciences Institute.
Dr. Bhatti received the National Science Foundation CAREER Award in 2011.
Ashley L. Buice received the M.D. degree from Emory University School of Medicine, Atlanta, GA, in 2012. She will be beginning her residency in radiology at the University of Mississippi in 2013 after a one-year internship training period.
Arthur E. Stillman received the M.D. degree from the University of Chicago, and Ph.D. degree from the university of Illinois, Chicago.
He is the William & Kay Casarella Professor of Radiology and Director of Cardiothoracic Imaging at Emory University, Atlanta, GA. He has contributed to more than 128 scholarly papers mostly in areas of research involving cardiac MRI and computed tomography.
Dr. Stillman is an Ex-President of the North American Society for Cardiovascular Imaging and Ex-Chair of the Cardiovascular Radiology and Intervention Council of the American Heart Association. He chairs the Cardiac Scientific Program Committee for the Radiological Society of North America and chairs the American College of Radiology Body Imaging Committee on Cardiovascular Imaging. He is a Fellow of the American College of Radiology, the American Heart Association, and the North American Society for Cardiac Imaging.
Xiangyang Tang (M’96–SM’07) received the Ph.D. degree in electrical and computer engineering from the University of Rochester, Rochester, NY, in 2002.
From 2001 to 2008, he was a Scientist of the Applied Science Lab of GE Medical Systems (currently GE Healthcare), where he made vital contribution to the image reconstruction solutions of GE Healthcare’s two generation flagship volumetric computed tomography (CT) scanners. In 2009, he joined the Faculty of the Department of Radiology and Imaging Sciences, Emory University, Atlanta, GA, as an Associate Professor. He has contributed to more than 100 papers in prestigious scientific journals and conference proceedings, and 16 U.S. patents have been issued under his name. In addition, he has served on the Technical Program Committee of numerous conferences and the grant reviewing study section of a number of federal and organizational funding agencies. His research interests lie in computed tomography, including CT imaging methods, reconstruction algorithms, and system integration. He has been recently focusing on the research and development to establish the differential phase contrast CT as an imaging modality.
Srini Tridandapani (S’86–M’95) received the B.E. degree from Anna University, Chennai, India, and the M.S.E.E. and Ph.D. degrees from the University of Washington, Seattle, all in electrical engineering. He completed the Postdoctoral training in computer science at the University of California, Davis. He then took the bold plunge into medical school and received the M.D. degree from the University of Michigan, Ann Arbor, followed by residency training in radiology also at Michigan. He then obtained clinical fellowships in cardiothoracic imaging and abdominal imaging at Emory University, Atlanta, GA, where he has recently completed the MSCR degree in clinical and translational research.
He was an Assistant Professor of electrical and computer engineering at Iowa State University, Ames. As a Board-Certified Radiologist, he is currently a Faculty Member in the Department of Radiology and Imaging Sciences, Emory University, and an Adjunct Professor in the School of Electrical and Computer Engineering, Georgia Institute of Technology, Atlanta. His current research interests include the development of novel gating strategies for optimizing cardiac computed tomography and innovative tools to increase patient safety in medical imaging.
Contributor Information
Carson A. Wick, School of Electrical and Computer Engineering, Georgia Institute of Technology, Atlanta, GA 30332 USA.
Jin-Jyh Su, School of Electrical and Computer Engineering, Georgia Institute of Technology, Atlanta, GA 30332 USA.
James H. McClellan, School of Electrical and Computer Engineering, Georgia Institute of Technology, Atlanta, GA 30332 USA.
Oliver Brand, School of Electrical and Computer Engineering, Georgia Institute of Technology, Atlanta, GA 30332 USA.
Pamela T. Bhatti, School of Electrical and Computer Engineering, Georgia Institute of Technology, Atlanta, GA 30332 USA.
Ashley L. Buice, Department of Radiology and Imaging Sciences, Emory University School of Medicine, Atlanta, GA 30322 USA
Arthur E. Stillman, Department of Radiology and Imaging Sciences, Emory University School of Medicine, Atlanta, GA 30322 USA
Xiangyang Tang, Department of Radiology and Imaging Sciences, Emory University School of Medicine, Atlanta, GA 30322 USA.
Srini Tridandapani, Department of Radiology and Imaging Sciences, Emory University School of Medicine, Atlanta, GA 30322 USA, and also with the School of Electrical and Computer Engineering, Georgia Institute of Technology, Atlanta, GA 30332 USA.
References
- [1].Lloyd-Jones D, Adams RJ, Brown TM, Carnethon M, Dai S, De Simone G, Ferguson TB, Ford E, Furie K, Gillespie C, Go A, Greenlund K, Haase N, Hailpern S, Ho PM, Howard V, Kissela B, Kittner S, Lackland D, Lisabeth L, Marelli A, McDermott MM, Meigs J, Mozaffarian D, Mussolino M, Nichol G, Roger VL, Rosamond W, Sacco R, Sorlie P, Thom T, Wasserthiel-Smoller S, Wong ND, Wylie-Rosett J. Heart disease and stroke statistics—2010 update: A report from the American Heart Association. Circulation. 2010;121:46–215. doi: 10.1161/CIRCULATIONAHA.109.192667. [DOI] [PubMed] [Google Scholar]
- [2].Bruschke AV, Sheldon WC, Shirey EK, Proudfit WL. A half century of selective coronary arteriography. J. Amer. Coll. Cardiol. 2009;54:2139–2144. doi: 10.1016/j.jacc.2009.06.051. [DOI] [PubMed] [Google Scholar]
- [3].Patel MR, Peterson ED, Dai D, Brennan JM, Redberg RF, Anderson HV, Brindis RG, Douglas PS. Low diagnostic yield of elective coronary angiography. The New England J. Med. 2010;362:886–95. doi: 10.1056/NEJMoa0907272. [DOI] [PMC free article] [PubMed] [Google Scholar]
- [4].Budoff MJ, Achenbach S, Blumenthal RS, Carr JJ, Goldin JG, Greenland P, Guerci AD, Lima JA, Rader DJ, Rubin GD, Shaw LJ, Wiegers SE. Assessment of coronary artery disease by cardiac computed tomography: A scientific statement from the American Heart Association Committee on Cardiovascular Imaging and Intervention, Council on Cardiovascular Radiology and Intervention, and Committee on Cardiac Imaging, Council on Clinical Cardiology. Circulation. 2006;114:1761–1791. doi: 10.1161/CIRCULATIONAHA.106.178458. [DOI] [PubMed] [Google Scholar]
- [5].Desjardins B, Kazerooni EA. ECG-gated cardiac CT. Amer. J. Roentgenol. 2004;182:993–1010. doi: 10.2214/ajr.182.4.1820993. [DOI] [PubMed] [Google Scholar]
- [6].Achenbach S, Ulzheimer S, Baum U, Kachelriess M, Ropers D, Giesler T, Bautz W, Daniel WG, Kalender WA, Moshage W. Non-invasive coronary angiography by retrospectively ECG-gated multislice spiral CT. Circulation. 2000;102:2823–2828. doi: 10.1161/01.cir.102.23.2823. [DOI] [PubMed] [Google Scholar]
- [7].Woodhouse CE, Janowitz WR, Viamonte M., Jr. Coronary arteries: Retrospective cardiac gating technique to reduce cardiac motion artifact at spiral CT. Radiology. 1997;204:566–569. doi: 10.1148/radiology.204.2.9240554. [DOI] [PubMed] [Google Scholar]
- [8].Earls JP, Berman EL, Urban BA, Curry CA, Lane JL, Jennings RS, McCulloch CC, Hsieh J, Londt JH. Prospectively gated transverse coronary CT angiography versus retrospectively gated helical technique: improved image quality and reduced radiation dose. Radiology. 2008;246:742–753. doi: 10.1148/radiol.2463070989. [DOI] [PubMed] [Google Scholar]
- [9].Mao S, Budoff MJ, Bin L, Liu SC. Optimal ECG trigger point in electron-beam CT studies: Three methods for minimizing motion artifacts. Acad. Radiol. 2001;8:1107–1115. doi: 10.1016/S1076-6332(03)80722-5. [DOI] [PubMed] [Google Scholar]
- [10].Agatston AS, Janowitz WR, Hildner FJ, Zusmer NR, Viamonte M, Jr., Detrano R. Quantification of coronary artery calcium using ultrafast computed tomography. J. Amer. Coll. Cardiol. 1990;15:827–832. doi: 10.1016/0735-1097(90)90282-t. [DOI] [PubMed] [Google Scholar]
- [11].Schlosser T, Hunold P, Schmermund A, Kuhl H, Waltering KU, Debatin JF, Barkhausen J. Coronary artery calcium score: Influence of reconstruction interval at 16-detector row CT with retrospective electrocardiographic gating. Radiology. 2004;233:586–589. doi: 10.1148/radiol.2332031470. [DOI] [PubMed] [Google Scholar]
- [12].Tridandapani S, Fowlkes JB, Rubin JM. Echocardiography-based selection of quiescent heart phases: Implications for cardiac imaging. J. Ultrasound Med. 2005;24:1519–1526. doi: 10.7863/jum.2005.24.11.1519. [DOI] [PubMed] [Google Scholar]
- [13].Salerno DM, Zanetti J. Seismocardiography: A new technique for recording cardiac vibrations—concept, method, and initial observations. J. Cardiovascular Technol. 1990;9:111–118. [Google Scholar]
- [14].Zanetti JM, Salerno DM. Seismocardiography: A technique for recording precordial acceleration. Proc. 4 th Annu. IEEE Symp. Comput.-Based Med. Syst. 1991:4–9. [Google Scholar]
- [15].Crow RS, Hannan P, Jacobs D, Hedquist L, Salerno DM. Relationship between seismocardiogram and echocardiogram for events in the cardiac cycle. Amer. J. Noninvasive Cardiol. 1994;8:39–46. [Google Scholar]
- [16].Akhbardeh A, Tavakolian K, Gurev V, Lee T, New W, Kaminska B, Trayanova N. Comparative analysis of three different modalities for characterization of the seismocardiogram. Proc. Annu. Int. Conf. IEEE Eng. Med. Biol. Soc. 2009 Sep.:2899–2903. doi: 10.1109/IEMBS.2009.5334444. [DOI] [PMC free article] [PubMed] [Google Scholar]
- [17].Zanetti JM, Poliac MO, Crow RS. Seismocardiography: Waveform identification and noise analysis. Proc. Comput. Cardiol. 1991:49–52. [Google Scholar]
- [18].Wick CA, Su J, Brand O, McClellan JH, Bhatti PT, Tridandapani S. A trimodal system for the acquisition of synchronous echocardiography, electrocardiography, and seismocardiography data. Proc. Annu. Int. Conf. IEEE Eng. Med. Biol. Soc. 2011:6911–6914. doi: 10.1109/IEMBS.2011.6091740. [DOI] [PMC free article] [PubMed] [Google Scholar]
- [19].Kugelstadt T. Getting the Most Out of your Instrumentation Amplifier Design. Texas Instrum. Inc.; Dallas: 2005. [Google Scholar]
- [20].Wang G, Snyder DL, OSullivan JA, Vannier MW. Iterative deblurring for CT metal artifact reduction. IEEE Trans. Med. Imaging. 1996;15(5):657–664. doi: 10.1109/42.538943. [DOI] [PubMed] [Google Scholar]
- [21].Williamson JF, Whiting BR, Benac J, Murphy RJ, Blaine GJ, O’Sullivan JA, Politte DG, Snyder DL. Prospects for quantitative computed tomography imaging in the presence of foreign metal bodies using statistical image reconstruction. Med. Phys. 2002;29:2404–2418. doi: 10.1118/1.1509443. [DOI] [PubMed] [Google Scholar]
- [22].Zhao SY, Roberston DD, Wang G, Whiting B, Bae KT. X-ray CT metal artifact reduction using wavelets: Arm application for imaging total hip prostheses. IEEE Trans. Med. Imag. 2000 Dec.19(12):1238–1247. doi: 10.1109/42.897816. [DOI] [PubMed] [Google Scholar]
- [23].Watzke O, Kalender WA. A pragmatic approach to metal artifact reduction in CT: Merging of metal artifact reduced images. Eur. Radiol. 2004;14:849–856. doi: 10.1007/s00330-004-2263-y. [DOI] [PubMed] [Google Scholar]


