

Abstract
Background
Near-infrared spectroscopy has helped our understanding of the neurobiological mechanisms of psychiatric disorders and has advantages including noninvasiveness, lower cost, and ease of use compared with other imaging techniques, like functional magnetic resonance imaging. The verbal fluency task is the most common and well established task used to assess cognitive activation during near-infrared spectroscopy. Recent functional neuroimaging studies have shown that the orbitofrontal cortex and other brain regions, including the dorsolateral prefrontal cortex, may play important roles in the pathophysiology of obsessive-compulsive disorder (OCD). This study aimed to evaluate hemodynamic responses in the dorsolateral prefrontal cortex in patients with OCD using near-infrared spectroscopy during the verbal fluency task and to compare these with dorsolateral prefrontal cortex responses in healthy controls.
Methods
Twenty patients with OCD and 20 controls matched for age, gender, handedness, and estimated intelligence quotient participated in this study. The verbal fluency task was used to elicit near-infrared spectroscopic activation and consisted of a 30-second pre-task, followed by three repetitions of a 20-second verbal fluency task (total 60 seconds), followed by a 70-second post-task period. The near-infrared spectroscopy experiment was conducted on the same day as surveys of obsessive-compulsive symptoms, depression, and anxiety. Z-scores for changes in the concentration of oxygenated hemoglobin were compared between the OCD patients and controls in 14 channels set over the left and right dorsolateral prefrontal cortex and frontopolar areas.
Results
During the verbal fluency task, significant task-related activation was detected in both the OCD group and the controls. Changes in oxygenated hemoglobin concentration in the right dorsolateral prefrontal cortex were significantly smaller in the OCD group than in the controls, but were not statistically significant after correction for multiple comparisons.
Conclusion
Patients with OCD have reduced prefrontal, especially right dorsolateral prefrontal, cortical hemodynamic responses as measured by near-infrared spectroscopy during the verbal fluency task. These results support the hypothesis that the dorsolateral prefrontal cortex plays a role in the pathophysiology of OCD.
Keywords: functional neuroimaging, near-infrared spectroscopy, obsessive-compulsive disorder, prefrontal hemodynamic response, verbal fluency task, dorsolateral prefrontal cortex
Introduction
Obsessive-compulsive disorder (OCD) is one of the most common neuropsychiatric disorders, with a lifetime prevalence of 2%–3%.1–3 OCD is characterized by persistent intrusive thoughts (obsessions), repetitive actions (compulsions), and excessive anxiety. A major characteristic of obsessions and compulsions is that they are excessive and unreasonable, based on the definitions provided in the Diagnostic and Statistical Manual of Mental Disorders, 4th ed. (DSM-IV).4 OCD is considered to be among the 20 leading causes of disability in the USA and other countries.5 However, despite widespread recognition of its clinical characteristics, the neurophysiological mechanisms underlying OCD are not yet well understood.
Recent advances in neuroimaging techniques have now made it possible to assess neurophysiological data aimed at increasing our understanding of the pathophysiology of OCD. Although findings from functional, metabolic, and structural imaging studies have suggested dysfunction in the orbitofrontostriatal circuit, recent studies have implicated additional brain regions, including the dorsolateral prefrontal cortex.6 Abnormality in the dorsolateral prefrontal cortex, with respect to functional connectivity with the striatum, has also been associated with OCD.7
Near-infrared spectroscopy (NIRS) is a neuroimaging technique well suited to measuring brain function in patients with mental illnesses. The advantages of NIRS include no requirement for large devices, improved safety (not requiring radioactive material or strong magnetism), and lower cost (running costs almost zero) compared with other techniques used for functional imaging of brain activity (eg, positron emission tomography, single photon emission computed tomography, and functional magnetic resonance imaging). Further, NIRS has approximately 10-fold higher temporal resolution but lower spatial resolution, and can be measured repeatedly over a prolonged period in a normal posture and state, unlike functional magnetic resonance imaging. Therefore, NIRS has been used to examine brain function in many psychiatric disorders, including schizophrenia, bipolar disorder, depression, dementia, post-traumatic stress disorder, pervasive developmental disorders, and attention deficit hyperactivity disorder. Ota et al8 and Okada et al9 recently used NIRS to examine OCD as measured during the Stroop color-word task and reported a reduced prefrontal hemodynamic response.
The verbal fluency task is the most common and well established method of assessing cognitive activation during NIRS measurement.10 Use of the verbal fluency task allows comparisons between the results of the current study and other studies investigating psychiatric disorders. Therefore, the aim of this study was to evaluate hemodynamic responses in the prefrontal cortex in patients with OCD by using NIRS during the verbal fluency task and to compare these responses between patients with OCD and healthy controls.
Materials and methods
Subjects
Twenty patients with OCD and 20 healthy controls matched for age, gender, handedness, and estimated intelligence quotient participated in this study (Table 1). The patients were recruited from the Kyoto Prefectural University of Medicine Hospital, Kyoto, Japan. The medical committee on human studies at the Kyoto Prefectural University of Medicine approved all of the procedures. All participants provided written and informed consent after receiving a complete description of the study. All participants were native Japanese speakers and were right-handed. All patients were primarily diagnosed using the Structured Clinical Interview for DSM-IV (SCID) Axis I disorders11 by trained and experienced psychiatrists or clinical psychologists. All controls were screened using the SCID Nonpatient Edition (SCID-NP).12 At the time of entry into the study, seven of the 20 patients with OCD had not been taking any psychotropic medication and the other 13 were taking a variety of psychotropic medications, including antidepressants, anxiolytics, and/or antipsychotics, but not mood stabilizers.
Table 1.
Clinical characteristics of patients with obsessive-compulsive disorder and healthy controls
| Patients with OCD (n = 20)
|
Healthy controls (n = 20)
|
Statistics | P value | |
|---|---|---|---|---|
| Mean ± SD | Mean ± SD | |||
| Gender, M/F | 9/11 | 8/12 | χ2 = 0.10 | 0.75 |
| Age, years | 38.1 ± 10.9 | 37.1 ± 8.4 | t = −0.34 | 0.73 |
| Total Y-BOCS score | 19.6 ± 8.2 | NA | NA | NA |
| MOCI | 15.5 ± 5.8 | 4.3 ± 3.5 | t = −7.39 | <0.001 |
| HDRS score | 2.0 ± 2.4 | NA | NA | NA |
| HARS score | 2.6 ± 2.7 | NA | NA | NA |
| Duration of illness, months | 104.2 ± 91.0 | NA | NA | NA |
| IQ | 105.1 ± 10.3 | 103.8 ± 8.2 | t = −0.45 | 0.66 |
Abbreviations: F, female; M, male; Y-BOCS, Yale-Brown Obsessive-Compulsive Scale; MOCI, Maudsley Obsessive-Compulsive Inventory; HARS, Hamilton Anxiety Rating Scale; HDRS, Hamilton Depression Rating Scale; NA, not applicable; IQ, intelligence quotient; OCD, obsessive-compulsive disorder; SD, standard deviation.
The exclusion criteria for patients and controls included: significant disease of the neurologic, pulmonary, cardiac, renal, hepatic, or endocrine system, or a metabolic disorder; prior psychosurgery or traumatic brain injury with any known cognitive consequences, loss of consciousness, or a history of electroconvulsive therapy; current or past DSM-IV Axis I diagnosis of any psychiatric illness other than OCD; DSM-IV diagnosis of mental retardation or pervasive developmental disorder based on clinical interview and psychosocial history; and pregnancy. There was no history of any psychiatric illness in the controls, as determined by the SCID-NP. In addition, none of the first-degree relatives of healthy controls had any history of psychiatric treatment.
Classification of handedness was based on a modified 25-item version of the Edinburgh Inventory.13 On the same day as the NIRS experiment, all of patients were surveyed for symptoms of OCD using the Japanese version of the Yale-Brown Obsessive-Compulsive Scale (Y-BOCS) symptom checklist,14–16 the Maudsley Obsessive-Compulsive Inventory (MOCI),17 the 17-item Hamilton Depression Rating Scale,18 and the Hamilton Anxiety Rating Scale.19
Verbal fluency task for NIRS activation
The verbal fluency task was administered according to the procedure outlined in a previous report.10 The procedure consists of a 30-second pre-task baseline, a 60-second verbal fluency task (letter version), and a 70-second post-task baseline. During the pre-task and post-task baseline periods, the subjects were instructed to repeat the vowels (“a”, “i”, “u”, “e”, and “o”) as the Japanese counterparts of A, B, and C in English.20 During the verbal fluency task period, subjects were instructed verbally to generate vocally as many words beginning with the Japanese syllable mentioned later as possible. The syllables (first “to”, “a”, or “na”; second “i”, “ki”, or “se”; third “ta”, “o”, or “ha”) were used in this order, which could be counterbalanced across subjects and changed every 20 seconds during the task period, without repetition or resorting to proper words.
NIRS measurements
Changes in oxygenated, deoxygenated, and total hemoglobin were measured using a multichannel NIRS machine (FOIRE-3000 functional NIRS system, Shimadzu, Kyoto, Japan) at three wavelengths of near-infrared light (780, 805, and 830 nm). This apparatus measured the relative concentrations of oxygenated and deoxygenated hemoglobin at 42 measurement points in a 9 × 15 cm area (Figure 1). The distance between probes was 3 cm and channels were defined for each domain measured between the source and detector probes.10 To avoid cross-talk noise, the probe emits light continuously. Absorption of near-infrared light was measured with a sampling time of 0.22 seconds. Each participant sat in a comfortable chair with their eyes open throughout the measurements. The subjects were instructed to minimize movement, such as head movements, strong biting, and eye blinking, during the NIRS measurements, because these movements can produce artifacts or changes in cerebral perfusion unrelated to the task. The NIRS shell was placed on the frontal region of the head with the lowest probes positioned along the Fp1–2 line according to the international 10–20 system used in electroencephalography.21
Figure 1.

Grand-average waveforms of changes in oxygenated hemoglobin concentration in controls (red line) and the group with obsessive-compulsive disorder (blue line). The areas enclosed with red frames show the regions of interest. The x-axis shows time course (s) and the y-axis shows the change in oxygenated hemoglobin concentration (mM • cm). Grand-average waveforms of changes in oxygenated hemoglobin concentration in healthy controls increased during the task period, but did not increase markedly in the obsessive-compulsive disorder group.
Abbreviation: CH, channel.
Statistical analyses
First, changes in the oxygenated hemoglobin concentration in each of the 14 channels were analyzed. Channel groupings corresponded to approximate positions on the left (channels 16, 17, 25, 33, and 34) and right (channels 9, 10, 18, 26, and 27) dorsolateral prefrontal cortex and the prefrontal area near the frontopolar area (channels 13, 21, 22, and 30), based on an anatomic craniocerebral correlation study (Figure 2A).21 Changes in oxygenated hemoglobin have been postulated as the best indicator of blood oxygenation.22,23 Therefore, this study focused on the change in oxygenated hemoglobin concentration. NIRS data that clearly contained a motion artifact, which is determined by the minute observation about the theme was excluded from the statistical analyses. In addition, a low-pass filter equipped with a 0.1 Hz high cutoff was used to exclude any short-term motion artifacts from the data used for analysis. The mean oxygenated hemoglobin concentration during the 60-second verbal fluency task was calculated and the pre-task baseline was calculated using the mean of the last 10 seconds of the 30-second pre-task period.10 The change in oxygenated hemoglobin concentration during the verbal fluency task was calculated by subtracting the oxygenated hemoglobin concentration during the task period from the pre-task baseline oxygenated hemoglobin concentration. A z-score was calculated as follows: d = (m1 – m2)/s, where m1 and m2 represent the mean concentration values during the baseline and trial, respectively, and s represents the standard deviation of the baseline. In order to increase the signal-to-noise ratio, z-scores were calculated from 14 channels within each measurement domain. We then compared each of the two groups using Student’s t-test, and the significance level in the analysis was set to P = 0.05. Since we performed 14 paired t-tests, the correction for multiple comparisons was made using the false discovery rate (two-tailed; we set the value of q specifying the maximum false discovery rate to 0.05, so that there are no more than 5% false positives on average). All statistical analyses were performed using Statistical Package for the Social Sciences version 17.0 J for Windows software (IBM, Armonk, NY, USA).
Figure 2.

Localization matrices mapped over a standard brain template. Areas shown in yellow represent matrix of guidance channels. (A) Matrix of guidance in which areas shown in orange represent regions of interest. (B) Patients with obsessive-compulsive disorder had significantly smaller changes in oxygenated hemoglobin concentration than controls at channel 18 (orange), localized near the right lateral prefrontal region.
Results
Demographic data
Demographic and clinical data are shown in Tables 1 and 2. Age, gender, and estimated intelligence quotient did not differ significantly between patients with OCD and controls (age, t = −0.34, df = 38, P = 0.73; gender, χ2 = 0.1, df = 1, P = 0.75; intelligence quotient, t = −0.45, df = 38, P = 0.66).
Table 2.
Clinical characteristics of patients with obsessive-compulsive disorder
| Case | Gender | Age, years | Total Y-BOCS score | MOCI | HDRS score | HARS score | DUI | IQ | VF | Equivalent dose, mg/day (imipramine, diazepam, chlorpromazine) | Consultation |
|---|---|---|---|---|---|---|---|---|---|---|---|
| 1 | F | 40 | 31 | 21 | 3 | 1 | 144 | 120.3 | 15 | 0 | I |
| 2 | M | 52 | 18 | 18 | 1 | 1 | 96 | 97.1 | 11 | Sertraline 100 (150) | I |
| 3 | F | 52 | 18 | 10 | 1 | 1 | 144 | 129 | 16 | Fluvoxamine 100 (100) | D |
| 4 | M | 41 | 28 | 24 | 2 | 3 | 96 | 100 | 14 | 0 | D |
| 5 | F | 46 | 32 | 19 | 9 | 11 | 156 | 94.2 | 12 | 0 | I |
| 6 | M | 51 | 9 | 6 | 1 | 1 | 68 | 117.4 | 13 | Paroxetine 40 (150), Amoxapine 50 (50), Etizolam 0.5 (1.67), Zopiclone 10 (6.7) |
I |
| 7 | M | 23 | 9 | 14 | 3 | 4 | 18 | 97.1 | 8 | 0 | D |
| 8 | F | 38 | 18 | 15 | 3 | 5 | 144 | 105.8 | 9 | 0 | D |
| 9 | F | 57 | 33 | 24 | 6 | 4 | 324 | 111.6 | 8 | Clomipramine 150 (187.5) Etizolam 2 (6.7) Risperidone 1 (100) |
I |
| 10 | F | 27 | 24 | 20 | 1 | 0 | 72 | 102.9 | 9 | Fluvoxamine 100 (100) | D |
| 11 | F | 44 | 31 | 18 | 3 | 3 | 132 | 88.4 | 11 | Paroxetine 50 (187.5) Olanzapine 2.5 (100) Etizolam 1.5 (5) Clonazepam 1.5 (30) |
I |
| 12 | F | 47 | 12 | 12 | 1 | 3 | 36 | 108.7 | 14 | 0 | D |
| 13 | F | 42 | 17 | 13 | 0 | 0 | 312 | 111.6 | 18 | Paroxetine 30 (112.5) | D |
| 14 | F | 27 | 20 | 20 | 0 | 0 | 106 | 114.5 | 12 | Paroxetine 20 (75) Brotizolam 0.25 (5) |
I |
| 15 | M | 19 | 15 | 18 | 0 | 0 | 48 | 91.3 | 11 | Clomipramine 150 (187.5) Alprazolam 0.8 (5) Imipramine 10 (10) |
I |
| 16 | M | 34 | 18 | 18 | 5 | 6 | 12 | 108 | 10 | Paroxetine 30 (112.5) | D |
| 17 | M | 29 | 14 | 10 | 0 | 1 | 3 | 97.1 | 12 | Paroxetine 30 (112.5) | I |
| 18 | M | 33 | 4 | 2 | 0 | 0 | 156 | 108.7 | 11 | Clomipramine 75 (93.75) Olanzapine 2.5 (100) Clonazepam 0.5 (10) |
I |
| 19 | M | 34 | 22 | 17 | 1 | 4 | 4 | 102.9 | 19 | Paroxetine 50 (187.5) Etizolam 0.5 (1.67) |
I |
| 20 | F | 26 | 18 | 10 | 0 | 3 | 12 | 100 | 8 | 0 | I |
Abbreviations: F, female; M, male; Y-BOCS, Yale-Brown Obsessive-Compulsive Scale; MOCI, Maudsley Obsessive-Compulsive Inventory; HARS, Hamilton Anxiety Rating Scale; HDRS, Hamilton Depression Rating Scale; DUI, duration of illness; IQ, intelligence quotient; VF, verbal fluency scores; D, directly consulted; I, introduced.
For the patients with OCD, the mean Y-BOCS score was 19.6 ± 8.2 and the mean MOCI score was 15.5 ± 5.8, while the mean MOCI score for control subjects was 4.3 ± 3.5. There were significant differences in the mean MOCI score (t = −7.39, df = 38, P < 0.001) and verbal fluency scores (t = 3.892, df = 38, P < 0.001) between the two groups.
Correlation between verbal fluency performance and subject characteristics
There were no significant correlations between verbal fluency scores and age, intelligence quotient, or Y-BOCS scores in the patients with OCD.
NIRS data from subjects performing the verbal fluency task
The grand-average waveforms of the change in oxygenated hemoglobin in the control group increased during the task period (Figure 1). In contrast, those in the OCD group did not change markedly (Figure 1). In the OCD group, the mean z-score during the task period, compared with the pre-task baseline (11.245), was significantly smaller than that of the control group (3.173) at channel 18 (t = 2.285, P = 0.028, Figures 2B and 3), and was not significant after correction for multiple comparisons. The mean z-score in each channel was not significantly correlated with clinical characteristics, ie, gender (P = 0.485), age (P = 0.324), intelligence quotient (P = 0.57), MOCI score (P = 0.329), verbal fluency scores (P = 0.647), Y-BOCS scores (P = 0.82), duration of illness (P = 0.296), and HDRS score (P = 0.147). There were no significant differences in mean z-score between medication-free and medication groups (t = 1.562, df = 18, P = 0.136), and the mean z-score was not significantly correlated with antidepressant dose (P = 0.184). In addition, there were no significant correlations between prefrontal hemodynamic responses and verbal fluency scores.
Figure 3.
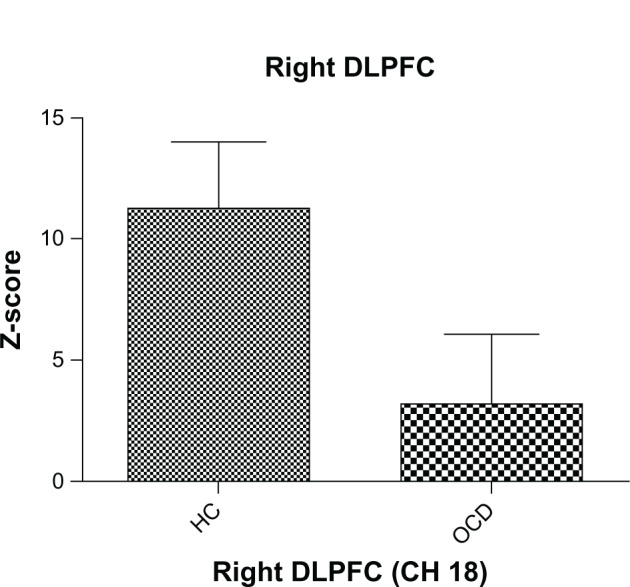
Mean z-score during the verbal fluency task in the right dorsolateral prefrontal cortex (channel 18). The vertical bars represent the standard error. The oxygenated hemoglobin concentration in patients with obsessive-compulsive disorder at the right dorsolateral prefrontal cortex was significantly smaller than that in controls (P < 0.05).
Abbreviations: DLPFC, dorsolateral prefrontal cortex; HC, healthy controls; OCD, obsessive-compulsive disorder; CH, Channel.
Discussion
In the present study, changes in oxygenated hemoglobin concentration during the verbal fluency task were significantly smaller in patients with OCD than those in healthy controls. These results support the hypothesis that prefrontal dysfunction is associated with adult OCD and suggest the ability of the verbal fluency task during NIRS measurement to detect the abnormality.
Abnormalities in the dorsolateral prefrontal cortex have been reported in studies using other imaging modalities. In functional magnetic resonance imaging studies, Nakao et al24,25 showed that patients with OCD had weaker activation than controls in the dorsolateral prefrontal cortex, anterior cingulate cortex, and caudate nucleus. In a positron emission tomography study, Martinot et al26 showed that absolute regional cerebral glucose metabolic rates in the lateral prefrontal cortex were significantly lower in patients with OCD than in control subjects. The current results are consistent with these previous reports.
In an NIRS study, Ota et al8 and Okada et al9 showed that prefrontal hemodynamic responses were lower in both adult and pediatric patients with OCD using the Stroop color-word task, but that the areas with a reduced prefrontal hemodynamic response were different between these two populations. Ota et al8 reported a smaller response in the frontopolar region in the pediatric OCD group, while Okada et al9 reported a smaller response in the left lateral prefrontal region in adult patients with OCD. In the present study, adult patients with OCD had significantly smaller changes in oxygenated hemoglobin concentrations than controls at channel 18, localized near the right lateral prefrontal region. The difference between this result and that of Okada et al9 may be explained by the difference in the activation task and by differences in the study populations. With respect to laterality, previous neuroimaging studies have reported abnormalities in both hemispheres.27–29 Further study is needed to resolve these differences.
Although many findings have been accumulated about cognitive function including verbal memory, learning, and retrieval in OCD, the results are inconsistent in many cases.6,30 The reason for this inconsistency may be that existing neuropsychological examination refects multiple aspects of cognitive function. In our study, there was a significant difference in the mean verbal fluency score between patients with OCD and controls. This result supports not only the previous results for impairment in verbal fluency,30 but also a possibility of this originating in impairment of response inhibition and/or attentional set-shifting.
Many previous studies have suggested that frontal lobe activity during the verbal fluency task, as measured by NIRS, is decreased in many psychiatric disorders.10,20,31–34 Specifically, reduced responses during the verbal fluency task have been reported repeatedly in the frontal pole in patients with schizophrenia.10,31,33,34 In some cases, the clinical distinction between schizophrenia and OCD is difficult.35,36 Therefore, the difference in localization of the response may be useful in the differential diagnosis of these disorders. Further direct comparisons between schizophrenia and OCD are needed to explore the diagnostic potential of NIRS localization.
The results of this study must be viewed in light of some limitations. First, the difference in the right dorsolateral prefrontal cortex between the patients and controls was not significant after correction for multiple comparisons. This may be due to the relatively small sample size. Future studies should include a larger sample to confirm the reduced response in the dorsolateral prefrontal cortex, even after correction for multiple comparisons. Second, in this study, 13 subjects were taking psychotropic medications. Given that antidepressants have been reported to affect hemodynamic responses,37 a medication effect cannot be excluded.
Conclusion
Prefrontal hemodynamic responses were examined in adults with OCD using the verbal fluency task. Our results show that patients with OCD had significantly smaller changes in oxygenated hemoglobin concentration in the prefrontal cortex, especially in the right dorsolateral prefrontal regions. These results support the notion that the dorsolateral prefrontal cortex plays a role in the pathophysiology of OCD.
Acknowledgment
The authors thank Yutaka Imai at Shimadzu Corporation for skilled technical and methodological support.
Footnotes
Disclosure
The authors report no conflicts of interest in this work.
References
- 1.Carliner G, Robinson C, Tomes N. Lifetime models of female labor supply, wage rates, and fertility. Res Popul Econ. 1984;5:1–27. [PubMed] [Google Scholar]
- 2.Weissman MM, Bland RC, Canino GJ, et al. The cross national epidemiology of obsessive compulsive disorder. The Cross National Collaborative Group. J Clin Psychiatry. 1994;55(Suppl):5–10. [PubMed] [Google Scholar]
- 3.Ruscio AM, Stein DJ, Chiu WT, Kessler RC. The epidemiology of obsessive-compulsive disorder in the National Comorbidity Survey Replication. Mol Psychiatry. 2010;15(1):53–63. doi: 10.1038/mp.2008.94. [DOI] [PMC free article] [PubMed] [Google Scholar]
- 4.American Psychiatric Association . Diagnostic and Statistical Manual of Mental Disorders. 4th ed. Washington, DC: American Psychiatric Press; 1994. [Google Scholar]
- 5.Michaud CM, McKenna MT, Begg S, et al. The burden of disease and injury in the United States 1996. Popul Health Metr. 2006;4:11. doi: 10.1186/1478-7954-4-11. [DOI] [PMC free article] [PubMed] [Google Scholar]
- 6.Menzies L, Chamberlain SR, Laird AR, Thelen SM, Sahakian BJ, Bullmore ET. Integrating evidence from neuroimaging and neuropsychological studies of obsessive-compulsive disorder: the orbitofronto-striatal model revisited. Neurosci Biobehav Rev. 2008;32(3):525–549. doi: 10.1016/j.neubiorev.2007.09.005. [DOI] [PMC free article] [PubMed] [Google Scholar]
- 7.Sakai Y, Narumoto J, Nishida S, et al. Corticostriatal functional connectivity in non-medicated patients with obsessive-compulsive disorder. Eur Psychiatry. 2011;26(7):463–469. doi: 10.1016/j.eurpsy.2010.09.005. [DOI] [PubMed] [Google Scholar]
- 8.Ota T, Iida J, Sawada M, et al. Reduced prefrontal hemodynamic response in pediatric obsessive-compulsive disorder as measured by near-infrared spectroscopy. Child Psychiatry Hum Dev. 2012 Jul 16; doi: 10.1007/s10578-012-0323-0. [Epub ahead of print.] [DOI] [PubMed] [Google Scholar]
- 9.Okada K, Ota T, Iida J, Kishimoto N, Kishimoto T. Lower prefrontal activity in adults with obsessive-compulsive disorder as measured by near-infrared spectroscopy. Prog Neuropsychopharmacol Biol Psychiatry. 2012;43C:7–13. doi: 10.1016/j.pnpbp.2012.11.013. [DOI] [PubMed] [Google Scholar]
- 10.Takizawa R, Kasai K, Kawakubo Y, et al. Reduced frontopolar activation during verbal fluency task in schizophrenia: a multi-channel near-infrared spectroscopy study. Schizophr Res. 2008;99(1–3):250–262. doi: 10.1016/j.schres.2007.10.025. [DOI] [PubMed] [Google Scholar]
- 11.First MB, Spitzer RL, Gibbon M, Williams JBW. Structured Clinical Interview for DSM-IV-TR Axis I Disorders, Research Version, Patient Edition. (SCID-I/P) New York, NY: Biometrics Research, New York State Psychiatric Institute; 2002. [Google Scholar]
- 12.First MB, Spitzer RL, Gibbon M, Williams JBW. Structured Clinical Interview for DSM-IV-TR Axis I Disorders, Research Version, NonPatient Edition. (SCID-I/NP) New York, NY: Biometrics Research, New York State Psychiatric Institute; 2002. [Google Scholar]
- 13.Oldfield RC. The assessment and analysis of handedness: the Edinburgh inventory. Neuropsychologia. 1971;9(1):97–113. doi: 10.1016/0028-3932(71)90067-4. [DOI] [PubMed] [Google Scholar]
- 14.Goodman WK, Price LH, Rasmussen SA, et al. The Yale-Brown Obsessive Compulsive Scale. I. Development, use, and reliability. Arch Gen Psychiatry. 1989;46(11):1006–1011. doi: 10.1001/archpsyc.1989.01810110048007. [DOI] [PubMed] [Google Scholar]
- 15.Goodman WK, Price LH, Rasmussen SA, et al. The Yale-Brown Obsessive Compulsive Scale. II. Validity. Arch Gen Psychiatry. 1989;46(11):1012–1016. doi: 10.1001/archpsyc.1989.01810110054008. [DOI] [PubMed] [Google Scholar]
- 16.Nakajima T, Nakamura M, Taga C, et al. Reliability and validity of the Japanese version of the Yale = Brown Obsessive-Compulsive Scale. Psychiatry Clin Neurosci. 1995;49(2):121–126. doi: 10.1111/j.1440-1819.1995.tb01875.x. [DOI] [PubMed] [Google Scholar]
- 17.Sánchez-Meca J, López-Pina JA, López-López JA, Marín-Martínez F, Rosa-Alcázar AI, Gómez-Conesa A. The Maudsley Obsessive-Compulsive Inventory: a reliability generalization meta-analysis. Int J Clin Health Psychol. 2011;11(3):473–493. [Google Scholar]
- 18.Hamilton M. Development of a rating scale for primary depressive illness. Br J Soc Clin Psychol. 1967;6(4):278–296. doi: 10.1111/j.2044-8260.1967.tb00530.x. [DOI] [PubMed] [Google Scholar]
- 19.Hamilton M. The assessment of anxiety states by rating. Br J Med Psychol. 1959;32(1):50–55. doi: 10.1111/j.2044-8341.1959.tb00467.x. [DOI] [PubMed] [Google Scholar]
- 20.Kameyama M, Fukuda M, Yamagishi Y, et al. Frontal lobe function in bipolar disorder: a multichannel near-infrared spectroscopy study. Neuroimage. 2006;29(1):172–184. doi: 10.1016/j.neuroimage.2005.07.025. [DOI] [PubMed] [Google Scholar]
- 21.Okamoto M, Dan H, Sakamoto K, et al. Three-dimensional probabilistic anatomical cranio-cerebral correlation via the international 10–20 system oriented for transcranial functional brain mapping. Neuroimage. 2004;21(1):99–111. doi: 10.1016/j.neuroimage.2003.08.026. [DOI] [PubMed] [Google Scholar]
- 22.Hoshi Y, Kobayashi N, Tamura M. Interpretation of near-infrared spectroscopy signals: a study with a newly developed perfused rat brain model. J Appl Physiol. 2001;90(5):1657–1662. doi: 10.1152/jappl.2001.90.5.1657. [DOI] [PubMed] [Google Scholar]
- 23.Strangman G, Culver JP, Thompson JH, Boas DA. A quantitative comparison of simultaneous BOLD fMRI and NIRS recordings during functional brain activation. Neuroimage. 2002;17(2):719–731. [PubMed] [Google Scholar]
- 24.Nakao T, Nakagawa A, Yoshiura T, et al. A functional MRI comparison of patients with obsessive-compulsive disorder and normal controls during a Chinese character Stroop task. Psychiatry Res. 2005;139(2):101–114. doi: 10.1016/j.pscychresns.2004.12.004. [DOI] [PubMed] [Google Scholar]
- 25.Nakao T, Nakagawa A, Yoshiura T, et al. Brain activation of patients with obsessive-compulsive disorder during neuropsychological and symptom provocation tasks before and after symptom improvement: a functional magnetic resonance imaging study. Biol Psychiatry. 2005;57(8):901–910. doi: 10.1016/j.biopsych.2004.12.039. [DOI] [PubMed] [Google Scholar]
- 26.Martinot JL, Allilaire JF, Mazoyer BM, et al. Obsessive-compulsive disorder: a clinical, neuropsychological and positron emission tomography study. Acta Psychiatr Scand. 1990;82(3):233–242. doi: 10.1111/j.1600-0447.1990.tb03059.x. [DOI] [PubMed] [Google Scholar]
- 27.Alptekin K, Degirmenci B, Kivircik B, et al. Tc-99m HMPAO brain perfusion SPECT in drug-free obsessive-compulsive patients without depression. Psychiatry Res. 2001;107(1):51–56. doi: 10.1016/s0925-4927(01)00086-5. [DOI] [PubMed] [Google Scholar]
- 28.Busatto GF, Zamignani DR, Buchpiguel CA, et al. A voxel-based investigation of regional cerebral blood flow abnormalities in obsessive-compulsive disorder using single photon emission computed tomography (SPECT) Psychiatry Res. 2000;99(1):15–27. doi: 10.1016/s0925-4927(00)00050-0. [DOI] [PubMed] [Google Scholar]
- 29.Nakao T, Nakagawa A, Nakatani E, et al. Working memory dysfunction in obsessive-compulsive disorder: a neuropsychological and functional MRI study. J Psychiatr Res. 2009;43(8):784–791. doi: 10.1016/j.jpsychires.2008.10.013. [DOI] [PubMed] [Google Scholar]
- 30.Henry JD. A meta-analytic review of Wisconsin Card Sorting Test and verbal fluency performance in obsessive-compulsive disorder. Cogn Neuropsychiatry. 2006;11(2):156–176. doi: 10.1080/13546800444000227. [DOI] [PubMed] [Google Scholar]
- 31.Azechi M, Iwase M, Ikezawa K, et al. Discriminant analysis in schizophrenia and healthy subjects using prefrontal activation during frontal lobe tasks: a near-infrared spectroscopy. Schizophr Res. 2010;117(1):52–60. doi: 10.1016/j.schres.2009.10.003. [DOI] [PubMed] [Google Scholar]
- 32.Herrmann MJ, Ehlis AC, Fallgatter AJ. Bilaterally reduced frontal activation during a verbal fluency task in depressed patients as measured by near-infrared spectroscopy. J Neuropsychiatry Clin Neurosci. 2004;16(2):170–175. doi: 10.1176/jnp.16.2.170. [DOI] [PubMed] [Google Scholar]
- 33.Suto T, Fukuda M, Ito M, Uehara T, Mikuni M. Multichannel near-infrared spectroscopy in depression and schizophrenia: cognitive brain activation study. Biol Psychiatry. 2004;55(5):501–511. doi: 10.1016/j.biopsych.2003.09.008. [DOI] [PubMed] [Google Scholar]
- 34.Takizawa R, Hashimoto K, Tochigi M, et al. Association between sigma-1 receptor gene polymorphism and prefrontal hemodynamic response induced by cognitive activation in schizophrenia. Prog Neuropsychopharmacol Biol Psychiatry. 2009;33(3):491–498. doi: 10.1016/j.pnpbp.2009.01.014. [DOI] [PubMed] [Google Scholar]
- 35.Rodriguez CI, Corcoran C, Simpson HB. Diagnosis and treatment of a patient with both psychotic and obsessive-compulsive symptoms. Am J Psychiatry. 2010;167(7):754–761. doi: 10.1176/appi.ajp.2009.09070997. [DOI] [PMC free article] [PubMed] [Google Scholar]
- 36.Poyurovsky M, Zohar J, Glick I, et al. Obsessive-compulsive symptoms in schizophrenia: implications for future psychiatric classifications. Compr Psychiatry. 2012;53(5):480–483. doi: 10.1016/j.comppsych.2011.08.009. [DOI] [PubMed] [Google Scholar]
- 37.Kohmura K, Iwamoto K, Aleksic B, et al. Effects of sedative antidepressants on prefrontal cortex activity during verbal fluency task in healthy subjects: a near-infrared spectroscopy study. Psychopharmacology (Berl) 2012;226(1):75–81. doi: 10.1007/s00213-012-2885-8. [DOI] [PubMed] [Google Scholar]