

Abstract
Corticofugal projections from the primary auditory cortex (A1) have been shown to play a role in modulating subcortical processing. However, functional properties of the corticofugal neurons and their synaptic circuitry mechanisms remain unclear. In this study, we performed in vivo whole-cell recordings from layer 5 (L5) pyramidal neurons in the rat A1 and found two distinct neuronal classes according to their functional properties. Intrinsic-bursting (IB) neurons, the L5 corticofugal neurons, exhibited early and rather unselective spike responses to a wide range of frequencies. The exceptionally broad spectral tuning of IB neurons was attributable to their broad excitatory inputs with long temporal durations and inhibitory inputs being more narrowly tuned than excitatory inputs. This uncommon pattern of excitatory–inhibitory interplay was attributed initially to a broad thalamocortical convergence onto IB neurons, which also receive temporally prolonged intracortical excitatory input as well as feedforward inhibitory input at least partially from more narrowly tuned fast-spiking inhibitory neurons. In contrast, regular-spiking neurons, which are mainly corticocortical, exhibited sharp frequency tuning similar to L4 pyramidal cells, underlying which are well-matched purely intracortical excitation and inhibition. The functional dichotomy among L5 pyramidal neurons suggests two distinct processing streams. The spectrally and temporally broad synaptic integration in IB neurons may ensure robust feedback signals to facilitate subcortical function and plasticity in a general manner.
Introduction
Sensory systems often consist of both ascending and descending pathways. The descending projections of sensory cortices, i.e., corticofugal projections, emanate from layer 5 (L5) and L6 (Winer, 2005; Cudeiro and Sillito, 2006). In the auditory system, L5 of the primary auditory cortex (A1) projects to higher-order thalamic nuclei that innervate the secondary cortex, driving responses in these thalamic areas and forming an indirect route for the transfer of information from the A1 into the higher-order cortex (Bourassa et al., 1995; Guillery, 1995; Sherman and Guillery, 2002). It also projects to midbrain and brainstem nuclei, such as the inferior colliculus and cochlear nucleus (Games and Winer, 1988; Moriizumi and Hattori, 1991; Weedman and Ryugo, 1996; Winer et al., 1998). Corticofugal projections have been shown to influence auditory functions of subcortical neurons, for example, by sharpening or shifting their tuning curves in the frequency and time domains (Villa et al., 1991; Yan and Suga, 1996; Zhang and Suga, 1997; Zhang et al., 1997). Despite these experimental observations, the functional roles of corticofugal projections are not well understood (Winer, 2005). To address this issue, it is essential to understand what information is specifically processed in corticofugal neurons and what information is carried by the output corticofugal projection.
Previously in L5 of the cat auditory cortex, four types of pyramidal neuron (pyramidal, star pyramidal, fusiform, and inverted pyramidal) were described based on Golgi staining (Winer and Prieto, 2001). In in vitro studies of rodent sensory cortices, two classes of L5 pyramidal neurons have been categorized based on morphological and intrinsic membrane properties (Connors et al., 1982; Agmon and Connors, 1992; Chagnac-Amitai et al., 1990; Larkman and Mason, 1990; Kasper et al., 1994; Markram et al., 1997; Zhu and Connors, 1999; Hefti and Smith, 2000; Schubert et al., 2001; Hattox and Nelson, 2007). The intrinsic-bursting (IB) neurons are characterized by large cell bodies and thick tufted apical dendrites reaching L1. They contribute to the corticofugal projections to subcortical and brainstem nuclei (Kelly and Wong, 1981; Games and Winer, 1988; Ojima et al., 1992). The regular-spiking (RS) neurons exhibit smaller-sized somas and do not fire bursts. Their apical dendrites are slender and shorter, with fewer oblique branches that end without terminal tufts. Their axons mainly contribute to callosal connections to the sensory cortex in the other hemisphere (Games and Winer, 1988; Rüttgers et al., 1990; Winer and Prieto, 2001) and also to corticostriatal projections (Ojima et al., 1992; Hattox and Nelson, 2007). The IB and RS neurons in the rodent cortex likely correspond to the large pyramidal and medium pyramidal cells in the cat (Winer and Prieto, 2001). The auditory processing properties of these two major types of L5 pyramidal neurons are poorly understood. Moreover, the synaptic circuits underlying their functions remain elusive. In this study, we have used a set of in vivo patch-clamp recording and cortical silencing methods to investigate the frequency representation of L5 pyramidal neurons and the underlying synaptic inputs.
Materials and Methods
Animal preparation and auditory cortical mapping
All experimental procedures used in this study were approved by the Animal Care and Use Committee at the University of Southern California. Experiments were performed in a sound-attenuation booth (Acoustic Systems). Adult female Sprague Dawley rats (∼3 months old and weighing 250–300 g) were anesthetized with ketamine (45 mg/kg) and xylazine (6.4 mg/kg). The auditory cortex was exposed, and the ear canal on the same side was plugged. Pure tones (0.5–64 kHz at 0.1 octave intervals, 50 ms duration, 3 ms ramp) at eight sound intensities (from 0 to 70 dB SPL, 10 dB interval) were delivered through a calibrated free-field speaker facing the contralateral ear. The 568 testing stimuli were presented in a pseudorandom sequence. Multiunit spikes were recorded with a parylene-coated tungsten microelectrode (2 MΩ; FHC) at 500–600 μm below the pia. Electrode signals were amplified (Plexon) and bandpass filtered between 300 and 6000 Hz. A custom-made software (LabView; National Instruments) was used to extract the spike times. The number of tone-evoked spikes was counted within a window of 10–30 ms from the onset of tone stimuli. Auditory cortical mapping was performed by sequentially recording from an array of cortical sites to identify the location and frequency gradient of A1. During the mapping procedure, the cortical surface was slowly perfused with prewarmed artificial CSF (ACSF) (in mm: 124 NaCl, 1.2 NaH2PO4, 2.5 KCl, 25 NaHCO3, 20 glucose, 2 CaCl2, and 1 MgCl2).
In vivo whole-cell voltage-clamp recordings
After mapping of A1, neurons located at 700–900 μm below the pia, corresponding to L5 of the auditory cortex (Games and Winer, 1988; Hefti and Smith, 2000; Winer and Prieto, 2001; Lakatos et al., 2007), were specifically targeted. The locations of recordings were confirmed in some experiments with Nissl staining. Whole-cell recordings were performed as described previously (Wu et al., 2006, 2008). We used agar (4%) to minimize cortical pulsation. For voltage-clamp recordings, the pipette (impedance, ∼4–5 MΩ) solution contained the following: 125 mm Cs-gluconate, 5 mm tetraethylammonium-Cl, 4 mm MgATP, 0.3 mm GTP, 10 mm phosphocreatine, 10 mm HEPES, 1 mm EGTA, 2 mm CsCl, 1.5 mm QX-314, and 1% biocytin, pH 7.2. Recordings were made with an Axopatch 200B amplifier (Molecular Devices). The whole-cell and pipette capacitance (30–70 pF) were completely compensated, and the initial series resistance was compensated for 50–60% at 100 μs lag. Signals were filtered at 5 kHz and sampled at 10 kHz. To obtain tone-evoked synaptic responses, neurons were clamped at two different voltages, −80 and 0 mV, which are around the reversal potentials for inhibitory and excitatory currents, respectively. As reported and discussed previously (Wu et al., 2006, 2008; Zhou et al., 2010), the whole-cell recordings under our recording condition with large tip sizes targeted exclusively pyramidal neurons. The experimental results in this study also support this notion. We did not ever record any fast-spiking (FS) cells when recording pipettes with impedance <6 MΩ were used. The quality of voltage clamp in our recordings was reasonably good as discussed in previous studies (Wu et al., 2006, 2011; Zhou et al., 2010). This was further indicated by the absence of significant excitatory currents when the cell was clamped at 0 mV.
Cell-attached recordings and sequential current-clamp recordings
For cell-attached recordings, pipettes with smaller tip openings (impedance, ∼10 MΩ; Wu et al., 2008; Zhou et al., 2010) were used. ACSF was used as the intra-pipette solution. The recording was performed in a similar way as the whole-cell recording, except that a loose seal (0.1–0.5 GΩ) was made on neurons, allowing spikes only from the patched cell to be recorded. Signals were recorded under the voltage-clamp mode and filtered at 10 kHz. Spike shapes were determined by custom-developed LabView software to identify the FS cell type. The chance for encountering FS neurons with a small-tipped pipette was ∼10% but was almost 0 when the recording pipette had an impedance of <6 MΩ. In experiments intended for sequential cell-attached followed by current-clamp recording, potassium-based intra-pipette solution was used: 125 mm K-gluconate, 4 mm MgATP, 0.3 mm GTP, 10 mm phosphocreatine, 10 mm HEPES, 1 mm EGTA, pH 7.2, and 1% biocytin. After identifying the functional class of the recorded cells according to their spike responses, the cell-attached recording was followed by breaking in the membrane to reveal the subthreshold responses. The morphologies of the recorded cells were reconstructed with the standard histological procedure of biocytin staining (Hefti and Smith, 2000).
Cortical silencing
The cortex was pharmacologically silenced following the method established in our previous study (Liu et al., 2007; Khibnik et al., 2010; Zhou et al., 2010, 2012). A mixture of SCH50911 [(2S)(+)5,5-dimethyl-2-morpholineacetic acid] (6 mm; a specific antagonist of GABAB receptors) and muscimol (4 mm; an agonist of GABAA receptor) was used to effectively silence a relatively large cortical region. The mixture solution (dissolved in ACSF containing fast green) was injected through a glass micropipette with a tip opening of 2–3 μm in diameter. The pipette was inserted to a depth of 700 μm beneath the cortical surface. Solutions were injected under a pressure of 2–3 psi for 5 min. The injected volume was estimated to be ∼50–100 nl, as measured in mineral oil. The staining by fast green was monitored under a surgical microscope, which covered a cortical area with a radius of ∼1 mm by the end of the injection.
Data analyses
Synaptic conductances.
Excitatory and inhibitory synaptic conductances were derived according to the following (Borg-Graham et al., 1998; Wehr and Zador, 2003; Zhang et al., 2003; Liu et al., 2007; M. Zhang et al., 2011):
ΔI is the amplitude of synaptic current at a time point. Gr and Er are the resting conductance and resting membrane potential, which were derived from the baseline current of each recording. Ge and Gi are the excitatory and inhibitory synaptic conductance, respectively. V is the holding voltage, and Ee (0 mV) and Ei (−80 mV) are the reversal potentials. In this study, a corrected clamping voltage was used, instead of the holding voltage applied (Vh). V(t) is corrected by V(t) = Vh − Rs × I(t), where Rs was the effective series resistance. A 10 mV junction potential was corrected. By holding the recorded cell at two different voltages, Ge and Gi were calculated from the equation. Ge and Gi reflect the strength of pure excitatory and inhibitory synaptic inputs, respectively.
Tone-evoked responses.
In cell-attached recordings, spikes could be detected without ambiguity because their amplitudes were normally higher than 100 pA, whereas the baseline fluctuation was <5 pA. Tone-driven spikes were counted within a 0–50 ms time window after the onset of tones. The spike response latency was defined as the interval between the onset of the tone and the time point at which spike rate in the peristimulus spike time histogram (PSTH) for all responses becomes higher than the baseline level by 3 SDs of the baseline fluctuation. All the synaptic responses were averaged by trials. The peak synaptic responses were analyzed within a 0–100 ms time window after the tone onset. The onset latency of this average trace was identified at the time point in the rising phase of the response wave form, in which the amplitude exceeded the baseline level by 2 SDs of the baseline fluctuation. Only responses with onset latencies within 7–50 ms from the onset of tone stimulus were considered in this study.
Tonal receptive field and frequency tuning.
Tonal receptive fields (TRFs) were reconstructed according to the array sequence. Characteristic frequency (CF) was defined as the frequency that evoked a reliable response at the lowest intensity level. TRF bandwidth was calculated at 10 dB above the intensity threshold (BW10) in cell-attached recordings and at 20 dB above the intensity threshold (BW20) in whole-cell recordings. The total responding frequency range was determined based on the continuity of evoked responses in the frequency domain. The boundary of the receptive field was determined at where there were more than two consecutive testing tones in the frequency domain that failed to evoke responses. To quantify the shape of the synaptic tuning curve, an envelope curve was derived based on the peak amplitude of each synaptic input within the total tuning curve using MATLAB software Envelope 1.1 (MathWorks), and the half-peak bandwidth (50% BW) was defined as the frequency range for responses >50% of the maximum (Sun et al., 2010).
Deriving membrane potential responses.
Membrane potential responses were derived from the recorded excitatory and inhibitory responses based on an integrate-and-fire model (Liu et al., 2007; Zhou et al., 2010; M. Zhang et al., 2011):
 |
where Vm(t) is the membrane potential at time t, C the whole-cell capacitance, Gr the resting leaky conductance, and Er the resting membrane potential. Based on the synaptic inputs, a tone stimulus only generated one spike response. C, Gr, and Er were determined from the experiment. In modeling with simulated synaptic conductances, Gr was calculated based on the equation Gr = C × Gm/Cm, where Gm, the specific membrane conductance, is 2e−5 S/cm2 (Stuart and Spruston, 1998), and Cm, the specific membrane capacitance, is 1e−6 F/cm2 (Hines, 1993).
Modeling.
The synaptic inputs to a pyramidal neuron in L5 were simulated by the following equation (Zhang et al., 2003; Zhou et al., 2010):
I(t) is the modeled synaptic current, a is the amplitude factor, H(t) is the Heaviside step function, and t0 is the onset delay of excitatory or inhibitory input. τrise and τdecay define the shape of the rising phase and the decay of the synaptic current. The τrise and τdecay were chosen by fitting the average shape of recorded synaptic responses with the above function. The t0 and a are chosen based on our experimental data.
Statistical analyses.
All statistical analysis was performed in OriginPro 8 and MATLAB 2010. Datasets were first tested for normal distribution (p > 0.05) and equal variances before performing appropriate parametric statistics. For two-group comparisons, most data were treated with unpaired t test. Only synaptic data from the same cells were treated with paired t test. For three or more group comparisons, one-way ANOVA was applied to test significance, and Scheffé's test was used to further compare group means. Summarized data were presented in figures as mean ± SD. K-means cluster analysis was applied to the normalized data points, which were linearly transformed to have a mean of 0 and variance of 1 in each dimension.
Results
IB and RS neurons in L5
Although it has been well documented in rodent sensory cortices that L5 pyramidal neurons fall into two classes, IB and RS, their auditory response properties have not been well characterized. In this study, we first examined spike TRFs of L5 neurons in the A1 of adult rats with in vivo cell-attached loose-patch recordings. The parameters of the patch pipettes were chosen to preferentially record from pyramidal neurons (see Materials and Methods). For each recorded cell, the spike TRF was mapped with 71 × 8 tonal stimuli for 3–10 repetitions. Two types of pyramidal neurons were distinguishable based on their evoked spike patterns. In approximately half of the recorded neurons (16 of 30), tone bursts elicited transient spike responses to the stimulus onsets with only one spike evoked at most (Fig. 1A, inset). For these neurons, a well-tuned V-shaped spike TRF similar to that of L4 neurons was observed (Fig. 1A,C, compare with Tan et al., 2004; Wu et al., 2008). These neurons were putative RS neurons. In the other recorded cells (14 of 30), tone bursts of CF elicited a short burst of spikes (usually containing two to three spikes) to the stimulus onset (Fig. 1B, inset). Spontaneous bursts were also observed in these cells (Fig. 1B, inset). Such bursting activity suggests that the cells might be IB neurons. In these putative IB neurons, the spike TRF was noticeably broad and occupied usually more than half of the testing frequency–intensity space above the intensity threshold (Fig. 1B,D).
Figure 1.

Response properties of RS and IB neurons in L5 of the rat A1. A, Spike TRF of an example RS neuron. Left, Array of PSTHs for responses to pure tones of various frequencies and intensities. Each PSTH trace depicts the spike response evoked by a 50 ms tone, sampled over five trials. Calibration: 1 spike per 10 ms bin, 50 ms. Right, Color map depicts the average evoked spike number in the frequency–intensity space. Inset, Three example response traces to the CF tone (at 70 dB), with the red line denoting the stimulus duration. Example spontaneous spikes outside the evoked response window are also shown on the right. The PSTH at the bottom was generated from responses to all the tone stimuli (bin size of 1 ms). B, An example IB neuron. Data are presented in the same way as in A. Calibration: 2 spikes per 10 ms bin, 50 ms. Note that CF tone evoked bursts of spikes and that spontaneous bursts were also observed in this neuron. Within the burst, the spike amplitude reduced over time. C, Color maps for TRFs of another three RS neurons. D, Color maps for TRFs of another three IB neurons. E, Average bandwidth at 10 dB above the intensity threshold (BW10) of the spike TRF for RS, IB, and L4 pyramidal neurons. One-way ANOVA (F = 83.2, p = 2.2 × 10⁻¹⁶) and multiple comparison Scheffé's test showed significant differences between RS–IB and IB–L4 groups (***p < 0.001). The cell number is indicated in the bars. F, Average spontaneous spike rate and evoked spike rate for RS and IB neurons. **p < 0.01, two-sample t test with unequal variance (p = 0.0051 for spontaneous, p = 0.0087 for evoked). G, Average spike latency, defined as the interval between the onset of the tone and the time point at which the spike rate in the PSTH becomes higher than the average baseline level by 3 SDs of the baseline fluctuation. One-way ANOVA (F = 42.5, p = 1.9 × 10⁻⁹) and Scheffé's test showed significant differences between RS–IB and RS–L4 groups (***p < 0.001). H, Plot of BW10 versus spike latency. RS (black) and IB (red) neurons distinguished by the absence/presence of bursting firing patterns were partitioned into two separate clusters by the K-means clustering analysis. Whiskers show mean ± SD.
As quantified by the bandwidth at 10 dB above the intensity threshold (i.e., BW10), the spike TRF of putative IB neurons (identified by burst spiking in response to CF tones) was markedly broader than that of putative RS neurons (identified by single-spike activity) as well as that of pyramidal cells in L4 (Fig. 1E). In addition, the IB neurons were distinct from the RS neurons by exhibiting higher levels of evoked and spontaneous spiking activity (Fig. 1F). The onset latency of CF-tone-evoked spike responses of IB neurons was significantly shorter than that of RS neurons, whereas it was similar to that of L4 pyramidal cells (Fig. 1G). This suggests that IB neurons may receive direct thalamic input similar as L4 pyramidal cells, whereas RS neurons may be driven mainly by cortical input. Based on the parameters of TRF bandwidth and response latency, the putative RS and IB neurons distinguished by their spike patterns fell into two separate clusters (Fig. 1H), indicating that the two classes of L5 pyramidal cells can be separated by combined receptive field and temporal response properties.
Subthreshold responses underlying the broad tuning of IB neurons
The differential level of frequency selectivity exhibited by L5 pyramidal neurons (Fig. 1E) can be explained by two possibilities. One direct explanation is that the two types of cells receive input of different frequency ranges, or otherwise, even if they receive input of similar ranges, a differential efficiency of transforming synaptic input into spike output may still lead to different selectivity levels between cell classes (Cardin et al., 2007; Wu et al., 2008). To examine these potential mechanisms, we performed sequential cell-attached and whole-cell current-clamp recordings from the same neurons as to directly compare their spike and subthreshold receptive fields. The whole-cell recording allowed staining of the cell and reconstructing its morphology with histology (see Materials and Methods). In Figure 2, A and B, two example cells are shown. They were identified as RS and IB neurons, respectively, based on spike pattern (top panel, inset). Their dendritic morphologies (bottom panel, inset) were also consistent with those reported for RS and IB neurons, respectively. The subthreshold membrane potential TRF of the RS neuron (Fig. 2A, bottom) was well tuned and looked similar to that of L4 pyramidal cells (compare with Tan et al., 2004; Wu et al., 2008). In comparison, the IB neuron, which had a broad spike TRF and relatively high spontaneous firing rate, exhibited an apparently broader subthreshold TRF than the RS neuron (Fig. 2B, bottom). Summary of similarly recorded nine RS and eight IB neurons shows that the average bandwidth of the subthreshold TRF at 20 dB above the intensity threshold (i.e., BW20) was much broader in IB than RS neurons (Fig. 2C, top, gray). This result indicates that the exceptionally broad spike tuning of IB neurons (Figs. 1E, 2C, top, white) can be primarily attributed to a broader range of synaptic inputs they receive compared with RS neurons.
Figure 2.
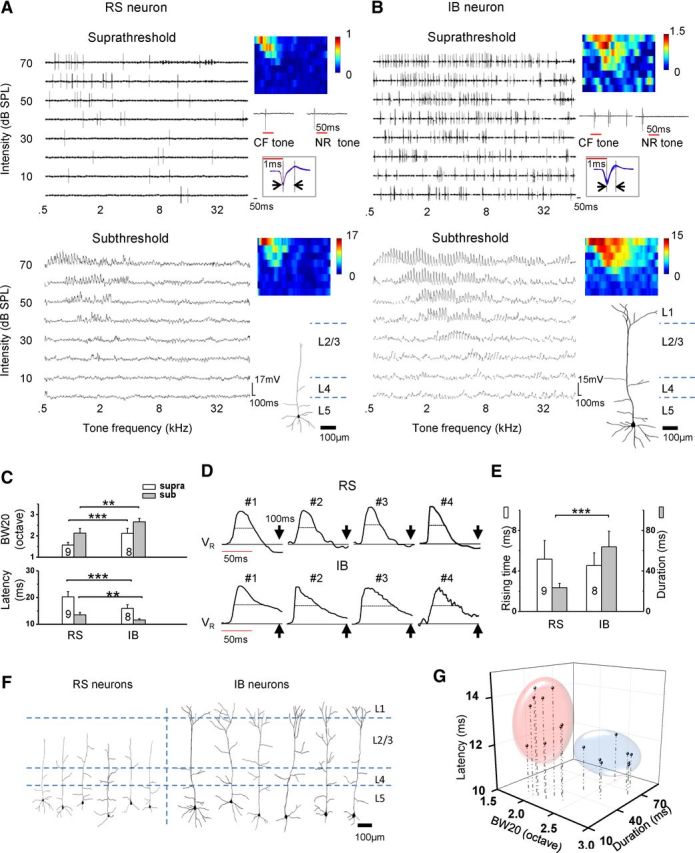
Subthreshold membrane potential responses of RS and IB neurons. A, Sequential cell-attached and current-clamp recordings from an example RS neuron. Top, Spike TRF (from 1 sample trial) recorded in the cell-attached mode. Color map depicts the average spike number over eight trials. Below the color map are example response traces to the CF tone and a tone outside the TRF (NR tone), with the red line denoting the 50 ms tonal stimulation. Boxed are 50 superimposed spike waveforms (3.5 ms trace), with vertical lines and arrows denoting the TPI (0.8 ms in this cell). Bottom, Subthreshold membrane potential responses recorded in the current-clamp mode (spikes were filtered out). Color map depicts the average peak depolarization voltage (millivolts) over four trials. Below the color map is the reconstructed morphology of this RS neuron. Note that the apical dendrite ended in L2/L3. B, Sequential cell-attached and current-clamp recordings from an example IB neuron. Data are presented in the same way as in A. The TPI was 0.7 ms. Note that this IB neuron had a tufted apical dendrite reaching L1. C, Top, Average bandwidths of spike (supra) and subthreshold (sub) response at 20 dB above the intensity threshold of the subthreshold TRF (BW20). The bandwidth of spike response in this measurement is consistent with BW10 in Figure 1E, because the threshold for spike response is usually 10 dB higher than that for subthreshold response. Bottom, Average onset latencies of spike and subthreshold depolarization response. **p < 0.01, ***p < 0.001, two-sample t test with equal variance. D, Traces of evoked subthreshold responses of sample RS and IB neurons. Traces are averaged responses (normalized) of four to six repetitions to tones at and near CF (±0.2 octave) at 70 dB. Red line denotes the tone duration. Black line denotes the level of the resting potential (VR). Dash line marks the half-peak duration of the depolarization response. Arrow marks the time point of 100 ms after the tone onset. E, Average duration of the rising phase of the depolarization response (white), and half-peak duration (gray). ***p < 0.001, two-sample t test with unequal variance. F, Dendritic morphologies and laminar locations of the reconstructed cells. G, Plot of cells in three dimensions. The three axes represent BW20, half-peak duration, and onset latency of depolarization response. Data points were segregated into two clusters based on the K-means clustering analysis, which were consistent with the grouping based on spike patterns. The RS and IB groups are outlined by the pink and blue oval, respectively.
We next quantified the onset latency of membrane depolarization responses, which presumably indicates the latency for the arrival of excitatory input. As shown in Figure 2C (bottom, gray), the onset latency of CF-tone-evoked membrane depolarization responses were significantly shorter in IB than RS neurons. This result directly provides an explanation for the observation that the evoked spike responses of IB neurons occurred earlier (Figs. 1G, 2C, bottom, white). Noticeably, the CF-tone-evoked depolarization responses in IB neurons sustained much longer than those in RS neurons (Fig. 2D). In the latter, a membrane hyperpolarization was observed after the initial depolarization (Fig. 2D, top). The temporal duration of evoked depolarization responses, measured at the level of 50% of maximum (i.e., half-peak duration), was 23.5 ± 3.9 ms for RS neurons but 63.8 ± 15.6 ms (mean ± SD) for IB neurons (p < 0.001, t test) (Fig. 2E, gray). This difference in response duration could be attributed primarily to a difference in decay kinetics, because the duration of the response rising phase did not differ significantly between the RS and IB neurons (Fig. 2E, white). A number of successfully reconstructed cell morphologies (Fig. 2F) confirmed that the RS and IB neurons identified by sensory-evoked spike patterns were non-tufted and thick-tufted pyramidal cells, respectively, consistent with previously reported morphologies of RS and IB neurons distinguished by spike response patterns to current injections (Hefti and Smith, 2000). In general, IB neurons have a larger soma size, a longer apical dendrite, and a higher whole-cell capacitance than RS neurons (Table 1). Based on three parameters (onset latency and temporal duration of evoked depolarization responses, as well as bandwidth of subthreshold TRFs), the identified IB and RS neurons could be well partitioned into separate clusters (Fig. 2G). Together, these results further support the notion that RS and IB neurons can be functionally distinguished based on the spectral broadness of synaptic input as well as response temporal properties.
Table 1.
Anatomical and biophysical properties of RS and IB neurons
| RS | IB | |
|---|---|---|
| Depth (μm) | 794.5 ± 64.8 (n = 9) | 803.7 ± 69.6 (n = 9) |
| Somatic area (μm2) | 135.9 ± 26.1*** | 245.2 ± 27.3 |
| Apical dendritic length (μm) | 452.2 ± 66.9*** | 670.0 ± 79.3 |
| Capacitance (pF) | 16.2 ± 6.0* | 47.4 ± 37.5 |
| VR (mV) | −62.5 ± 4.1 | −60 ± 3.1 |
Excitatory and inhibitory inputs to L5 neurons
Membrane potential responses reflect the result of the integration of excitatory and inhibitory synaptic inputs. To further dissect the contribution of excitatory and inhibitory inputs to the exceptionally broad tuning of IB neurons, we performed whole-cell voltage-clamp recordings (see Materials and Methods). By clamping the membrane potential of the cell at −80 and 0 mV, excitatory and inhibitory synaptic TRFs were obtained, respectively. Because QX-314, a blocker of voltage-gated sodium channels, was included in the intracellular solution, bona fide spike responses of the recorded neurons could not be experimentally assayed. Nevertheless, we would be able to predict cell type reasonably well according to the results from sequential cell-attached and current-clamp recording experiments (Fig. 2G). Two example cells from voltage-clamp recordings are shown in Figure 3, A and B. The first cell exhibited well tuned excitatory and inhibitory responses that matched each other in the frequency–intensity space (Fig. 3A), similar to L4 pyramidal cells (compare with Zhang et al., 2003; Tan et al., 2004; Wu et al., 2008; Sun et al., 2010). The receptive field property of synaptic inputs suggests that the cell was an RS neuron. In comparison, the second cell exhibited an extremely broad excitatory TRF and temporally more prolonged excitatory responses (Fig. 3B), suggesting that it was likely an IB neuron. Noticeably, the inhibitory TRF of the second cell looked narrower than its excitatory counterpart (Fig. 3B). Such narrower inhibition than excitation has not been reported for auditory cortical neurons previously.
Figure 3.

Synaptic inputs to RS and IB neurons. A, Excitatory (top) and inhibitory (bottom) TRFs (average of 3 trials) of a putative RS neuron recorded under clamping voltage of −80 and 0 mV, respectively. Color maps depict the peak amplitude of synaptic currents (nanoamperes). Below the color map is an example response trace evoked by a best-frequency tone at 70 dB, with the red line denoting the stimulus duration. B, Excitatory and inhibitory TRFs of a putative IB neuron. Data are presented in the same way as in A. C, Plot of cells in three dimensions. The three axes represent latency and half-peak duration of excitatory responses and half-maximum bandwidth of the excitatory tuning curve at 20 dB above the intensity threshold (50% BW20). Cells were partitioned into two separate clusters based on the K-means clustering analysis, which were categorized as the RS (outlined by pink) and IB (outlined by blue) group, respectively. D, Average 50% BW20 (top) and BW20 (bottom) of excitatory (exc) and inhibitory (inh) TRFs for the three types of neurons. For excitatory 50% BW20, one-way ANOVA was significant (F = 48.7, p = 3.6 × 10⁻⁹), and Scheffé's test showed significant differences between RS–IB and IB–L4 groups (***p < 0.001). For inhibitory 50% BW20, there was no significant difference among the cell types (one-way ANOVA, F = 0.17, p = 0.84). For excitatory BW20, one-way ANOVA was significant (F = 20.8, p = 1.0 × 10⁻⁵), and Scheffé's test showed significant differences between RS–IB (*p < 0.05), RS–L4 (**p < 0.01), and IB–L4 (***p < 0.001) groups. For inhibitory BW20, there was no significant difference among the cell types (one-way ANOVA, F = 1.34, p = 0.28). Paired t test was applied within each cell type to compare excitation and inhibition (#p < 0.05, ##p < 0.01, ###p < 0.001). E, Neuron modeling of membrane potential (Vm) response tuning under co-tuned inhibition (top) and narrower inhibition (bottom). Left, Boxed are the temporal profiles of the simulated excitatory (red) and inhibitory (black) conductance G (top) and that of the derived Vm response (bottom). Middle, The frequency tuning curves of excitatory and inhibitory inputs are modeled with Gaussian functions. In the co-tuned inhibition, excitatory and inhibitory tuning curves have the same bandwidths. In the narrower inhibition, the inhibitory tuning is narrower than the excitatory tuning. Right, The derived Vm response tuning in the absence (magenta) or presence (cyan) of inhibition. Dash line denotes the level of spike threshold (20 mV above the resting potential).
To distinguish cell types for the neurons recorded under the voltage-clamp mode, we plotted the cells along three axes representing the onset latency and half-peak duration of the CF-tone-evoked excitatory response and the half-maximum bandwidth of excitatory tuning at the level of 20 dB above the intensity threshold (i.e., 50% BW20) (Fig. 3C). The cells were partitioned into two clusters, which were then identified as RS and IB neuron groups, respectively. We next compared excitatory and inhibitory tuning properties between the RS and IB groups. Based on half-maximum bandwidth (50% BW20), which has been considered as a better measure of tuning sharpness than the total frequency range (Wu et al., 2008; Sun et al., 2010), among RS, IB, and L4 pyramidal cells, IB neurons exhibited the broadest excitatory tuning (Fig. 3D, top, white). The inhibitory tuning did not differ significantly between RS, IB, and L4 pyramidal cells (Fig. 3D, top, gray). Excitatory tuning was significantly broader than inhibitory tuning in IB neurons, whereas it is sharper than inhibitory tuning in RS and L4 pyramidal cells (Fig. 3D, top). In terms of total frequency range (BW20), excitation was also broader than inhibition in IB neurons, whereas in RS and L4 pyramidal cells, the range of excitation was similar to that of inhibition (Fig. 3D, bottom). These results indicate that the broad tuning of IB neurons can be attributed initially to the unusually broad range of excitatory inputs they receive and also raise the issue of whether the mismatch between the excitatory and inhibitory tuning of IB neurons can also influence their frequency selectivity.
A synaptic mechanism underlying broad frequency tuning
The narrower and more selective inhibitory inputs than excitatory inputs revealed in IB neurons is unique, because previous intracellular recording studies have all reported that excitation and inhibition have similar frequency tuning ranges (Wehr and Zador, 2003; Zhang et al., 2003; Tan et al., 2004; Wu et al., 2006, 2008; Tan and Wehr, 2009; Dorrn et al., 2010; Sun et al., 2010; Zhou et al., 2010). To understand how the spectral relationship between excitation and inhibition affects the frequency tuning of output response, we applied a conductance-based neuron model to simulate membrane potential (Vm) responses resulting from synaptic inputs of different tuning patterns (see Materials and Methods). We adjusted the spectral relationship between excitation and inhibition while fixing other parameters. Two scenarios were tested: (1) co-tuned excitation and inhibition; and (2) inhibition having a narrower frequency range than excitation. As shown in Figure 3E (top), the co-tuned inhibition apparently scaled down the Vm response tuning generated by excitation alone (compare cyan with magenta), resulting in a sharpening of spike response tuning through the iceberg effect (Wehr and Zador, 2003; Tan et al., 2004; Wu et al., 2008; Liu et al., 2011). When the inhibitory tuning became narrower (Fig. 3E, bottom), the Vm response tuning was broadened with a flattened peak. As a result, broader spike response tuning would be generated compared with the first scenario, although the general level of Vm response reduction was similar. The flattening of Vm response tuning could be attributed to an increasing amplitude ratio of excitation over inhibition (i.e., E/I ratio) away from the central peak of the frequency tuning. This modeling result demonstrates that the unusually broad tuning of IB neurons can be attributed not only to a broad range of excitatory inputs they receive but also to the inhibitory tuning being narrower than excitation.
Temporal properties of synaptic inputs to L5 neurons
As described previously, IB neurons exhibited longer sustained depolarization responses than RS neurons (Fig. 2D). We further analyzed temporal profiles of synaptic responses. We found that, in RS neurons, the CF-tone-evoked excitatory conductance decayed noticeably faster than the inhibitory conductance, whereas in IB neurons excitatory and inhibitory conductances appeared to have more similar temporal profiles (Fig. 4A, top). Quantifications of half-peak duration showed that IB neurons had much longer-lasting excitatory responses than RS and L4 pyramidal neurons (Fig. 4B, white). The temporal duration of inhibitory response, in contrast, was not significantly different between the cell types (Fig. 4B, gray). Consistent with the current-clamp recording result (Fig. 2C, bottom), the onset latencies of synaptic responses (both excitatory and inhibitory) of RS neurons were significantly longer than those of IB neurons, which, conversely, were not different from their counterparts in L4 pyramidal cells (Fig. 4C). In each type of cells, the onset latency of inhibition was slightly but significantly longer (by ∼2 ms) than that of excitation (Fig. 4C).
Figure 4.

Temporal properties of synaptic inputs to different types of neurons. A, Top, Normalized synaptic conductances (red for excitation, reversed in polarity) evoked by CF tones for three RS and three IB neurons. Dash line marks the half-maximum level. Bottom, The Vm response generated in the neuron model by integrating the synaptic conductances shown above. Dash line labels the level of the resting potential. Red line indicates the tone duration. B, Average half-peak durations of evoked excitatory (red) and inhibitory (black) conductances. For excitation, one-way ANOVA (F = 21.5, p = 8.1 × 10⁻⁶) and Scheffé's test showed a significant difference between RS–IB and IB–L4 groups (***p < 0.0001). For inhibition, there was no significant difference among cell groups (one-way ANOVA, F = 0.28, p = 0.76). ##p < 0.01, paired t test within cell type. C, Average onset latencies of CF-tone-evoked excitation and inhibition. One-way ANOVA (F = 7.6, p = 0.0032 for excitation; F = 3.54, p = 0.0475 for inhibition) and Scheffé's test (*p < 0.05) showed significant differences between RS–IB and RS–L4 groups. ###p < 0.001, paired t test within cell type. D, Average E/I ratio measured by peak response amplitude (white) or integrated charge (gray). *p < 0.05, two sample t test with unequal variance. E, The excitatory response of an IB neuron was artificially scaled down at different levels as to change E/I ratio (the E/I ratio value is given on top). The resulting Vm response from integrating the excitation (exc) and inhibition (inh) shown in the top panel consistently exhibited prolonged depolarization.
To understand how the observed temporal relationships between excitatory and inhibitory responses might contribute to the time course of the Vm response, we applied the neuron model described previously to derive the Vm response resulting from experimentally determined synaptic conductances (see Materials and Methods). As shown in Figure 4A (bottom), the derived Vm responses of RS neurons displayed only a transient depolarization, which was followed quickly by a hyperpolarizing response. In contrast, the derived Vm responses of IB neurons showed a much longer sustained depolarizing response without signs of hyperpolarization. These simulation results essentially recapitulate the experimentally observed temporal profiles of Vm responses in these two types of cells (Fig. 2D). The absence of a hyperpolarizing phase in IB neuron responses cannot be simply attributed to a lower level of inhibition compared with RS neurons, because the E/I ratio (measured by peak amplitude) was not significantly different between the two cell types (Fig. 4D, white). In addition, even when we artificially lowered the level of excitation (i.e., increased the relative level of inhibition), the derived Vm response of IB neurons still exhibited a long-lasting depolarization (Fig. 4E). Thus, the differential temporal profiles of Vm responses of IB and RS neurons can be primarily attributed to the different temporal relationships between excitation and inhibition.
Exploring the L5 circuits
The analysis of onset latency of excitatory responses (Fig. 4C) indicates that IB neurons may receive direct thalamic input. To further confirm this point, we recorded excitatory responses after silencing cortical spikes with a mixture of muscimol and SCH90511 (Liu et al., 2007; Khibnik et al., 2010; Zhou et al., 2012). Extracellular recordings confirmed that cortical spikes throughout L4–L6 and within a radius of 600 μm were eliminated after cortical injections of the mixture (Fig. 5A,B). Conversely, thalamic neurons were still responsive, indicating that the musimol mixture had not diffused into the thalamus (Fig. 5A,C). In L5 of the silenced A1, two types of cell were observed. In 10 of 18 neurons, tone-evoked excitatory responses were completely absent, although spontaneous synaptic currents were still observed (Fig. 5D, left). These neurons (called “L5 silenced”) did not receive excitatory input directly from the auditory thalamus. In the other neurons (8 of 18), evoked excitatory responses were present and formed a clear TRF (Fig. 5D, middle), indicating that these neurons (called “L5 active”) did receive direct thalamic input. As a control, we also recorded from the major thalamocortical recipient layer, L4. We confirmed that L4 neurons still received excitatory input after silencing intracortical connections (Fig. 5D, right). As summarized in Figure 5E, the onset latency of CF-tone-evoked excitatory responses of the L5 active neurons was not different from that of IB neurons or L4 pyramidal neurons in the normal and silenced A1. This suggests that L5 active neurons are most likely IB neurons, because the onset latency of excitatory responses of RS neurons is known to be significantly longer (Fig. 4C). Further supporting this notion, the frequency range of excitatory responses of the L5 active neurons was also similar to that of IB neurons in the normal A1 (Fig. 5F) but was significantly broader than that of RS neurons (p < 0.001, t test) and L4 pyramidals (Fig. 5F). Interestingly, the temporal duration of excitatory responses of the L5 active neurons was much shorter compared with IB neurons (Fig. 5G) but was similar to that of L4 pyramidals in the silenced A1 (Fig. 5G). This suggests that the thalamocortical input itself is relatively transient.
Figure 5.
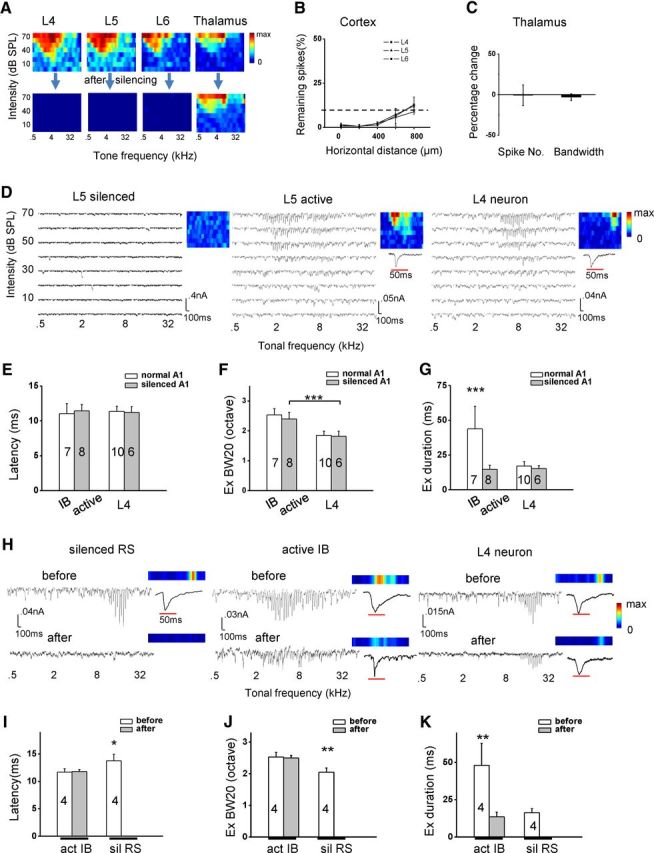
IB neurons receive direct thalamocortical input. A, Color maps of example multiunit spike TRFs in cortical L4–L6 and in the ventral division of the medial geniculate nucleus (MGBv) before and after cortical injection of the muscimol mixture. Color represents evoked spike number. Color scale (from left to right): 17, 18, 8, 11 for maximum. B, Remaining number of evoked spikes after cortical silencing (in percentage of the initial spike number) at different laminar locations plotted against the horizontal distance away from the injection site. n = 3. Error bar indicates SD. C, Percentage change in evoked spike number and bandwidth of multiunit spike TRF in the MGBv. n = 3. Error bar indicates SD. D, Excitatory TRFs of three example cells recorded in the silenced A1. Note that, in the “L5 silenced” neuron, spontaneous excitatory currents were observed in some trials. Color map depicts the average peak amplitude of excitatory current over three trials. Color scale (from left to right): 40, 50, 40 pA for maximum. Enlarged traces (to the best-frequency tone at 70 dB) in the insets are to show response temporal profiles. E, Summary of excitatory onset latency for IB neurons in the normal A1, L5 active neurons in the silenced A1, L4 neurons in the normal and silenced A1. F, Summary of BW20 of excitatory TRF. ***p < 0.001, two-sample t test with unequal variance. G, Summary of half-peak duration of CF-tone-evoked excitatory response. One-way ANOVA (F = 21.8, p = 2.2 × 10⁻⁷) and Scheffé's test (*p < 0.001). H, Tone-evoked excitatory responses (at a level of 20 dB above the intensity threshold) in the same neuron before and after cortical silencing. Color map depicts the peak response amplitude. Color scale: 100, 60, 40 pA for maximum. I, Summary of onset latencies of CF-tone-evoked excitatory responses before and after cortical silencing for active (putative IB; act IB) neurons and silenced (putative RS; sil RS) neurons. One-way ANOVA (F = 8.8, p = 0.07) and Scheffé's test (*p < 0.05). J, Summary of BW20 of excitatory TRF. One-way ANOVA (F = 18.8, p = 6.2 × 10⁻⁴) and Scheffé's test (**p < 0.01). K, Summary of half-peak duration of CF-tone-evoked excitatory response. One-way ANOVA (F = 18.8, p = 6.2 × 10⁻⁴) and Scheffé's test (**p < 0.01).
In a few experiments, we were able to examine excitatory responses in the same cell before and after injecting the muscimol mixture. This allowed us to identify cell type according to the response and tuning properties before cortical silencing. As shown in Figure 5H (left), the excitatory responses of a putative RS neuron (based on a narrow range of excitatory input) were completely silenced after cortical silencing. In contrast, the excitatory responses of a putative IB neuron, which exhibited a much broader range of excitation, were retained after cortical silencing, although the amplitudes became smaller (Fig. 5H, middle). In addition, the temporal duration of its excitatory response was apparently reduced (Fig. 5H, middle, inset). The change of excitatory responses in an L4 neuron was similar to the putative IB neuron except that the temporal duration of excitation was not dramatically reduced (Fig. 5H, right). Notably, the frequency range of its excitatory responses was not significantly changed, consistent with previous reports (Liu et al., 2007; Zhou et al., 2012). We had successfully recorded from eight L5 cells before and after cortical silencing. In four of them (“sil”), excitatory responses were completely eliminated after cortical silencing, whereas in the other four cells (“act”) responses were retained although reduced in amplitude. The excitatory responses of the silenced cells exhibited significantly longer onset latencies (Fig. 5I), narrower frequency ranges (Fig. 5J), and much shorter temporal durations (Fig. 5K) compared with the active cells. These data strongly suggest that the silenced cells were RS neurons while the active cells were IB neurons. The response onset latency of the active cells did not change after cortical silencing (Fig. 5I), supporting the notion that the earliest excitatory response in IB neurons is attributable to thalamocortical input. The response frequency range did not change either (Fig. 5J), indicating that the broad tuning of IB neurons can be attributed initially to a broad thalamocortical convergence. Finally, the response temporal duration was primarily reduced in the active cells after cortical silencing (Fig. 5K), further supporting the notion that the thalamocortical input is in fact transient and that the long-lasting excitatory response of IB neurons is attributable to the recruitment of intracortical inputs, which collectively are temporally prolonged.
FS neurons in L5
In each of the two cell classes, the onset latency of inhibition was found to be ∼2 ms longer than that of excitation (Fig. 4C), suggesting that the relay of inhibitory input involved at least one more layer of synapses than the early excitatory input. With regard to IB neurons, their inhibitory input could be potentially from local inhibitory neurons innervated by thalamic axons, which would provide disynaptic feedforward inhibition (Wu et al., 2008; Zhou et al., 2010). In L5, parvalbumin-expressing GABAergic neurons account for ∼60% of total inhibitory neurons, and all of them exhibit FS properties (Kawaguchi and Kubota, 1997; Markram et al., 2004; Gonchar et al., 2007). By identifying FS cells, we have a high chance of assaying inhibitory neurons, although not all inhibitory neurons have FS properties and some excitatory neurons may also exhibit FS properties. Using recording pipettes with small tips, we specifically searched and recorded from L5 FS neurons, which were identified by their stereotyped narrow spike waveforms (Swadlow, 1989; Atencio and Schreiner, 2008; Wu et al., 2008; Liu et al., 2009). To compare the spike and subthreshold TRFs of FS neurons, we made whole-cell current-clamp recording after identifying the cell type in the cell-attached mode. Robust spike TRFs were observed in all the seven successfully recorded FS neurons (Fig. 6A, top as an example). The spikes of the FS neurons displayed a trough-to-peak interval (TPI) of 0.31 ± 0.03 ms (mean ± SD), whereas for pyramidal neurons, it was 0.73 ± 0.17 ms (Fig. 6B). In addition, the trough/peak amplitude ratio was much lower for spikes of FS than pyramidal neurons (1.4 ± 0.1 for FS, 4.0 ± 1.4 for pyramidal; p < 0.001, t test; n = 8 and 14, respectively). FS neurons could also fire bursts in response to tones, but different from IB neurons, the amplitude of FS cell spikes within a burst did not reduce over time (Fig. 6A, top, inset). The ratio of the second spike amplitude over the first spike amplitude was 0.96 ± 0.02 for FS neurons and 0.78 ± 0.07 for IB neurons (p < 0.001, t test; n = 8 and 14, respectively). These electrophysiological signatures allowed a reliable separation of FS cells from pyramidal cells. Furthermore, the reconstructed morphologies of FS cells (Fig. 6C) indicate that they had non-pyramidal cell morphologies with short dendrites extending radially. Previously in the cat auditory cortex, several types of non-pyramidal (inhibitory) neurons have been described, including multipolar, Martinotti, and bipolar cells (Winer and Prieto, 2001). Our reconstructed FS cell morphologies are consistent with those of multipolar inhibitory neurons (Winer and Prieto, 2001) and also the known dendritic morphologies of parvalbumin-expressing inhibitory neurons (Kawaguchi and Kubota, 1997; Markram et al., 2004).
Figure 6.
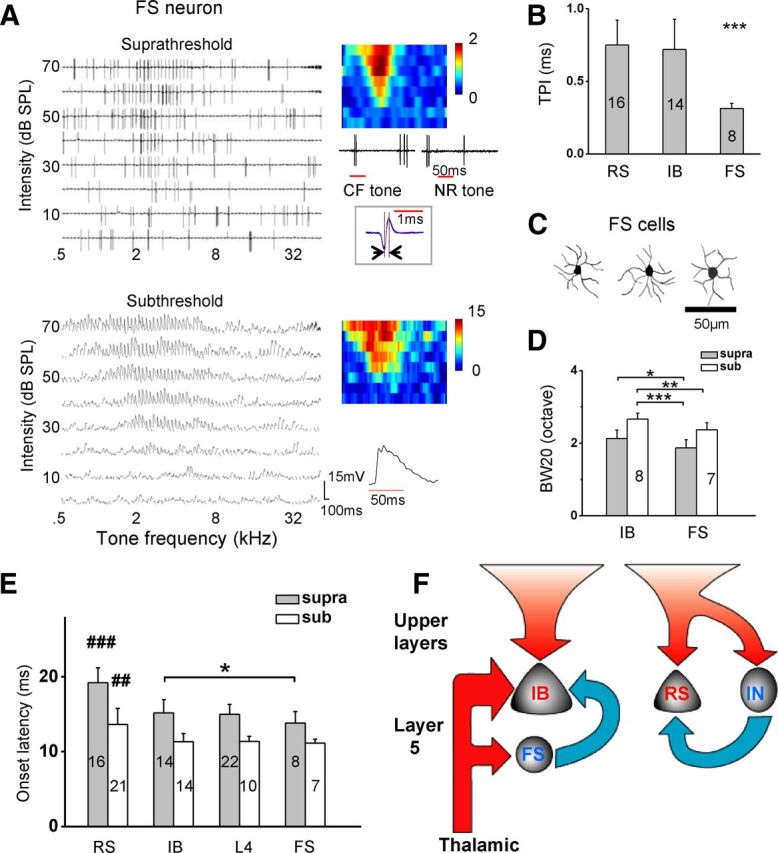
Properties of FS neurons in L5 and potential circuits. A, Sequential cell-attached and current-clamp recordings from an FS neuron. Top, Spike TRF (one trial) recorded in the cell-attached mode. Color map is the averaged spike TRF over seven trials. Inset, Example spike response traces to the CF tone and a tone outside the TRF. Note that the spike amplitude did not reduce within a burst. Boxed are 50 superimposed spike waveforms. Note that the spike shape is much narrower than that of pyramidal cells. The TPI was 0.3 ms in this FS neuron. Bottom, Its subthreshold TRF recorded in the current-clamp mode. B, Summary of TPI of spike waveform for RS, IB, and FS neurons. One-way ANOVA (F = 18.8, p = 6.2 × 10⁻⁴) and Scheffé's test (***p < 0.001). C, Dendritic morphologies of three reconstructed L5 FS neurons. D, Average bandwidths of spike and subthreshold TRFs for IB and FS neurons in the sequential cell-attached and current-clamp recordings. *p < 0.05, **p < 0.01, ***p < 0.001, two-sample t test with unequal variance. E, Comparison of onset latencies of spike and subthreshold depolarization responses among cell classes. One-way ANOVA (F = 26.5, p = 8.6 × 10⁻¹¹ for spike latency; F = 9.4, p = 5.3 × 10⁻⁵ for subthreshold latency) and Scheffé's test (##p < 0.01; ###p < 0.001). *p < 0.05, two-sample t test with equal variance between IB and FS spike latency. F, A model for L5 circuits. IB neurons receive direct thalamic input and feedforward inhibitory input from L5 FS inhibitory neurons, as well as polysynaptic excitatory input from upper layers and possibly within L5. RS neurons receive polysynaptic excitation from upper layers and possibly within L5. Their inhibitory input is likely from interneurons (IN) other than FS neurons, which are not directly driven by thalamic input. The size of arrow depicts the tuning broadness of the corresponding input. Red arrow represents excitatory input, and blue arrow represents inhibitory input.
As summarized in Figure 6D (gray), FS neurons were significantly more narrowly tuned than IB neurons, attributable at least partially to the fact that FS neurons receive a narrower range of excitatory input than IB neurons (Fig. 6D, white). Importantly, the frequency range of spike response of FS neurons was much narrower compared with that of excitatory input to IB neurons (Fig. 6D), indicating that these putative inhibitory neurons are potentially capable of providing the inhibition more narrowly tuned than excitation to IB neurons. Finally, the onset latency of depolarization response of FS neurons was similar to IB and L4 pyramidal neurons (Fig. 6E, white), suggesting that these cells may also receive direct thalamic input. Noticeably, the latency of spike response of FS neurons was significantly shorter than IB neurons (Fig. 6E, gray). This result indicates that the generation of evoked spikes in FS neurons is faster than in IB neurons. Therefore, these FS neurons are capable of providing feedforward inhibitory input to IB neurons.
Discussion
Differential frequency selectivity of pyramidal neurons in L5
The two types of L5 pyramidal neuron (IB and RS) have been categorized in slice recording studies based on their distinctive morphological and biophysical properties. Anatomical studies suggest that IB neurons contribute to corticofugal projections, whereas RS neurons contribute to callosal and corticostriatal connections. However, because of the technical difficulties in identifying different cortical neurons in vivo, how auditory information is processed in these two types of L5 pyramidal neuron remains essentially unknown. Although several studies have shown that L5 contains units that appear more broadly tuned than those in middle or superficial layers (Abeles and Goldstein, 1970; Volkov and Galazjuk, 1991; Turner et al., 2005; Wallace and Palmer, 2008; Atencio and Schreiner, 2010), the type of recorded neurons has not been well defined. Because corticofugal projections may play a role in modulating subcortical processing, understanding the processing properties of IB neurons will generate important insights into the function of these feedback projections. In this study, the application of cell-attached recordings allowed us to record well-isolated single-unit spikes specifically from the patched neuron (Wu et al., 2008; Zhou et al., 2010). The sequential membrane breaking to form the whole-cell configuration then allowed the intracellular labeling of the recorded neurons. Our morphological and electrophysiological data are mostly consistent with the previous results. We are thus able to conclude that IB neurons possess unusually broad frequency tunings, whereas RS neurons show normally sized TRFs comparable with those of L4 pyramidal cells. The different frequency tuning and response temporal properties of IB and RS neurons, together with their distinct long-range targets, suggest that they may play different roles in the transfer of auditory information.
Broadly tuned excitation with narrowly tuned inhibition
Among pyramidal neurons across different layers of the A1, the IB neuron appears to possess the broadest spike TRF, or the weakest frequency selectivity. Its receptive field is even broader than that of FS inhibitory neurons. Besides the wide spectral range of excitation, another important factor contributing to the broad tuning of IB neurons is that their inhibitory input is more narrowly tuned than excitatory input. This seems a peculiar scenario of excitatory–inhibitory interplay, different from previously proposed “balanced inhibition” and “lateral inhibition” models. Intracellular recording studies often reported approximately balanced excitation and inhibition underlying cortical TRFs (Wehr and Zador, 2003; Zhang et al., 2003; Tan et al., 2004; Wu et al., 2008; Tan and Wehr, 2009; Dorrn et al., 2010; Sun et al., 2010; Zhou et al., 2010). The balance is characterized by similar spectral ranges of excitation and inhibition as well as a covariation of excitatory and inhibitory response amplitudes. Balanced or co-tuned inhibition sharpens frequency tuning through the iceberg effect (Wehr and Zador, 2003). On a finer scale, the shape of inhibitory tuning is broader than excitatory tuning in both L4 pyramidal cells and L5 RS neurons (Fig. 3D; Wu et al., 2008; Sun et al., 2010), which can lead to a further sharpening of spike response tuning (Wu et al., 2008; L. I. Zhang et al., 2011). Along the ascending auditory pathway, extracellular recordings widely reveal inhibitory sidebands flanking the excitatory TRF (Shamma, 1985; Ding and Voigt, 1997; Sutter et al., 1999; Zhang et al., 2003; Popescu and Polley, 2010; Sadagopan and Wang, 2010; Pollak et al., 2011). The sidebands have often been interpreted as inhibition possessing a broader spectral range than excitation (i.e., lateral inhibition). Recently, modeling work has suggested that balanced inhibition and lateral inhibition can both occur in the same cortical circuit, depending on circuit configurations (Levy and Reyes, 2011). To our knowledge, this study is the first to demonstrate directly that the spectral range of inhibition can in fact be narrower than excitation. Although the broad tuning of IB neurons first originates from a wide range of thalamocortical input, our modeling results demonstrate that inhibition being narrower than excitation leads to a flattened tuning peak, which would further reduce the selectivity of IB neurons. Because there is no difference in E/I ratio between IB and RS neurons (Fig. 4D), the broad tuning of IB neurons cannot be further attributed to relatively weak inhibition. Our results highlight the complexity of cortical circuits as well as the notion that the detailed tuning relationship between excitation and inhibition is cell-type dependent.
Potential feedforward circuits in L5
Previously whether L5 neurons receive direct thalamic input has not been conclusively tested. Some supporting evidence was given by the earliest sensory-evoked spike responses occurring in some L5 cells (de Kock et al., 2007; Wallace and Palmer, 2008) and seemingly monosynaptic responses in some IB neurons evoked by electrically stimulating thalamocortical tracts in slice preparations (Hefti and Smith, 2000). However, short response delays are not necessarily indicative of monosynaptic connections, because there is evidence that thalamic axons projecting to different layers have different conduction velocities (Jones, 1985; Steriade et al., 1997; Huang and Winer, 2000). In this study, the analysis of excitatory synaptic responses before and after cortical silencing in the same cell more convincingly demonstrates that IB neurons receive direct thalamic input, whereas RS neurons do not. In addition, based on the onset latency of spike responses, thalamic afferents appear to directly excite IB neurons without the need of intracortical inputs. Nevertheless, the temporally prolonged intracortical inputs facilitate the bursting firing of IB neurons. The frequency range of thalamic input to IB neurons is as broad as their total excitatory input (Fig. 5J), indicating that the broad thalamocortical convergence onto IB neurons (which is broader than that onto L4 pyramidal cells) fundamentally determines their exceptionally broad tuning. The broad thalamocortical convergence is consistent with the morphological feature of IB neurons, which have large dendritic fields (Fig. 2F; Hefti and Smith, 2000).
A widely observed temporal feature of cortical responses, i.e., the stereotyped sequence of excitation followed by inhibition (Wehr and Zador, 2003; Zhang et al., 2003; Tan et al., 2004), also exists in L5. The brief delay of inhibition relative to excitation (Fig. 4C) suggests a feedforward circuit at least for the early input to IB as well as RS neurons (Fig. 6F). IB neurons receive excitation from an unusually broad range of thalamic afferents, which drives early spiking of these neurons. The transiency of thalamic input but the temporal broadness of summed excitation to IB neurons suggests that these cells receive late prolonged inputs relayed intracortically from various layers. This notion is supported by the in vitro results of mapping intracortical connectivity with glutamate uncaging methods (Briggs and Callaway, 2005; Yu et al., 2008; Llano and Sherman, 2009; Qiu et al., 2011; Jacob et al., 2012). Glutamate uncaging experiments also show that L5 pyramidal neurons receive inhibitory input predominantly from neurons within L5 (Llano and Sherman, 2009). We found that putative FS inhibitory neurons receive a narrower range of thalamic input than IB neurons (Fig. 6F). Because they exhibit more narrowly tuned TRFs and earlier evoked spikes than IB neurons, these FS neurons are capable of providing fast feedforward inhibition to IB neurons that is more narrowly tuned than excitation. Different from IB neurons, RS neurons do not receive direct thalamic input. Instead, they receive polysynaptic excitatory inputs from upper 1ayers and possibly from other RS neurons in L5 (Hefti and Smith, 2000; Llano and Sherman, 2009; Jacob et al., 2012). Because inhibition in RS neurons is much more delayed compared with spiking of L5 FS neurons (Fig. 6E), the inhibitory neurons innervating RS neurons are likely other types of inhibitory cells that are driven by intracortical input (Fig. 6F).
Functional implications
The functional dichotomy in L5 suggests two distinct streams of auditory processing, with their outputs sent to different targets. IB neurons send signals to higher-order thalamic nuclei as well as midbrain and brainstem nuclei, whereas RS neurons send signals to the ipsilateral and contralateral cortex. The spectrally and temporally broad synaptic integration in IB neurons suggests possible functions of L5 corticofugal projections. First, direct thalamic input and an early onset of spiking enable IB neurons to rapidly send corticofugal signals almost at the same time as cortex starts processing. Second, the temporally prolonged excitation and the intrinsic-bursting property of IB neurons ensure a robust signal. Third, the L5 corticofugal projections in large part terminate in the nontonotopic higher-order thalamic nuclei that connect to higher-order cortices (Winer, 2005). It has been suggested that this cortical–thalamo–cortical route provides an efferent copy of motor commands sent from lower cortical areas to higher cortical areas for the refinement of such commands (Sherman, 2007). Under this functional context, the broad tuning of IB neurons suggests that spectrally precise information may not be as important as a fast relay of information. Finally, we speculate that corticofugal input modulates responses in midbrain and brainstem nuclei in a more general manner, for example, by elevating cell excitability or synchronizing cell activity (Destexhe et al., 1998), which may be important for inducing plasticity during conditioning (Suga and Ma, 2003).
Footnotes
This work was supported by National Institutes of Health Grants DC008983 and the David and Lucile Packard Foundation (L.I.Z.). H.W.T. was supported by grants EY019049 and EY022478 from NIH.
References
- Abeles M, Goldstein MH., Jr Functional architecture in cat primary auditory cortex: columnar organization and organization according to depth. J Neurophysiol. 1970;33:172–187. doi: 10.1152/jn.1970.33.1.172. [DOI] [PubMed] [Google Scholar]
- Agmon A, Connors BW. Correlation between intrinsic firing patterns and thalamocortical synaptic responses of neurons in mouse barrel cortex. J Neurosci. 1992;12:319–329. doi: 10.1523/JNEUROSCI.12-01-00319.1992. [DOI] [PMC free article] [PubMed] [Google Scholar]
- Atencio CA, Schreiner CE. Spectrotemporal processing differences between auditory cortical fast-spiking and regular-spiking neurons. J Neurosci. 2008;28:3897–3910. doi: 10.1523/JNEUROSCI.5366-07.2008. [DOI] [PMC free article] [PubMed] [Google Scholar]
- Atencio CA, Schreiner CE. Laminar diversity of dynamic sound processing in cat primary auditory cortex. J Neurophysiol. 2010;103:192–205. doi: 10.1152/jn.00624.2009. [DOI] [PMC free article] [PubMed] [Google Scholar]
- Borg-Graham LJ, Monier C, Frégnac Y. Visual input evokes transient and strong shunting inhibition in visual cortical neurons. Nature. 1998;393:369–373. doi: 10.1038/30735. [DOI] [PubMed] [Google Scholar]
- Bourassa J, Pinault D, Deschênes M. Corticothalamic projections from the cortical barrel field to the somatosensory thalamus in rats: a single-fibre study using biocytin as an anterograde tracer. Eur J Neurosci. 1995;7:19–30. doi: 10.1111/j.1460-9568.1995.tb01016.x. [DOI] [PubMed] [Google Scholar]
- Briggs F, Callaway EM. Laminar patterns of local excitatory input to layer 5 neurons in macaque primary visual cortex. Cereb Cortex. 2005;15:479–488. doi: 10.1093/cercor/bhh154. [DOI] [PMC free article] [PubMed] [Google Scholar]
- Cardin JA, Palmer LA, Contreras D. Stimulus feature selectivity in excitatory and inhibitory neurons in primary visual cortex. J Neurosci. 2007;27:10333–10344. doi: 10.1523/JNEUROSCI.1692-07.2007. [DOI] [PMC free article] [PubMed] [Google Scholar]
- Chagnac-Amitai Y, Luhmann HJ, Prince DA. Burst generating and regular spiking layer 5 pyramidal neurons of rat neocortex have different morphological features. J Comp Neurol. 1990;296:598–613. doi: 10.1002/cne.902960407. [DOI] [PubMed] [Google Scholar]
- Connors BW, Gutnick MJ, Prince DA. Electrophysiological properties of neocortical neurons in vitro. J Neurophysiol. 1982;48:1302–1320. doi: 10.1152/jn.1982.48.6.1302. [DOI] [PubMed] [Google Scholar]
- Cudeiro J, Sillito AM. Looking back: corticothalamic feedback and early visual processing. Trends Neurosci. 2006;29:298–306. doi: 10.1016/j.tins.2006.05.002. [DOI] [PubMed] [Google Scholar]
- de Kock CP, Bruno RM, Spors H, Sakmann B. Layer- and cell-type-specific suprathreshold stimulus representation in rat primary somatosensory cortex. J Physiol. 2007;581:139–154. doi: 10.1113/jphysiol.2006.124321. [DOI] [PMC free article] [PubMed] [Google Scholar]
- Destexhe A, Contreras D, Steriade M. Mechanisms underlying the synchronizing action of corticothalamic feedback through inhibition of thalamic relay cells. J Neurophysiol. 1998;79:999–1016. doi: 10.1152/jn.1998.79.2.999. [DOI] [PubMed] [Google Scholar]
- Ding J, Voigt HF. Intracellular response properties of units in the dorsal cochlear nucleus of unanesthetized decerebrate gerbil. J Neurophysiol. 1997;77:2549–2572. doi: 10.1152/jn.1997.77.5.2549. [DOI] [PubMed] [Google Scholar]
- Dorrn AL, Yuan K, Barker AJ, Schreiner CE, Froemke RC. Developmental sensory experience balances cortical excitation and inhibition. Nature. 2010;465:932–936. doi: 10.1038/nature09119. [DOI] [PMC free article] [PubMed] [Google Scholar]
- Games KD, Winer JA. Layer V in rat auditory cortex: projections to the inferior colliculus and contralateral cortex. Hear Res. 1988;34:1–25. doi: 10.1016/0378-5955(88)90047-0. [DOI] [PubMed] [Google Scholar]
- Gonchar Y, Wang Q, Burkhalter A. Multiple distinct subtypes of GABAergic neurons in mouse visual cortex identified by triple immunostaining. Front Neuroanat. 2007;1:3. doi: 10.3389/neuro.05.003.2007. [DOI] [PMC free article] [PubMed] [Google Scholar]
- Guillery RW. Anatomical evidence concerning the role of the thalamus in corticocortical communication: a brief review. J Anat. 1995;187:583–592. [PMC free article] [PubMed] [Google Scholar]
- Hattox AM, Nelson SB. Layer V neurons in mouse cortex projecting to different targets have distinct physiological properties. J Neurophysiol. 2007;98:3330–3340. doi: 10.1152/jn.00397.2007. [DOI] [PubMed] [Google Scholar]
- Hefti BJ, Smith PH. Anatomy, physiology, and synaptic responses of rat layer V auditory cortical cells and effects of intracellular GABA(A) blockade. J Neurophysiol. 2000;83:2626–2638. doi: 10.1152/jn.2000.83.5.2626. [DOI] [PubMed] [Google Scholar]
- Hines M. NEURON: a program for simulation of nerve equations. In: Eeckman FH, editor. Neural systems: analysis and modeling. Norwell, MA: Kluwer Academic Publishers; 1993. pp. 127–136. [Google Scholar]
- Huang CL, Winer JA. Auditory thalamocortical projections in the cat: laminar and areal patterns of input. J Comp Neurol. 2000;427:302–331. doi: 10.1002/1096-9861(20001113)427:2<302::aid-cne10>3.0.co;2-j. [DOI] [PubMed] [Google Scholar]
- Jacob V, Petreanu L, Wright N, Svoboda K, Fox K. Regular spiking and intrinsic bursting pyramidal cells show orthogonal forms of experience-dependent plasticity in layer V of barrel cortex. Neuron. 2012;73:391–404. doi: 10.1016/j.neuron.2011.11.034. [DOI] [PMC free article] [PubMed] [Google Scholar]
- Jones EG. The thalamus. New York: Plenum; 1985. [Google Scholar]
- Kasper EM, Larkman AU, Lübke J, Blakemore C. Pyramidal neurons in layer 5 of the rat visual cortex. I. Correlation among cell morphology, intrinsic electrophysiological properties, and axon targets. J Comp Neurol. 1994;339:459–474. doi: 10.1002/cne.903390402. [DOI] [PubMed] [Google Scholar]
- Kawaguchi Y, Kubota Y. GABAergic cell subtypes and their synaptic connections in rat frontal cortex. Cereb Cortex. 1997;7:476–486. doi: 10.1093/cercor/7.6.476. [DOI] [PubMed] [Google Scholar]
- Kelly JP, Wong D. Laminar connections of the cat's auditory cortex. Brain Res. 1981;212:1–15. doi: 10.1016/0006-8993(81)90027-5. [DOI] [PubMed] [Google Scholar]
- Khibnik LA, Cho KK, Bear MF. Relative contribution of feedforward excitatory connections to expression of ocular dominance plasticity in layer 4 of visual cortex. Neuron. 2010;66:493–500. doi: 10.1016/j.neuron.2010.04.012. [DOI] [PMC free article] [PubMed] [Google Scholar]
- Lakatos P, Chen CM, O'Connell MN, Mills A, Schroeder CE. Neuronal oscillations and multisensory interaction in primary auditory cortex. Neuron. 2007;53:279–292. doi: 10.1016/j.neuron.2006.12.011. [DOI] [PMC free article] [PubMed] [Google Scholar]
- Larkman A, Mason A. Correlations between morphology and electrophysiology of pyramidal neurons in slices of rat visual cortex. I. Establishment of cell classes. J Neurosci. 1990;10:1407–1414. doi: 10.1523/JNEUROSCI.10-05-01407.1990. [DOI] [PMC free article] [PubMed] [Google Scholar]
- Levy RB, Reyes AD. Coexistence of lateral and co-tuned inhibitory configurations in cortical networks. PLoS Comput Biol. 2011;7:e1002161. doi: 10.1371/journal.pcbi.1002161. [DOI] [PMC free article] [PubMed] [Google Scholar]
- Liu BH, Wu GK, Arbuckle R, Tao HW, Zhang LI. Defining cortical frequency tuning with recurrent excitatory circuitry. Nat Neurosci. 2007;10:1594–1600. doi: 10.1038/nn2012. [DOI] [PMC free article] [PubMed] [Google Scholar]
- Liu BH, Li P, Li YT, Sun YJ, Yanagawa Y, Obata K, Zhang LI, Tao HW. Visual receptive field structure of cortical inhibitory neurons revealed by two-photon imaging guided recording. J Neurosci. 2009;29:10520–10532. doi: 10.1523/JNEUROSCI.1915-09.2009. [DOI] [PMC free article] [PubMed] [Google Scholar]
- Liu BH, Li YT, Ma WP, Pan CJ, Zhang LI, Tao HW. Broad inhibition sharpens orientation selectivity by expanding input dynamic range in mouse simple cells. Neuron. 2011;71:542–554. doi: 10.1016/j.neuron.2011.06.017. [DOI] [PMC free article] [PubMed] [Google Scholar]
- Liu Y, Zhang LI, Tao HW. Heterosynaptic scaling of developing GABAergic synapses: dependence on glutamatergic input and developmental stage. J Neurosci. 2007;27:5301–5312. doi: 10.1523/JNEUROSCI.0376-07.2007. [DOI] [PMC free article] [PubMed] [Google Scholar]
- Llano DA, Sherman SM. Differences in intrinsic properties and local network connectivity of identified layer 5 and layer 6 adult mouse auditory corticothalamic neurons support a dual corticothalamic projection hypothesis. Cereb Cortex. 2009;19:2810–2826. doi: 10.1093/cercor/bhp050. [DOI] [PMC free article] [PubMed] [Google Scholar]
- Markram H, Lübke J, Frotscher M, Roth A, Sakmann B. Physiology and anatomy of synaptic connections between thick tufted pyramidal neurones in the developing rat neocortex. J Physiol. 1997;500:409–440. doi: 10.1113/jphysiol.1997.sp022031. [DOI] [PMC free article] [PubMed] [Google Scholar]
- Markram H, Toledo-Rodriguez M, Wang Y, Gupta A, Silberberg G, Wu C. Interneurons of the neocortical inhibitory system. Nat Rev Neurosci. 2004;5:793–807. doi: 10.1038/nrn1519. [DOI] [PubMed] [Google Scholar]
- Moriizumi T, Hattori T. Pyramidal cells in rat temporoauditory cortex project to both striatum and inferior colliculus. Brain Res Bull. 1991;27:141–144. doi: 10.1016/0361-9230(91)90297-w. [DOI] [PubMed] [Google Scholar]
- Ojima H, Honda CN, Jones EG. Characteristics of intracellularly injected infragranular pyramidal neurons in cat primary auditory cortex. Cereb Cortex. 1992;2:197–216. doi: 10.1093/cercor/2.3.197. [DOI] [PubMed] [Google Scholar]
- Pollak GD, Xie R, Gittelman JX, Andoni S, Li N. The dominance of inhibition in the inferior colliculus. Hear Res. 2011;274:27–39. doi: 10.1016/j.heares.2010.05.010. [DOI] [PMC free article] [PubMed] [Google Scholar]
- Popescu MV, Polley DB. Monaural deprivation disrupts development of binaural selectivity in auditory midbrain and cortex. Neuron. 2010;65:718–731. doi: 10.1016/j.neuron.2010.02.019. [DOI] [PMC free article] [PubMed] [Google Scholar]
- Qiu S, Anderson CT, Levitt P, Shepherd GM. Circuit-specific intracortical hyperconnectivity in mice with deletion of the autism-associated Met receptor tyrosine kinase. J Neurosci. 2011;31:5855–5864. doi: 10.1523/JNEUROSCI.6569-10.2011. [DOI] [PMC free article] [PubMed] [Google Scholar]
- Rüttgers K, Aschoff A, Friauf E. Commissural connections between the auditory cortices of the rat. Brain Res. 1990;509:71–79. doi: 10.1016/0006-8993(90)90310-8. [DOI] [PubMed] [Google Scholar]
- Sadagopan S, Wang X. Contribution of inhibition to stimulus selectivity in primary auditory cortex of awake primates. J Neurosci. 2010;30:7314–7325. doi: 10.1523/JNEUROSCI.5072-09.2010. [DOI] [PMC free article] [PubMed] [Google Scholar]
- Schubert D, Staiger JF, Cho N, Kötter R, Zilles K, Luhmann HJ. Layer-specific intracolumnar and transcolumnar functional connectivity of layer V pyramidal cells in rat barrel cortex. J Neurosci. 2001;21:3580–3592. doi: 10.1523/JNEUROSCI.21-10-03580.2001. [DOI] [PMC free article] [PubMed] [Google Scholar]
- Shamma SA. Speech processing in the auditory system. II: Lateral inhibition and the central processing of speech evoked activity in the auditory nerve. J Acoust Soc Am. 1985;78:1622–1632. doi: 10.1121/1.392800. [DOI] [PubMed] [Google Scholar]
- Sherman SM. The thalamus is more than just a relay. Curr Opin Neurobiol. 2007;17:417–422. doi: 10.1016/j.conb.2007.07.003. [DOI] [PMC free article] [PubMed] [Google Scholar]
- Sherman SM, Guillery RW. The role of the thalamus in the flow of information to the cortex. Philos Trans R Soc Lond B Biol Sci. 2002;357:1695–1708. doi: 10.1098/rstb.2002.1161. [DOI] [PMC free article] [PubMed] [Google Scholar]
- Steriade M, Jones EG, McCormick DA. Thalamus, Vol I, Organisation and function. Amsterdam: Elsevier Science; 1997. [Google Scholar]
- Stuart G, Spruston N. Determinants of voltage attenuation in neocortical pyramidal neuron dendrites. J Neurosci. 1998;18:3501–3510. doi: 10.1523/JNEUROSCI.18-10-03501.1998. [DOI] [PMC free article] [PubMed] [Google Scholar]
- Suga N, Ma X. Multiparametric corticofugal modulation and plasticity in the auditory system. Nat Rev Neurosci. 2003;4:783–794. doi: 10.1038/nrn1222. [DOI] [PubMed] [Google Scholar]
- Sun YJ, Wu GK, Liu BH, Li P, Zhou M, Xiao Z, Tao HW, Zhang LI. Fine-tuning of pre-balanced excitation and inhibition during auditory cortical development. Nature. 2010;465:927–931. doi: 10.1038/nature09079. [DOI] [PMC free article] [PubMed] [Google Scholar]
- Sutter ML, Schreiner CE, McLean M, O'connor KN, Loftus WC. Organization of inhibitory frequency receptive fields in cat primary auditory cortex. J Neurophysiol. 1999;82:2358–2371. doi: 10.1152/jn.1999.82.5.2358. [DOI] [PubMed] [Google Scholar]
- Swadlow HA. Efferent neurons and suspected interneurons in S-1 vibrissa cortex of the awake rabbit: receptive fields and axonal properties. J Neurophysiol. 1989;62:288–308. doi: 10.1152/jn.1989.62.1.288. [DOI] [PubMed] [Google Scholar]
- Tan AY, Wehr M. Balanced tone-evoked synaptic excitation and inhibition in mouse auditory cortex. Neuroscience. 2009;163:1302–1315. doi: 10.1016/j.neuroscience.2009.07.032. [DOI] [PubMed] [Google Scholar]
- Tan AY, Zhang LI, Merzenich MM, Schreiner CE. Tone-evoked excitatory and inhibitory synaptic conductances of primary auditory cortex neurons. J Neurophysiol. 2004;92:630–643. doi: 10.1152/jn.01020.2003. [DOI] [PubMed] [Google Scholar]
- Turner JG, Hughes LF, Caspary DM. Divergent response properties of layer-V neurons in rat primary auditory cortex. Hear Res. 2005;202:129–140. doi: 10.1016/j.heares.2004.09.011. [DOI] [PubMed] [Google Scholar]
- Villa AE, Rouiller EM, Simm GM, Zurita P, de Ribaupierre Y, de Ribaupierre F. Corticofugal modulation of the information processing in the auditory thalamus of the cat. Exp Brain Res. 1991;86:506–517. doi: 10.1007/BF00230524. [DOI] [PubMed] [Google Scholar]
- Volkov IO, Galazjuk AV. Formation of spike response to sound tones in cat auditory cortex neurons: interaction of excitatory and inhibitory effects. Neuroscience. 1991;43:307–321. doi: 10.1016/0306-4522(91)90295-y. [DOI] [PubMed] [Google Scholar]
- Wallace MN, Palmer AR. Laminar differences in the response properties of cells in the primary auditory cortex. Exp Brain Res. 2008;184:179–191. doi: 10.1007/s00221-007-1092-z. [DOI] [PubMed] [Google Scholar]
- Weedman DL, Ryugo DK. Pyramidal cells in primary auditory cortex project to cochlear nucleus in rat. Brain Res. 1996;706:97–102. doi: 10.1016/0006-8993(95)01201-x. [DOI] [PubMed] [Google Scholar]
- Wehr M, Zador AM. Balanced inhibition underlies tuning and sharpens spike timing in auditory cortex. Nature. 2003;426:442–446. doi: 10.1038/nature02116. [DOI] [PubMed] [Google Scholar]
- Winer JA. Decoding the auditory corticofugal systems. Hear Res. 2005;207:1–9. doi: 10.1016/j.heares.2005.06.007. [DOI] [PubMed] [Google Scholar]
- Winer JA, Prieto JJ. Layer V in cat primary auditory cortex (AI): cellular architecture and identification of projection neurons. J Comp Neurol. 2001;434:379–412. doi: 10.1002/cne.1183. [DOI] [PubMed] [Google Scholar]
- Winer JA, Larue DT, Diehl JJ, Hefti BJ. Auditory cortical projections to the cat inferior colliculus. J Comp Neurol. 1998;400:147–174. [PubMed] [Google Scholar]
- Wu GK, Li P, Tao HW, Zhang LI. Nonmonotonic synaptic excitation and imbalanced inhibition underlying cortical intensity tuning. Neuron. 2006;52:705–715. doi: 10.1016/j.neuron.2006.10.009. [DOI] [PMC free article] [PubMed] [Google Scholar]
- Wu GK, Arbuckle R, Liu BH, Tao HW, Zhang LI. Lateral sharpening of cortical frequency tuning by approximately balanced inhibition. Neuron. 2008;58:132–143. doi: 10.1016/j.neuron.2008.01.035. [DOI] [PMC free article] [PubMed] [Google Scholar]
- Wu GK, Tao HW, Zhang LI. From elementary synaptic circuits to information processing in primary auditory cortex. Neurosci Biobehav Rev. 2011;35:2094–2104. doi: 10.1016/j.neubiorev.2011.05.004. [DOI] [PMC free article] [PubMed] [Google Scholar]
- Yan J, Suga N. Corticofugal modulation of time-domain processing of biosonar information in bats. Science. 1996;273:1100–1103. doi: 10.1126/science.273.5278.1100. [DOI] [PubMed] [Google Scholar]
- Yu J, Anderson CT, Kiritani T, Sheets PL, Wokosin DL, Wood L, Shepherd GM. Local-circuit phenotypes of layer 5 neurons in motor-frontal cortex of YFP-H mice. Front Neural Circuits. 2008;2:6. doi: 10.3389/neuro.04.006.2008. [DOI] [PMC free article] [PubMed] [Google Scholar]
- Zhang LI, Tan AY, Schreiner CE, Merzenich MM. Topography and synaptic shaping of direction selectivity in primary auditory cortex. Nature. 2003;424:201–205. doi: 10.1038/nature01796. [DOI] [PubMed] [Google Scholar]
- Zhang LI, Zhou Y, Tao HW. Perspectives on: information and coding in mammalian sensory physiology: inhibitory synaptic mechanisms underlying functional diversity in auditory cortex. J Gen Physiol. 2011;138:311–320. doi: 10.1085/jgp.201110650. [DOI] [PMC free article] [PubMed] [Google Scholar]
- Zhang M, Liu Y, Wang SZ, Zhong W, Liu BH, Tao HW. Functional elimination of excitatory feedforward inputs underlies developmental refinement of visual receptive fields in zebrafish. J Neurosci. 2011;31:5460–5469. doi: 10.1523/JNEUROSCI.6220-10.2011. [DOI] [PMC free article] [PubMed] [Google Scholar]
- Zhang Y, Suga N. Corticofugal amplification of subcortical responses to single tone stimuli in the mustached bat. J Neurophysiol. 1997;78:3489–3492. doi: 10.1152/jn.1997.78.6.3489. [DOI] [PubMed] [Google Scholar]
- Zhang Y, Suga N, Yan J. Corticofugal modulation of frequency processing in bat auditory system. Nature. 1997;387:900–903. doi: 10.1038/43180. [DOI] [PubMed] [Google Scholar]
- Zhou Y, Liu BH, Wu GK, Kim YJ, Xiao Z, Tao HW, Zhang LI. Preceding inhibition silences layer 6 neurons in auditory cortex. Neuron. 2010;65:706–717. doi: 10.1016/j.neuron.2010.02.021. [DOI] [PMC free article] [PubMed] [Google Scholar]
- Zhou Y, Mesik L, Sun YJ, Liang F, Xiao Z, Tao HW, Zhang LI. Generation of spike latency tuning by thalamocortical circuits in auditory cortex. J Neurosci. 2012;32:9969–9980. doi: 10.1523/JNEUROSCI.1384-12.2012. [DOI] [PMC free article] [PubMed] [Google Scholar]
- Zhu JJ, Connors BW. Intrinsic firing patterns and whisker-evoked synaptic responses of neurons in the rat barrel cortex. J Neurophysiol. 1999;81:1171–1183. doi: 10.1152/jn.1999.81.3.1171. [DOI] [PubMed] [Google Scholar]