

Abstract
Single cell network profiling (SCNP) is a multi-parameter flow cytometry based approach that allows for the simultaneous interrogation of intracellular signaling pathways in multiple cell subpopulations within heterogeneous tissues, without the need for individual cell subset isolation. Thus, the technology is extremely well-suited for characterizing the multitude of interconnected signaling pathways and immune cell subpopulations that regulate the function of the immune system. Recently, SCNP was applied to generate a functional map of the healthy human immune cell signaling network by profiling immune signaling pathways downstream of 12 immunomodulators in 7 distinct immune cell subsets within peripheral blood mononuclear cells (PBMCs) from 60 healthy donors. In the study reported here, the degree of inter-donor variation in the magnitude of the immune signaling responses was analyzed. The highest inter-donor differences in immune signaling pathway activity occurred following perturbation of the immune signaling network, rather than in basal signaling. When examining the full panel of immune signaling responses, as one may expect, the overall degree of inter-donor variation was positively correlated (r = 0.727) with the magnitude of node response (i.e. a larger median signaling response was associated with greater inter-donor variation). However, when examining the degree of heterogeneity across cell subpopulations for individual signaling nodes, cell subset specificity in the degree of inter-donor variation was observed for several nodes. For such nodes, relatively weak correlations between inter-donor variation and the magnitude of the response were observed. Further, within the phenotypically distinct subpopulations, a fraction of the immune signaling responses had bimodal response profiles in which (a) only a portion of the cells had elevated phospho-protein levels following modulation and (b) the proportion of responsive cells varied by donor. These data exemplify the application of SCNP to provide a detailed characterization of inter-donor variation in immune signaling pathway activation in a healthy donor cohort. This dataset provides a basis for identifying cell subpopulation specific immune signaling abnormalities in cancer and immune-mediated diseases. Building upon these data in future studies may help inform on disease etiology, maintenance and therapeutic selection.
Keywords: Signal transduction, multi-parameter flow cytometry, systems immunology
Introduction
The human immune system is composed of a complex network of cell types and signaling pathways that, in healthy individuals, interact to provide responses against pathogens and tumor-associated antigens while simultaneously preventing detrimental immune responses to self-antigens [1,2]. Deregulation of immune cell signaling network responses can result in aberrant immune function leading to increased susceptibility to diseases such as cancer, autoimmunity, and chronic infections [3,4]. Traditional immunological studies often focus on the behavior of a specific immune cell subset following isolation from complex tissues such as peripheral blood, lymph nodes, or the spleen. However, because immune responses are governed by a network of distinct cell subtypes, systems-level analyses that measure simultaneously the activity of intracellular signaling networks within multiple immune cell subtypes may provide more clinically relevant insight into the basis of immune-mediated disorders and the effects of therapeutic intervention on the function of the overall immune system.
Single cell network profiling (SCNP) is a flow-cytometry based approach well-suited for investigating how the immune system responds and reacts to external stimuli at a network level. The assay allows for the simultaneous interrogation of modulated signaling activity across signaling pathways in multiple interdependent immune cell subpopulations. SCNP technology has been applied extensively to disease characterization and patient stratification in hematological malignancies such as acute myeloid leukemia (AML) and chronic lymphocytic leukemia (CLL) [5-8].
More recently, SCNP technology was applied to generate a functional map of healthy human immune signaling responses to provide a reference for the identification of signaling abnormalities in pathological conditions such as cancer and autoimmunity. To generate the healthy immune signaling network map, SCNP was used to profile signaling pathways downstream of a panel of 12 immunomodulators (including interferons, interleukins, IgD crosslinking, TLR ligands, and CD40L) in 7 distinct, non-sorted immune cell subpopulations within peripheral blood mononuclear cells (PBMCs) from a cohort of 60 healthy individuals [9]. While a relatively narrow range of response magnitudes was observed for the majority of the signaling nodes measured within the 7 distinct cell subpopulations defined in the healthy immune signaling network mapping, a subset of nodes in distinct cell subpopulations displayed considerable inter-donor variation. A greater understanding of the degree of inter-donor variation in immune signaling responses across healthy individuals is critical for the identification of altered immune signaling responses in cell subsets from diseased donors. In addition, establishing inter-donor variation in immune signaling responses from healthy individuals associated with demographic factors such as age, race, or gender may provide insight into the basis for disparities in the prevalence of immune-mediated disease or response to therapeutics among different demographic donor subgroups.
Here, an in-depth analysis of inter-donor differences in the magnitude of immune signaling responses measured within distinct cells subsets from the healthy donor cohort was performed. The findings presented here have important implications for the characterization of immune signaling abnormalities in pathological conditions such as cancer and autoimmunity.
Materials and methods
PBMC samples
Cryopreserved PBMC samples taken from 60 healthy donors within the Department of Transfusion Medicine, Clinical Center, National Institutes of Health, with institutional review board approval were used in this study. Blood donations from healthy donors, donated for research purposes with informed consent, were collected and processed as described previously [10].
SCNP assay and flow cytometry
The SCNP assay and flow cytometry data acquisition and analysis were performed as previously described [9]. Briefly, cryopreserved PBMC samples were thawed at 37°C and resuspended in RPMI 1640 (1% FBS) before staining with amine aqua viability dye (Invitrogen, Carlsbad, CA). Cells were resuspended in RPMI 1640 (10% FBS), aliquoted to 100,000 cells per condition, and rested for 2 hours at 37°C prior to incubation with modulators at 37°C for 15 minutes. After exposure to modulators, cells were fixed with paraformaldehyde and permeabilized with 100% ice-cold methanol. Methanol permeabilized cells were washed with FACS buffer (PBS, 0.5% BSA, 0.05% NaN3), pelleted, and stained with antibody cocktails containing fluorochrome-conjugated antibodies against phenotypic markers for cell population gating and antibodies against intracellular signaling molecules. Flow cytometry data was acquired using FACS DIVA software (BD Biosciences, San Jose, CA) on two LSRII Flow Cytometers (BD Biosciences, San Jose, CA). Flow cytometry data was analyzed with WinList (Verity House Software, Topsham, ME). For all analyses, dead cells and debris were excluded by forward scatter (FSC), side scatter (SSC), and amine aqua viability dye.
SCNP terminology and metrics
The term “signaling node” refers to a specific protein readout in the presence or absence of a specific modulator. For example, the response to IFN-α stimulation can be measured using p-Stat1 as a readout. This signaling node is designated “IFN-α→p-Stat1”. Each signaling node is measured in each cell subpopulation. The term “signaling response” refers to a specific signaling node measured within a specific cell subpopulation. For each signaling response, the cell subpopulation is noted following the node e.g. “IFN-α→p-Stat1 | B cells”. Two different metrics are utilized in this study to measure the levels of intracellular signaling proteins in either the unmodulated state or in response to modulation. The “Basal” metric is used to measure basal levels of signaling in the resting, unmodulated state. The “Fold” metric is applied to measure the level of a signaling molecule after modulation compared to its level in the basal state. The Equivalent Number of Reference Fluorophores (ERFs), fluorescence measurements calibrated by rainbow calibration particles on each 96-well plate, serve as a basis for all metric calculations [11-13].
The “Basal” and “Fold” metrics were calculated as follows: Basal: log2 [ERF(Unmodulated)/ERF (Autofluorescence)]; Fold: log2 [(ERF (Modulated)/ERF(Unmodulated) + Ph - 1)/Ph]. Where Ph is the percentage of healthy [cleaved PARP (poly ADP-ribose polymerase) negative] cells.
Modulated signaling nodes measured in each of the 7 distinct cell subpopulations were considered responsive if the median Fold (over the 60 donors) was above a threshold level of 0.25 (representing an ~1.2-fold change in modulated levels relative to basal).
Statistical analysis
The interquartile range (IQR), or the distance between the 75th percentile and the 25th percentile, was used as a measure of the inter-donor variation for each signaling node in each immune cell subpopulation. The IQR was selected as a metric because it is robust to outliers or extreme values and does not require an assumption of normal distribution.
The Bimodality Index (BI, [14]) was used to identify and rank bimodal patterns in the fluorescence intensity histograms for the 28 modulated signaling nodes within each of the 7 distinct cell subsets. The BI is defined as Equation 1:
Where π is the proportion of cells in one population, and δ which represents the standardized distance between the two populations is defined as Equation 2:
 |
The parameters π, μ, and σ (the common standard deviation), were estimated from the data using the R mixture-modeling package mixtools [15], assuming 2 clusters (k=2, fast=TRUE), and equal variances (arbvar=FALSE, sdconstr=[“a”,“a”]).
Results
Overall analysis of inter-donor variation in immune signaling responses
Intracellular signaling activity across multiple immune cell subpopulations was analyzed using single cell network profiling (SCNP) as previously described [9]. The phosphorylation status of 8 signaling proteins (Stat1, Stat3, Stat5, Stat6, Akt, S6, Erk, and NF-κB) was measured in response to 12 stimuli (IFN-α, IFN-γ, IL-2, IL-4, IL-6, IL-10, IL-27, anti-IgD, LPS, R848, PMA, and CD40L) in 7 distinct (non-overlapping) immune cell subpopulations (monocytes, B cells, CD3- CD20- lymphocytes (natural killer cell-enriched subpopulation), CD45RA+ helper T cells, CD45RA- helper T cells, CD45RA+ cytotoxic T cells, and CD45RA- cytotoxic T cells) within unsorted PBMC samples from 60 healthy individuals [9].
The Basal metric (Materials and methods) was used to quantify phospho-protein levels in the unmodulated state. As shown in Figure 1, the ranges of the Basal values over the 60 donors for the 8 protein readouts in each of the 7 distinct immune cell subsets were narrow, with the exception of p-Erk which displayed a wider range of Basal values in each of the cell subsets relative to the other phospho-proteins. Notably, the magnitudes of the p-Erk Basal values were also much higher than the Basal values for the other 7 protein readouts. In addition, p-S6 displayed a broad range of Basal values in the monocytes relative to the range of Basal p-S6 values observed in the other cell subsets.
Figure 1.
Basal (unmodulated) signaling ranges over the 60 healthy donors. Box plots are shown for the Basal values (Materials and methods) for the unmodulated signaling nodes within each of the 7 distinct immune cell subpopulations.
To measure changes in the phospho-protein levels in response to extracellular modulation, the Fold metric (Materials and methods) was utilized. For each of the 60 donors, the Fold metric was calculated for all 196 signaling responses (i.e. for 28 modulated signaling nodes measured within the 7 distinct cell subsets, see Materials and methods). The ranges for the Fold values over the 60 healthy donors for each of the signaling responses are shown in Figure 2. To quantify the degree of inter-donor variation for each of the 196 signaling responses, the interquartile range (IQR, see Materials and methods) for the Fold was used. The average IQR value over all signaling responses (0.3) was used as a threshold for defining responses with high inter-donor variation. Notably, all of the signaling responses that showed high inter-donor variation (IQR>0.3) were among the responses that displayed modulated activity (as quantified by the median Fold for the 60 donors) above the threshold level of 0.25 (Figure 3). Thus, as may be expected, applying extracellular stimuli to evoke a robust (i.e. Fold > 0.25) perturbation of the immune signaling network was necessary (but not sufficient) for the detection of inter-donor heterogeneity in signaling responses (IQR > 0.3).
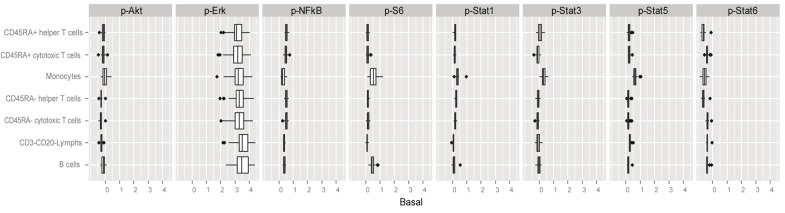
Figure 2.

Modulated signaling response ranges over the 60 healthy donors. Box plots are shown for the Fold values (Materials and methods) for the 28 modulated signaling nodes within each of the 7 distinct immune cell subpopulations. The IL-2→p-Stat5 (red border) and PMA→p-S6 (green border) are highlighted as examples of signaling nodes displaying cell-subset specific high inter-donor variation (see Figure 5 for plots of Fold vs. IQR for these two signaling nodes).
Figure 3.

Fold (median Foldvalue over the 60 donors) isplotted vs. the interquartilerange (IQR) of the Fold for allof the signaling nodes acrosseach of the 7 distinct immunesubpopulations. Thegreen line represents theFold = 0.25 threshold fordefining responsive signalingnodes (measured within eachcell subset). The red linerepresents the IQR = 0.3threshold for defining signalingnodes (measured withineach cell subset) with highinter-donor variation. ThePearson correlation coefficientbetween Fold and IQR, r= 0.727.
Over the 196 signaling responses, the degree of inter-donor variation (IQR) in response magnitude was positively correlated (Pearson r = 0.727) with the magnitude of the response (as quantified by the median Fold) (i.e. the larger the response, the greater the inter-donor variation). An overall analysis of the percentage of signaling responses with high inter-donor heterogeneity within each subpopulation and for each stimulus (Figure 4) demonstrated that the degree of inter-donor variation in the responses differed amongst the different cell subsets and amongst the different immunomodulators tested. Of the 7 cell subpopulations, the four T cell subsets and CD3-CD20- lymphocytes had the highest percentages of signaling responses with high inter-donor variation (Figure 4). Of the modulators, IL-2, PMA, and BCR/LPS, had the highest percentages of signaling responses with high heterogeneity among the 60 donors. In contrast, low inter-donor variation was observed for CD40L, IFN-α, and IFN-γ independently from the cell subsets in which they were measured (Figure 4).
Figure 4.
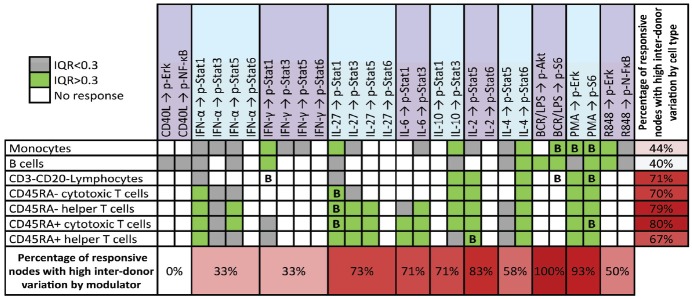
Inter-donor variation in immune signaling responses across the healthy immune cell signaling network. The interquartile range (IQR) for the Fold metric was calculated for each signaling response. Signaling responses with IQRs above 0.3 are shown in green and signaling responses with IQRs below 0.3 are shown in gray. White boxes represent signaling responses that have a median Fold below the threshold level of Fold = 0.25. The percentages in the vertical column indicate the percentage of responsive (Fold > 0.25) signaling nodes with high inter-donor variation (IQR > 0.3) within each cell subpopulation and the percentages in the bottom row indicate the percentage of responsive signaling nodes with high inter-donor variation (IQR > 0.3) for each stimulus. Boxes with a “B” represent responses that showed bimodality (median BI > 1.0).
Cell subset specificity as a basis for inter-donor variation in immune signaling
The degree of inter-donor heterogeneity across the 7 distinct cell subpopulations was examined for each of the 28 modulated signaling nodes, and cell subset specificity in the degree of inter-donor variation was apparent for many signaling nodes (Figure 2). For example, the IL-2→p-Stat5 signaling node (highlighted with the red border in Figure 2) displayed much higher inter-donor heterogeneity in the CD45RA+ helper T cell subset than in the other cell subsets despite moderate Fold values for this signaling node in the CD45RA+ helper T cell subset relative to other cell subsets. Thus, the inter-donor variation in IL-2-induced p-Stat5 responses (as quantified by the IQR) varied with cell subtype and had a relatively weak correlation (r = 0.595, Figure 5A) with the magnitude (median Fold) of the p-Stat5 responses in each cell subtype. Similarly, the PMA→p-S6 signaling node (highlighted with the green border in Figure 2) displayed the highest inter-donor variation in the monocytes and CD45RA+ cytotoxic T cells and the lowest inter-donor variation in the B cells (which showed a median Fold response comparable with the CD45RA+ cytotoxic T cells) and CD3-CD20- lymphocytes. For the PMA→p-S6 signaling node, the IQR did not correlate with the Fold (r = 0.069, Figure 5B).
Figure 5.
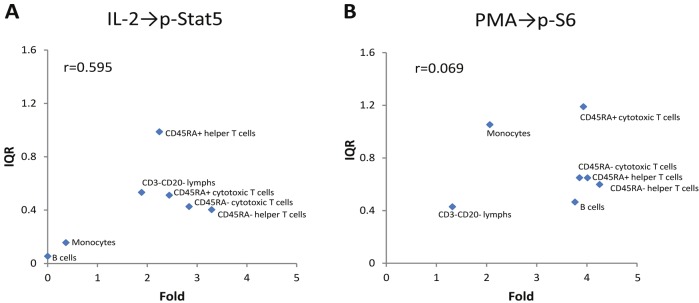
Cell subset specific inter-donor variation in induced immune signaling responses. A) Fold (median Fold value over the 60 donors) is plotted vs. IQR for IL-2-induced p-Stat5 in each of the 7 distinct cell subpopulations. The corresponding box plots for the IL-2→p-Stat5 signaling node are shown in Figure 2 (see red border). B) Fold (median Fold value over the 60 donors) is plotted vs. IQR for PMA-induced p-S6 in each of the 7 distinct cell subpopulations. The corresponding box plots for the PMA→p-S6 signaling node are shown in Figure 2 (see green border).
Cell subpopulation heterogeneity as a basis for inter-donor variation in immune signaling responses
One of the key advantages of utilizing the multiparametric SCNP assay for characterizing the healthy immune cell signaling network is the quantification of immune signaling responses at the single cell level. This enables the simultaneous measurement of changes in frequency and function of phenotypically defined cell subsets. This analysis in turn enables the evaluation of these variations as a basis for inter-donor variation in immune signaling responses to external modulators including therapeutics.
To qualitatively assess the degree of heterogeneity in the modulated protein levels in individual cells within phenotypically defined cell subpopulations, histograms of the modulated phospho-protein levels within each of the distinct cell subsets were visually inspected for a subset of the 60 donors (i.e. donors at the low, middle, and high end of the Fold range were selected). Most of the histograms examined appeared to have unimodal distributions. As a representative example, histograms for the IFN-α→p-Stat5 | CD45RA+ helper T cell signaling response (and the Unmodulated→p-Stat5 | CD45RA+ helper T cell histograms) are shown for 3 donors in Figure 6A. However, a few of the signaling responses showed strong bimodality in some donors. For example, in most of the donors examined, the IL-2→p-Stat5 | CD45RA+ helper T cell signaling response showed strong bimodality, where a portion of the cells in the CD45RA+ helper T cell subpopulation showed elevated p-Stat5 levels following IL-2 treatment while a subset of the cells overlap with the basal p-Stat5 distribution (see Figure 6B which shows histograms of basal and IL-2-induced p-Stat5 levels in the CD45RA+ helper T cell subpopulation for 3 healthy donors, 2 of which show pronounced bimodality). Notably, the proportion of IL-2 responsive (i.e. elevated p-Stat5) cells within the CD45RA+ helper T cell subpopulation varied from donor to donor, and higher IL-2→p-Stat5 | CD45RA+ helper T cell Fold values were observed for donors with higher proportions of IL-2 responsive CD45RA+ helper T cells (Figure 6B). Thus, the inter-donor variation in the Fold values for the IL-2→p-Stat5 | CD45RA+ helper T cell signaling response appears to be driven primarily by inter-donor differences in the proportion of CD45RA+ helper T cells that respond to IL-2. In contrast, the inter-donor variation in the Fold values for the IFN-α→p-Stat5 | CD45RA+ helper T cell signaling response were determined primarily by the intensity of the p-Stat5 response from a more uniformly responding CD45RA+ helper T cell subpopulation (Figure 6A). These results demonstrate that inter-donor variation in immune signaling responses within distinct immune cell subpopulations can arise from both inter-donor differences in the response magnitudes from homogeneously responding subpopulations and from inter-donor differences in the proportion of responsive cells within phenotypically-defined subpopulations that display functional heterogeneity.
Figure 6.

Cell subpopulation heterogeneity in immune signaling responses. A) Histograms from 3 different donors (with low, moderate, and high IFN-α→p-Stat5 | CD45RA+ helper T cell signaling response Fold values). Unmodulated p-Stat5 levels are shown in red and IFN-α-induced p-Stat5 levels are shown in blue. B) Histograms from 3 different donors (with low, moderate, and high IL-2→p-Stat5 | CD45RA+ helper T cell signaling response Fold values). Unmodulated p-Stat5 levels are shown in red and IL-2-induced p-Stat5 levels are shown in blue. The bimodality index (BI) for the modulated responses is shown above each plot.
Given the qualitative observation of bimodality in a fraction of the response profiles within a subset of donors from the 60 donor cohort, a method to quantify the degree of bimodality in each of the 11,760 modulated phospho-protein level distributions (i.e. for each of the 196 immune signaling responses measured in the 60 donors) was sought. The Bimodality Index (BI, see Materials and methods), which was originally developed for identifying genes with bimodal expression patterns [14] was utilized as a metric for identifying immune signaling responses with bimodality (using BI = 1.0 as a threshold for classifying responses as bimodal). As shown for the 6 modulated p-Stat5 distributions in Figure 6, the histograms with BI > 1.0 look “visually bimodal”.
To determine which immune signaling responses showed bimodality in at least half of the donors, the BI > 1.0 cutoff was applied to the median BI (over the 60 donors), and only 11 of the 196 immune signaling responses met this criteria (see responses with a “B” in Figure 4). Notably, 9 of the 11 signaling responses with median BI above 1.0 displayed high inter-donor variation (IQR > 0.3), the remaining two signaling responses with median BI above 1.0 did not display activation above the threshold level of Fold = 0.25. Because the 1.0 cutoff was applied to the median BI over the 60 donors, the 11 signaling nodes identified as bimodal (Figure 4) do not necessarily display bimodality in all 60 donors. For instance, the IL-2→p-Stat5 | CD45RA+ helper T cell signaling response had a median BI > 1.0, but Figure 6B also shows an example of a donor with a unimodal (BI = 0.68) distribution for this response. Likewise, for some of the signaling responses with median BI < 1.0, a fraction of the donors (<50%) have bimodal response profiles (data not shown).
Discussion
Immune responses are regulated by a complex network of diverse cell types and interconnected signaling pathways. Deregulation of the immune system can lead to dampened immune responses to pathogens and tumor cells (immunodeficiency), excessive immune responses to innocuous foreign antigens (hypersensitivity), or to inappropriate responses to self-antigens (autoimmunity) [3,16-18]. A greater understanding of the alterations in the immune cell signaling network that underlie immune-mediated diseases can lead to improved methods for diagnosing and treating such diseases. However, determining which immune signaling responses from diseased patients can be classified as abnormal requires comprehensive knowledge of the immune cell signaling network in the baseline, or disease-free, state. Recently, the single cell network profiling (SCNP) assay was used to generate a functional map of the healthy immune cell signaling network by measuring immune signaling responses to a broad panel of immunomodulators in multiple immune cell subpopulations within PBMCs from 60 healthy individuals [9]. This characterization of healthy immune signaling responses provides a basis for comparison with diseased specimens to identify, within the immune cell signaling network, which responses differ significantly from the baseline state and which responses are within the normal range of individual variation.
In the current study, the degree of inter-donor variation in immune signaling responses measured within distinct cell subsets across the 60 healthy donor cohort was analyzed. The results of this analysis showed that the immune signaling responses that displayed high inter-donor variation (as quantified by the interquartile range (IQR)) were restricted to the subset of immune signaling responses that showed activation above a threshold level of Fold = 0.25. This emphasizes the importance of applying a perturbation to probe both the capacity of each donor sample to signal through associated cell networks, and to identify inter-donor differences in the behavior of the immune cell signaling network which would not be detectable in a baseline state.
The degree of inter-donor heterogeneity in the response magnitude was found to display stimulus- and cell subset-specificity (Figures 4 and 5). Although there was a positive correlation (r = 0.727) between the magnitude of the response (i.e. Fold) and the degree of inter-donor variation in the response (IQR) for the full panel of immune signaling responses (Figure 3), the response magnitude alone appears to be a relatively poor predictor of the degree of inter-donor differences (i.e. necessary but not sufficient as a predictor of inter-donor variation). This suggests that the degree of inter-donor variation in the response of samples from healthy individuals cannot be accurately estimated by measuring the response magnitude in one single healthy donor. Instead, an accurate assessment of the degree of inter-donor variation for a specific immune signaling response of interest will require measuring the magnitude of the response over a population of healthy donors. These findings have important implications for the identification of immune signaling responses that may have utility as clinical biomarkers for diagnosis, prognosis, and treatment selection in immune-mediated pathologies.
The SCNP workflow allows for an investigation of the variation in signaling activity among individual cells within phenotypically defined immune cell subpopulations. A visual inspection of signaling activity at the single-cell level for a sampling of donors revealed bimodality in a small percentage of signaling responses. For example, IL-2-induced p-Stat5 responses displayed pronounced bimodality for some donors within the relatively well-defined CD45RA+ helper T cell subpopulation (Figure 6). This subpopulation heterogeneity in IL-2 responsiveness may be driven by variation in the expression of the IL-2 receptor. Recent work has shown that expression levels of the IL-2R subunits (IL-2Rα, IL-2Rβ, and IL-2Rγ) can vary substantially in clonal T cell populations [19]. Notably, the frequency of IL-2 responsive cells within the CD45RA+ helper T cell subpopulation varied widely from donor to donor (Figure 6B). Assessing inter-donor differences in the proportion of IL-2 responsive cells within distinct immune cell subpopulations may be of clinical relevance, given the use of IL-2 as an immunotherapy for the treatment of metastatic melanoma and renal cell carcinoma. Because high dose IL-2 therapy is associated with severe toxicity and only a subset of patients respond to treatment with IL-2 [20], the identification of biomarkers for predicting response to IL-2 immunotherapy (i.e. to identify patients likely to benefit from the therapy) would have high clinical utility. Several groups have started to use phospho-flow cytometry to monitor cytokine signaling pathways in immune cell subpopulations from patients with cancers such as melanoma and renal cell carcinoma [21-23]. Further studies are required in samples from the target patient populations in order to determine the degree of inter-donor variation in cytokine-induced signaling responses and the potential for any correlation between in vitro cytokine immune signaling responses and treatment response.
The Bimodality Index, BI ([14], see Materials and methods), was utilized to quantitatively identify bimodal responses among the 196 signaling responses measured in each of the 60 healthy donors. The majority of the signaling responses did not display bimodality, but instead displayed relatively homogeneous (unimodal) responses (see for example IFN-α-induced p-Stat5 responses in Figure 6A). The observed homogeneity in signaling for many of the immune signaling responses surveyed here may be reflective of relatively homogeneous expression of the corresponding receptors across each of the seven immune cell subpopulations. Only 11 of the 196 signaling responses displayed bimodality in the majority of the donors (i.e. had a median BI above the BI = 1.0 threshold value). These 11 bimodal nodes were not confined to a given cell subtype but instead spanned 6 of the 7 cell subpopulations, indicating that some degree of functional heterogeneity exists within these 6 cell subpopulations which are relatively well-defined phenotypically. Future studies utilizing PBMC samples from patients with cancer or autoimmunity are needed to assess, for signaling response which display bimodality, whether or not there is any correlation between the proportion of responding cells and clinical outcomes.
In summary, we found that the degree of inter-donor variation in immune signaling responses varied among the different cell subpopulations and immunomodulators tested in the healthy donor cohort. Quantifying the variation in immune signaling responses within the healthy immune cell signaling network is critical for establishing baseline ranges against which diseased specimens can be compared. This provides a foundation for the discovery of biomarkers that can aid in the diagnosis, treatment selection, and clinical monitoring of diseases such as cancer and autoimmunity.
Acknowledgments
We thank all donors who have donated samples for this study.
Conflicts of interest
D.M.L., B.L., R.E.H., and A.C. are employees of Nodality Inc. The other authors have no financial conflicts of interest.
References
- 1.Schubert C. Systems immunology: complexity captured. Nature. 2011;473:113–114. doi: 10.1038/nj7345-113a. [DOI] [PubMed] [Google Scholar]
- 2.Buonaguro L, Pulendran B. Immunogenomics and systems biology of vaccines. Immunol Rev. 2011;239:197–208. doi: 10.1111/j.1600-065X.2010.00971.x. [DOI] [PMC free article] [PubMed] [Google Scholar]
- 3.Bluestone JA, Kuchroo V. Autoimmunity. Curr Opin Immunol. 2009;21:579–581. doi: 10.1016/j.coi.2009.10.002. [DOI] [PMC free article] [PubMed] [Google Scholar]
- 4.Derhovanessian E, Solana R, Larbi A, Pawelec G. Immunity, ageing and cancer. Immun Ageing. 2008;5:11. doi: 10.1186/1742-4933-5-11. [DOI] [PMC free article] [PubMed] [Google Scholar]
- 5.Kornblau SM, Minden MD, Rosen DB, Putta S, Cohen A, Covey T, Spellmeyer DC, Fantl WJ, Gayko U, Cesano A. Dynamic single-cell network profiles in acute myelogenous leukemia are associated with patient response to standard induction therapy. Clin Cancer Res. 2010;16:3721–3733. doi: 10.1158/1078-0432.CCR-10-0093. [DOI] [PMC free article] [PubMed] [Google Scholar]
- 6.Rosen DB, Putta S, Covey T, Huang YW, Nolan GP, Cesano A, Minden MD, Fantl WJ. Distinct patterns of DNA damage response and apoptosis correlate with Jak/Stat and PI3kinase response profiles in human acute myelogenous leukemia. PLoS ONE. 2010;5:e12405. doi: 10.1371/journal.pone.0012405. [DOI] [PMC free article] [PubMed] [Google Scholar]
- 7.Rosen DB, Minden MD, Kornblau SM, Cohen A, Gayko U, Putta S, Woronicz J, Evensen E, Fantl WJ, Cesano A. Functional characterization of FLT3 receptor signaling deregulation in acute myeloid leukemia by single cell network profiling (SCNP) PLoS ONE. 2010;5:e13543. doi: 10.1371/journal.pone.0013543. [DOI] [PMC free article] [PubMed] [Google Scholar]
- 8.Palazzo AL, Evensen E, Huang YW, Cesano A, Nolan GP, Fantl WJ. Association of reactive oxygen species-mediated signal transduction with in vitro apoptosis sensitivity in chronic lymphocytic leukemia B cells. PLoS ONE. 2011;6:e24592. doi: 10.1371/journal.pone.0024592. [DOI] [PMC free article] [PubMed] [Google Scholar]
- 9.Longo DM, Louie B, Putta S, Evensen E, Ptacek J, Cordeiro J, Wang E, Pos Z, Hawtin RE, Marincola FM, Cesano A. Single-cell network profiling of peripheral blood mononuclear cells from healthy donors reveals age- and race-associated differences in immune signaling pathway activation. J Immunol. 2012;188:1717–1725. doi: 10.4049/jimmunol.1102514. [DOI] [PMC free article] [PubMed] [Google Scholar]
- 10.Pos Z, Selleri S, Spivey TL, Wang JK, Liu H, Worschech A, Sabatino M, Monaco A, Leitman SF, Falus A, Wang E, Alter HJ, Marincola FM. Genomic scale analysis of racial impact on response to IFN-alpha. Proc Natl Acad Sci USA. 2010;107:803–808. doi: 10.1073/pnas.0913491107. [DOI] [PMC free article] [PubMed] [Google Scholar]
- 11.Purvis N, Stelzer G. Multi-platform, multi-site instrumentation and reagent standardization. Cytometry. 1998;33:156–165. [PubMed] [Google Scholar]
- 12.Shults KE, Miller DT, Davis BH, Flye L, Hobbs LA, Stelzer GT. A standardized ZAP-70 assay--lessons learned in the trenches. Cytometry B Clin Cytom. 2006;70:276–283. doi: 10.1002/cyto.b.20136. [DOI] [PubMed] [Google Scholar]
- 13.Wang L, Gaigalas AK, Yan M. Quantitative fluorescence measurements with multicolor flow cytometry. Methods Mol Biol. 2011;699:53–65. doi: 10.1007/978-1-61737-950-5_3. [DOI] [PubMed] [Google Scholar]
- 14.Wang J, Wen S, Symmans WF, Pusztai L, Coombes KR. The bimodality index: a criterion for discovering and ranking bimodal signatures from cancer gene expression profiling data. Cancer Inform. 2009;7:199–216. doi: 10.4137/cin.s2846. [DOI] [PMC free article] [PubMed] [Google Scholar]
- 15.Benaglia T, Chauveau D, Hunter DR, Young DS. mixtools: an R package for analyzing mixture models. Journal of Statistical Software. 2009;32:1–29. [Google Scholar]
- 16.Borish L, Joseph BZ. Inflammation and the allergic response. Med Clin North Am. 1992;76:765–787. doi: 10.1016/s0025-7125(16)30325-x. [DOI] [PubMed] [Google Scholar]
- 17.Burton OT, Oettgen HC. Beyond immediate hypersensitivity: evolving roles for IgE antibodies in immune homeostasis and allergic diseases. Immunol Rev. 2011;242:128–143. doi: 10.1111/j.1600-065X.2011.01024.x. [DOI] [PMC free article] [PubMed] [Google Scholar]
- 18.Fischer A. Human primary immunodeficiency diseases. Immunity. 2007;27:835–845. doi: 10.1016/j.immuni.2007.11.012. [DOI] [PubMed] [Google Scholar]
- 19.Feinerman O, Jentsch G, Tkach KE, Coward JW, Hathorn MM, Sneddon MW, Emonet T, Smith KA, Altan-Bonnet G. Single-cell quantification of IL-2 response by effector and regulatory T cells reveals critical plasticity in immune response. Mol Syst Biol. 2010;6:437. doi: 10.1038/msb.2010.90. [DOI] [PMC free article] [PubMed] [Google Scholar]
- 20.Antony GK, Dudek AZ. Interleukin 2 in cancer therapy. Curr Med Chem. 2010;17:3297–3302. doi: 10.2174/092986710793176410. [DOI] [PubMed] [Google Scholar]
- 21.Varker KA, Kondadasula SV, Go MR, Lesinski GB, Ghosh-Berkebile R, Lehman A, Monk JP, Olencki T, Kendra K, Carson WE 3rd. Multiparametric flow cytometric analysis of signal transducer and activator of transcription 5 phosphorylation in immune cell subsets in vitro and following interleukin-2 immunotherapy. Clin Cancer Res. 2006;12:5850–5858. doi: 10.1158/1078-0432.CCR-06-1159. [DOI] [PubMed] [Google Scholar]
- 22.Critchley-Thorne RJ, Yan N, Nacu S, Weber J, Holmes SP, Lee PP. Down-regulation of the interferon signaling pathway in T lymphocytes from patients with metastatic melanoma. PLoS Med. 2007;4:e176. doi: 10.1371/journal.pmed.0040176. [DOI] [PMC free article] [PubMed] [Google Scholar]
- 23.Mortarini R, Vegetti C, Molla A, Arienti F, Ravagnani F, Maurichi A, Patuzzo R, Santinami M, Anichini A. Impaired STAT Phosphorylation in T Cells from Melanoma Patients in Response to IL-2: Association with Clinical Stage. Clinical Cancer Research. 2009;15:4085–4094. doi: 10.1158/1078-0432.CCR-08-3323. [DOI] [PubMed] [Google Scholar]