

Abstract
We recently found activity in default mode and reward-related regions during self-relevant tasks in young adults. Here we examine the effect of aging on engagement of the default network (DN) and reward network (RN) during these tasks. Previous studies have shown reduced engagement of the DN and reward areas in older adults, but the influence of age on these circuits during self-relevant tasks has not been examined. The tasks involved judging personality traits about one’s self or a well known other person. There were no age differences in reaction time on the tasks but older adults had more positive Self and Other judgments, whereas younger adults had more negative judgments. Both groups had increased DN and RN activity during the self-relevant tasks, relative to non-self tasks, but this increase was reduced in older compared to young adults. Functional connectivity of both networks during the tasks was weaker in the older relative to younger adults. Intrinsic functional connectivity, measured at rest, also was weaker in the older adults in the DN, but not in the RN. These results suggest that, in younger adults, the processing of personally relevant information involves robust activation of and functional connectivity within these two networks, in line with current models that emphasize strong links between the self and reward. The finding that older adults had more positive judgments, but weaker engagement and less consistent functional connectivity in these networks, suggests potential brain mechanisms for the “positivity bias” with aging.
Keywords: Aging, Default network, Reward, fMRI, Functional connectivity, Social cognition, Self-reference
1. Introduction
Each of us encounters an abundance of information on a daily basis and must attempt to process this information in relation to our self-concept and integrate it into this concept. Processing information relevant to the self appears to be related to a variety of cognitive functions, including emotion perception and regulation (Cross & Madson, 1997; Stuss, Gow, & Hetherington, 1992; Zinck, 2008), theory of mind (Moriguchi et al., 2006; Saxe, Moran, Scholz, & Gabrieli, 2006; Spreng, Stevens, Chamberlain, Gilmore, & Schacter, 2010), and memory (Fossati et al., 2004; Robinson & Clore, 2002; Welzer & Markowitsch, 2005). For example, some researchers have emphasized the interactions among the self and autobiographical memory (Conway & Pleydell-Pearce, 2000), whereas others have described the overlapping representations between self and reward (Northoff & Hayes, 2011). In addition, a number of studies have shown that processing new information in relation to the self provides a boost for later memory for this information (for a review see Symons & Johnson, 1997). Indeed, the concept of self has been described as a multifaceted set of interrelated systems, involving episodic and semantic memory, agency, and metacognitive functions (Klein & Gangi, 2010). Thus, it would appear that relating information to the self can influence a number of cognitive processes, and indeed is likely an integral part of some, such as autobiographical memory, that, by definition, draw on the self concept.
Given the ubiquitous nature of self-relevant processing, it is perhaps not surprising that most studies looking at self-reference in older adults have found it to be relatively preserved. Age differences in making judgments about personality traits in regards to one’s self have not been found (Keightley, Winocur, Burianova, Hongwanishkul, & Grady, 2006; Ruby et al., 2009), and the self reference effect in episodic memory is also preserved into older age (Glisky & Marquine, 2009; Gutchess, Kensinger, Yoon, & Schacter, 2007). Although this work suggests that some aspects of self-reference are not markedly altered as we age, some of the other types of related processing, mentioned above, are influenced by aging. For example, there is considerable evidence that older adults show an increased sensitivity to emotionally positive information, relative to younger adults’ focus on negative information, the so-called “positivity bias” or “positivity effect” (e.g., Carstensen, Fung, & Charles, 2003; Ebner, Riediger, & Lindenberger, 2009; Isaacowitz, Allard, Murphy, & Schlangel, 2009; Mather & Carstensen, 2005). This difference in emotional biases is seen in attention and memory (Charles, Mather, & Carstensen, 2003; Grady, Hongwanishkul, Keightley, Lee, & Hasher, 2007; Mather & Carstensen, 2003; Spaniol, Voss, & Grady, 2008), and is thought to reflect a difference in motivational goals as the end of life approaches (Carstensen, et al., 2003). In addition, there are age differences in reward processing, such that older adults show reductions in learning about rewards relative to younger adults (Bellebaum, Kobza, Thiele, & Daum, 2011; Eppinger, Herbert, & Kray, 2010; Weiler, Bellebaum, & Daum, 2008). Older adults also are reported to respond differently to gains vs. losses (Samanez Larkin et al., 2007), although the temporal discounting of rewards does not appear to change with age when factors, such as income, are taken into account (Green, Myerson, Lichtman, Rosen, & Fry, 1996).
Because processing information relevant to the self can involve a variety of cognitive functions, a number of brain regions could potentially be recruited during tasks that involve self-reference. These could include medial prefrontal regions involved in theory of mind and making judgments about one’s self (Andrews-Hanna, Reidler, Sepulcre, Poulin, & Buckner, 2010; Craik et al., 1999; Fossati, et al., 2004; Kelley et al., 2002; Spreng, Mar, & Kim, 2009), medial temporal and midline parietal regions for autobiographical memory (Addis, McIntosh, Moscovitch, Crawley, & McAndrews, 2004; Burianova & Grady, 2007; Levine et al., 2004), and ventral striatum for reward (for a review, see Liu, Hairston, Schrier, & Fan, 2011). Some of these regions, specifically midline frontal and parietal areas and the medial temporal lobes, are considered to be major nodes of a brain network known as the default network (DN), which is thought to be involved in spontaneous, internally-driven cognitive processes (Buckner & Carroll, 2007; Gusnard, Akbudak, Shulman, & Raichle, 2001; Raichle et al., 2001; Shulman et al., 1997; Spreng & Grady, 2010; Spreng, et al., 2009). We recently reported the results of an fMRI study of self-relevant processing in younger adults (Grigg & Grady, 2010b) using tasks requiring a judgment about personality traits as applied to the self and a close other, and contrasted activity in these tasks to activity in non self-relevant tasks. We found increased activity in DN regions, but also noted increased activity in regions associated with reward, including the ventral striatum. Interestingly, studies have shown that both the DN and reward areas show reduced activity in older adults, relative to younger adults (see below), but these two systems have not been examined together in a single experimental framework that taps social cognitive function. The aim of the current report is to probe the effects of age on both the DN and reward-related regions during the processing of self-relevant information.
1.1 The Default Network (DN)
The DN is thought to consist of ventromedial prefrontal cortex (vmPFC) and the posterior cingulate cortex (PCC), the medial temporal lobes, superior frontal gyri, and some inferior parietal and lateral temporal areas (Fox et al., 2005; Toro, Fox, & Paus, 2008). The midline nodes of the DN have been particularly implicated in self-relevant processing, and a number of studies have shown increased activity in the vmPFC when participants are processing self-relevant information (Craik, et al., 1999; Fossati et al., 2003; Johnson et al., 2006; Ochsner et al., 2005; Uddin, Iacoboni, Lange, & Keenan, 2007; van der Meer, Costafreda, Aleman, & David). Northoff and colleagues (2004) have emphasized the involvement of both vmPFC and PCC in constructing the various aspects of the self, although have also suggested that subcortical structures (such as the medial thalamus) are critical as well. Importantly, In young adults, the regions of the DN maintain strong functional interconnections during tasks requiring self-reference or theory of mind (Grigg & Grady, 2010a; Spreng & Grady, 2010), and also during the resting state (e.g., Buckner, Andrews-Hanna, & Schacter, 2008; Fox, et al., 2005).
Only a few studies have assessed age differences in brain activity during self-referent tasks in DN regions, and these have focused on the vmPFC. One showed equivalent vmPFC activity in young and old adults during a self reference task (Gutchess, Kensinger, & Schacter, 2007), whereas others have reported more vmPFC activity in young adults than in older adults (Mitchell et al., 2009), or differences in how this and other regions are utilized for making judgments about the self, relative to another person (Gutchess, Kensinger, & Schacter, 2010). An additional study found that vmPFC activity was equivalent in younger and older adults during personality trait judgments (Feyers, Collette, D’Argembeau, Majerus, & Salmon, 2010), but functional interactions of vmPFC differed somewhat with age, with stronger occipital connections in younger adults, and stronger connections within ventral frontal regions in the older group.
More generally, however, age differences have been observed in the DN, in non-self related experimental contexts. Several studies have found that the reduction of DN activity during externally-driven cognitive tasks is less pronounced in older adults, relative to younger adults (Andrews-Hanna et al., 2007; Damoiseaux et al., 2008; Duzel, Schutze, Yonelinas, & Heinze, 2011; Esposito et al., 2008; Grady et al., 2010; Grady, Springer, Hongwanishkul, McIntosh, & Winocur, 2006; Lustig et al., 2003; Miller et al., 2008; Persson, Lustig, Nelson, & Reuter-Lorenz, 2007). Intrinsic functional connectivity within the DN during periods of rest also is reduced in older relative to younger adults (Andrews-Hanna, et al., 2007; Hedden et al., 2009; Park, Polk, Hebrank, & Jenkins, 2010), and age reductions during memory tasks also have been noted (Sambataro et al., 2010; Wang, Li, Metzak, He, & Woodward, 2010). These age differences in resting DN activity and connectivity have consequences for memory performance (Miller, et al., 2008; Wang et al., 2010), and performance on tests of executive function and processing speed in older adults (Andrews-Hanna, et al., 2007; Damoiseaux, et al., 2008; Persson, et al., 2007). These studies all suggest that activity and functional connectivity of the DN are disrupted in older adults and that this may have negative consequences for their cognitive function, although the role of the DN as a whole in social cognition of older adults has not been examined.
1.2 The Reward Network (RN)
Based on anatomical connectivity studies in animals, the ventral and dorsal striatum, anterior cingulate, medial temporal lobes, medial PFC, and dopaminergic cells in the ventral tegmental area are thought to be critical components in a circuit that processes reward (Haber & Knutson, 2010). There is ample neuroimaging evidence of the involvement of these areas in tasks that tap the use of rewards to make decisions, especially the ventral striatum (Abler, Walter, Erk, Kammerer, & Spitzer, 2006; Knutson, Taylor, Kaufman, Peterson, & Glover, 2005; Liu, et al., 2011; O’Doherty, Deichmann, Critchley, & Dolan, 2002; Pagnoni, Zink, Montague, & Berns, 2002; Rolls, McCabe, & Redoute, 2008; Schott et al., 2008). In addition, there is recent support for the idea that these areas are functionally connected during reward tasks (Camara, Rodriguez-Fornells, & Munte, 2009; Krebs, Heipertz, Schuetze, & Duzel, 2011; Ye, Hammer, Camara, & Munte, 2011), and rest (Cauda et al., 2011). Our previous finding of activation in ventral striatum during judgments of self and a close other (Grigg & Grady, 2010a) is consistent with the idea that there is an intimate link between self and reward (Northoff & Hayes, 2011). Others have shown that social stimuli, such as faces, can have rewarding properties and activate the ventral striatum (Izuma, Saito, & Sadato, 2008; Liang, Zebrowitz, & Zhang, 2010), and that learning about social information involves the same kinds of behavioral processes, and some of the same brain areas, as learning about the rewarding properties of stimuli (Behrens, Hunt, Woolrich, & Rushworth, 2008).
Similar to the age differences seen in the DN, reductions of activity in reward related areas have been reported by a number of groups. For example Dreher et al (2008) showed that older adults have less activity in the ventral striatum during reward anticipation, and a weaker relation between this activity and dopamine levels in the midbrain, relative to younger adults. Mell et al (2009) also reported an age reduction in striatal responses to learned reward. Samenez-Larkin et al (2007) found a similar reduction of striatal activity during anticipation of losses in older adults, but no age differences in activity during gain anticipation. A subsequent study (Samanez-Larkin, Kuhnen, Yoo, & Knutson, 2010) showed that variability of the response in the ventral striatum of older adults was related to their greater tendency to make suboptimal choices when assessing risky decisions. As with the DN, the function of reward-related areas, or the entire network, has not been examined in older adults during self-relevant tasks.
1.3 The Current Study
The work to date on the neural underpinnings of self processing in older adults does not definitively show whether there are age differences in these neural mechanisms, nor does it directly address whether activity and functional connectivity within networks that may operate during such processing is altered with age. Therefore, in our study we aimed to address these questions by assessing distributed activity across the brain using a multivariate technique that allows us to identify covarying activity in groups of brain regions across tasks as well as functional connectivity within networks defined in reference to major nodes of the networks. Younger and older adults carried out self-relevant tasks and non-self tasks while undergoing functional MRI (Grigg & Grady, 2010a, 2010b). Although we reported in our earlier study (Grigg & Grady, 2010a) that the ventral striatum was active during the self relevant tasks in younger adults, the focus of that paper was on the DN, and we did not explore the RN per se or how it might interact with the DN. Here we examine both networks and whether aging weakens engagement of these networks during self-reference or alters their functional connectivity during task or at rest. Previous work would suggest that aging influences both networks, and assessing them in the same experimental framework allowed us to determine whether one is more vulnerable to aging than the other.
2. Materials and Methods
2.1 Participants
Twenty healthy right-handed young adults (10 males) and 20 older adults participated in this study. Four of the older adults had to be dropped from the task analyses due to technical problems with the fMRI scans, leaving a sample of 16 older adults (6 males, see Table 1). All participants were in good reported health and none had diabetes or untreated hypertension. All of the older adults scored in the normal range on the Mini Mental Status Exam (> 26 out of 30), a commonly used test of mental status (Folstein, Folstein, & McHugh, 1975). The Research Ethics Board of Baycrest Centre approved this experiment, and all participants provided informed consent.
Table 1.
Demographic Data, Personality Scores, and Task Performance
| Variable | Younger Adults | Older Adults |
|---|---|---|
| Demographics | ||
| Age (yrs) | 23.7 ± 3.1 | 71.1 ± 5.2 |
| Education (yrs) | 14.7 ± 2.4 | 16.0 ± 2.4 |
| Vocabulary | 19.1 ± 4.6 | 24.1 ± 4.6* |
| Personality Scale (NEO-FFI) | ||
| Neuroticism | 40.1 ± 6.8 | 36.0 ± 8.4 |
| Extraversion | 52.0 ± 9.5 | 47.8 ± 8.3 |
| Openness | 57.2 ± 12.0 | 52.6 ± 10.7 |
| Agreeableness | 54.3 ± 12.1 | 63.8 ± 11.1* |
| Conscientiousness | 51.8 ± 9.7 | 58.4 ± 9.0* |
| Reaction Times | ||
| Self | 1696 ± 307 | 1652 ± 338 |
| Other | 1780 ± 254 | 1677 ± 282 |
| Vowel | 1536 ± 220 | 1671 ± 314 |
| Motor | 1020 ± 229 | 1649 ± 315* |
| Proportion of ‘Yes’ Responses | ||
| Positive – Self | 0.88 ± 0.09 | 0.93 ± 0.06* |
| Neutral - Self | 0.47 ± 0.11 | 0.45 ± 0.10 |
| Negative – Self | 0.18 ± 0.13 | 0.09 ± 0.08* |
| Positive - Other | 0.73 ± 0.23 | 0.89 ± 0.10* |
| Neutral - Other | 0.49 ± 0.10 | 0.45 ± 0.08 |
| Negative - Other | 0.23 ± 0.19 | 0.12 ± 0.08* |
| RTs for ‘Yes’ Responses to Positive and Negative Words | ||
| Positive – Self | 1539 ± 289 | 1592 ± 313 |
| Negative – Self1 | 1808 ± 325 | 2191 ± 428* |
| Positive – Other | 1614 ± 246 | 1621 ± 330 |
| Negative - Other2 | 1806 ± 259 | 2033 ± 317* |
Old differ from young, p<0.05 (see text for details). Young n = 19 for behavioral measures due to equipment failure.
Old n = 14 for Self RT analyses due to absence of ‘yes’ responses to negative words for some participants:
Young n = 14 and Old n =15 for Other RT analyses due to lack of ‘yes’ responses to negative words.
Young and older adults had similar levels of education (Table 1), although the older participants had higher vocabulary scores (t(32) = 2.9, p < 0.01) as assessed by the Mill Hill vocabulary test (Raven, Court, & Raven, 1988). Participants also were administered a personality survey to assess self-reported personality traits (NEO-FFI, Costa & McCrae, 1992). Older adults scored more highly than young adults on agreeableness (t(33) = 2.4, p < 0.05) and conscientiousness (t(33) = 2.0, p < 0.05), as has been reported in the aging and personality literature (McCrae et al., 1999; McCrae, Martin, & Costa, 2005).
2.2 Tasks
Participants carried out four tasks, each of which was presented twice in each scanning run (in a random order, with the stipulation that no task was presented twice in succession), for a total of eight runs. Each run was composed of 17 blocks of 20 seconds each, alternating between tasks and resting baseline. Each task block contained five trials of the same task type. Trials included a fixation cross shown for one second, followed by a task stimulus shown for three seconds. The task stimulus included a personality-trait word, a cue word (indicating which task was to be carried out) and two response options shown simultaneously on a computer screen. The personality-trait words, both positive and negative (320 total), were selected from a widely-used source (Anderson, 1968). Word order within the session was randomized, and no word was repeated. Participants were instructed that rapid responses were not required, but to respond within the three second time frame.
The four tasks were self-reference (Self), other-reference (Other), vowel identification (Vowel), and a sensorimotor control task (Motor). In the Self task (cue: “You?”) participants decided whether the word, e.g., “honest”, characterized them or not, and in the Other task (“Other?”) the task was to decide whether the word described a person well known to them (each participant was allowed to choose the person to be judged in the experiment). These two tasks were chosen to tap into self-relevant processing, under the assumption that the Other task also would require some self-related cognitive processing, due to the judgment being made on someone well known to the participant (Ames, Jenkins, Banaji, & Mitchell, 2008; Ochsner, et al., 2005). In the Vowel task (“Vowel?”) participants judged whether the third letter from the end of the word was a vowel. The possible answers for these three tasks, which appeared below the trait word, were “yes” or “no”. In the Motor task (“Button:”) subjects were instructed to press button 1 or 2, depending on a number shown on the screen. The Vowel and Motor tasks were chosen to tap externally driven, non-self related processes that are associated with reduced activity in the DN (e.g., Grady, et al., 2010; McKiernan, Kaufman, Kucera-Thompson, & Binder, 2003; Raichle, et al., 2001). The responses, and their timing, were recorded.
2.3 Image acquisition and Preprocessing
Images were obtained used a Siemens Trio 3T scanner. Anatomical scans were acquired with a 3D MP-RAGE sequence (TR=2 sec, TE=2.63 msec, FOV=25.6 cm2, 256×256 matrix, 160 slices of 1 mm thickness). Functional runs were acquired with an EPI sequence (170 volumes, TR=2 sec, TE=30 msec, flip angle = 70°, FOV=20 cm2, 64×64 matrix, 30 slices of 3.12 × 3.12 mm in-plane resolution, 5 mm thick, no gap). Pulse and respiration were measured during scanning. The scanning session included a high-resolution structural scan, followed by 10 functional runs, each lasting 5:40 minutes. The first and last runs were resting-state runs, in which subjects were instructed to lie still with their eyes closed and relax, but to not fall asleep. Runs 2–8 were task runs as described above.
Preprocessing was performed with AFNI (Cox, 1996) and consisted of correction for motion due to respiration and heart rate (Glover, Li, & Ress, 2000), rigid-body motion correction, spatial normalization to the MNI template (resampling our data to 4 mm isotropic voxels), smoothing (full-width half-maximum, 6 mm), and regressing out white matter, ventricular and large blood vessel signal, as well as the motion parameters, from each voxel time series (Grady, et al., 2010).
2.4 Data analysis
To assess responses in the Self and Other conditions, the 320 trait words used in the experiment were ranked from most to least positive based on the ratings reported by Anderson (1968). Then the list was divided into thirds, with the top third defined as “positive”, the middle third as “neutral” and the bottom third as “negative”. We then compared young and older adults on the proportion of ‘yes’ responses to positive, neutral and negative words for the Self and Other conditions. In addition to these proportions, we also compared reaction times (RTs) of young and older adults on all four of the tasks.
Image analysis was performed with partial least squares, or PLS (Krishnan, Williams, McIntosh, & Abdi, 2011; McIntosh, Bookstein, Haxby, & Grady, 1996; McIntosh & Lobaugh, 2004) a multivariate approach that identifies spatiotemporal patterns of brain activity related to tasks (task-PLS) or correlated with activity in a given brain area to assess functional connectivity (seed-PLS). PLS performs block-based signal normalization (i.e., normalizing the time points in each block to the first time point in the block), averages over all blocks within a condition for each subject, and then uses singular value decomposition to extract patterns of activity that characterize the covariance between activity in all voxels and the experimental conditions or seed activity. In task-PLS each component resulting from the decomposition, known as a latent variable (LV), identifies a contrast across the experimental conditions as well as a spatial activity pattern depicting the brain regions that, as a whole, show the strongest relation to (e.g. are covariant with) the task contrast. In seed-PLS the mean signal in a reference region is correlated with activity in all other brain voxels (within conditions, across participants) to assess the seed’s functional connectivity (McIntosh, 1999). In a seed analysis, the LVs indicate the patterns of correlation, or connectivity that characterize each condition. Note that seed-PLS assesses functional connectivity across subjects, rather than calculating correlations across voxel time courses within subjects, but results in patterns of connectivity that are quite similar to those identified using within-subject approaches (Grigg & Grady, 2010a, 2010b). In the analyses reported here, our use of PLS was data-driven, so that each LV was extracted according to the amount of covariance in brain activity that it accounted for, similar to a principal component analysis.
Each LV has a “singular value” that indicates the amount of covariance accounted for by the LV. The significance for each LV, based on its singular value, was determined using a permutation test, with 750 permutations. These permutations used sampling without replacement to reassign the order of conditions for each participant. A PLS analysis was run for each new sample, and the number of times the permuted singular value exceeded the observed singular value was calculated for each LV. This procedure provided exact probabilities for all LVs, and an objective means for determining the number of LVs to be retained (p < 0.05 was used here). Because the decomposition of the data matrix is done in a single analytic step, no correction for multiple comparisons is required for this approach.
In addition, each brain voxel has a weight, known as a salience, which is proportional to the covariance of its activity with the contrast across conditions identified by each LV. To determine which brain voxels robustly contributed to the brain pattern identified by each LV, the saliences from each voxel were submitted to a bootstrap estimation (100 bootstraps) of the standard errors (SE, Efron, 1981). For the bootstrap procedure, participants were randomly resampled, with replacement, 100 times and each voxel’s SE was calculated. All voxels where the ratio of salience to the SE for that voxel (bootstrap ratio, or BSR) exceeded ± 3.0 were considered to make a robust contribution to the pattern. These ratios are analogous to Z scores (Sampson, Streissguth, Barr, & Bookstein, 1989), so that a BSR of 3 would be equivalent to p < 0.005. Using this BSR threshold, clusters of activity were identified that contained at least 10 voxels, and the local maximum for each cluster was defined as the voxel with a salience/SE ratio higher than any other voxel in a 2-cm cube centered on that voxel. Locations of these maxima are reported as coordinates in MNI space. To obtain summary measures of each participant’s expression of each LV pattern, we calculated ‘brain scores’ by multiplying each voxel’s salience by the BOLD signal in the voxel, and summing over all brain voxels for each participant. This resulted in a brain score for each participant in each condition, for each LV, which in the task-PLS analysis allowed the comparison of mean brain scores across conditions and groups. These brain scores were then mean-centered (using the grand mean across conditions/groups) and 95% confidence intervals (CIs) for the mean brain scores in each condition were calculated from the bootstrap. To obtain a conservative measure of the differences in activity between conditions and age groups, we determined these differences via a lack of overlap in the CIs. That is, non-overlapping CIs between conditions within a group, or between groups within a condition, indicated a significant difference1.
We used task-PLS to examine changes in brain activity across the four tasks and blocks of resting Baseline in younger and older adults. Both age groups were included in the analysis so that direct group differences could be assessed. To assess whole-brain functional connectivity of the DN we used a seed in the posterior cingulate (PCC, coordinates: 0, −48, 28) that was identified in a previously reported analysis of the young participants (Grigg & Grady, 2010a). To assess functional connectivity in the RN, we used a seed in the right ventral striatum identified in the task analysis performed here (coordinates: 20, 12, −8; see Table 3). For these analyses we included the three conditions most likely to involve some degree of self-relevant processing, i.e., Baseline, Self and Other, and in which functional connectivity of the two networks would be most relevant. In addition, because this type of analysis is based on correlations, which can be unduly influenced by outliers, one younger adult and one older participant were omitted from the PCC analysis because their PCC activity was more than ± 2 SD from their respective group means in two of the three conditions (resulting in 19 young and 15 older adults in the analysis). The same younger adult was omitted from the analysis of the ventral striatum seed as well. We also assessed functional connectivity of the two seeds during the first resting-state run to obtain measures of intrinsic, task-independent connectivity. The seed analysis of the resting data was carried out after a temporal resampling of the resting-state time series by averaging each consecutive 5 volumes, to produce 30 “blocks” of 10 sec each. This averaging produced an effective low-pass filter of 0.1 Hz and reduced temporal noise (Grigg & Grady, 2010a, 2010b). The resting-state seed analyses included all participants from the original 20 in each group who had usable data (19 young and 15 older adults, including 2 older adults who were not included in the task analyses).
Table 3.
Brain Activity associated with Self vs. Non-Self Tasks
| Region | BA | X | Y | Z | BSR |
|---|---|---|---|---|---|
| Self/Other > Vowel/Motor | |||||
| L dorsomedial frontal cortex | 9 | −8 | 48 | 32 | 8.1 |
| L superior frontal gyrus | 10 | −16 | 52 | 12 | 8.9 |
| L inferior frontal gyrus | 47 | −44 | 24 | −8 | 7.8 |
| L ventromedial prefrontal cortex | 11 | −4 | 48 | −12 | 8.5 |
| L anterior cingulate gyrus | 24 | −4 | 32 | 20 | 9.5 |
| L middle temporal gyrus | 21 | −56 | −8 | −16 | 8.4 |
| L middle temporal gyrus | 21 | −48 | −40 | 0 | 5.6 |
| R parahippocampal gyrus | 36 | 24 | −40 | −4 | 6.1 |
| L hippocampus | 36 | −20 | −32 | −12 | 5.5 |
| R superior temporal gyrus | 38 | 48 | 20 | −28 | 5.3 |
| L superior temporal gyrus | 38 | −48 | 16 | −32 | 8.0 |
| L superior temporal gyrus | 22 | −40 | −52 | 12 | 6.3 |
| L angular gyrus | 39 | −44 | −68 | 24 | 6.1 |
| L middle cingulate gyrus | 23 | −4 | −16 | 32 | 9.6 |
| L posterior cingulate gyrus | 31 | −4 | −48 | 28 | 7.9 |
| Retrosplenial cortex | 23 | 0 | −64 | 12 | 9.6 |
| R ventral striatum/putamen | 20 | 12 | −8 | 10.5 | |
| L ventral striatum/putamen | −20 | 12 | −4 | 9.9 | |
| R thalamus | 8 | −12 | 0 | 6.9 | |
| R cerebellum | 28 | −76 | −32 | 9.9 | |
| L cerebellum | −8 | −52 | −40 | 6.0 | |
| L cerebellum | −24 | −80 | −36 | 7.4 | |
| Vowel/Motor > Self/Other | |||||
| R middle frontal gyrus | 8 | 32 | 24 | 52 | −6.5 |
| R middle frontal gyrus | 46 | 44 | 44 | 20 | −4.6 |
| R middle temporal gyrus | 37 | 56 | −52 | −12 | −8.9 |
| L middle temporal gyrus | 37 | −52 | −64 | −12 | −8.0 |
| R superior parietal lobe | 7 | 28 | −60 | 40 | −12.1 |
| R supramarginal gyrus | 40 | 52 | −44 | 40 | −9.9 |
| L superior parietal lobe | 7 | −24 | −56 | 40 | −8.0 |
| R middle occipital gyrus | 18 | 28 | −88 | 0 | −4.9 |
| Cerebellum | 0 | −76 | −40 | −6.6 | |
R = right hemisphere; L = left hemisphere; BA = Brodmann’s area; X = right/left; Y = anterior/posterior; Z = superior/inferior; BSR = bootstrap ratio.
The seed analyses involved extracting the mean signal for each seed voxel from the three task-run conditions (Baseline, Self, Other) and from each of the 30 resting-state blocks in each participant, and correlating this with the mean signal in all other brain voxels, across participants in each group. This resulted in three correlations per group for the task runs and 30 per group for the resting-state run. These correlations were then compared with PLS across conditions (or rest blocks) and groups, for each seed separately. To provide a measure of how strongly seed activity covaried with the whole-brain pattern of activity seen on each LV, correlations between brain scores and seed activity were computed for each group, for each condition or block. Reliability of these correlations (95% CIs) was calculated from the bootstrap procedure; age differences in the task-run analyses were determined via a lack of overlap in the CIs. For the resting-state analyses, we compared the distribution of the correlations across the 30 blocks between younger and older groups using t-tests (the same results were obtained with an independent samples non-parametric test).
3. Results
3.1 Behavior
Mean proportion of ‘yes’ responses and RTs are shown in Table 1. Both groups responded to most of the Self and Other questions with ‘yes’ when the trait word was positive, roughly half the time when the trait word was neutral, and less than 25% of the time when the trait word was negative. A two (type of task: Self, Other) x two (group) x three (valence: positive, neutral, negative) ANOVA was carried out for ‘yes’ responses to assess group differences. No main effects, other than for valence, were significant, but the interaction of valence x group was significant, F(2,66) = 11.1, p = 0.001. Separate ANOVAs for each valence revealed significant main effects of type of task, F(1,33) = 8.8, p < 0.01, and group, F(1,33) = 9.7, p < 0.01, on responses to positive trait words. These effects were due to greater endorsement of positive traits for self, relative to other, and in older relative to younger adults (see Table 1). For negative trait words, the only significant effect was that of age F(1,33) = 9.6, p < 0.01, and the younger adults endorsed more negative words than did the older group. There were no significant interactions in either of these analyses, nor were there any significant main effects or interactions for neutral words.
There was a significant effect of task on RT, F(1,33) = 99.7, p < 0.001, and a significant task by group interaction, F(1,33) = 96.7, p < 0.001. When each task was analyzed separately, the only one with an age difference was the Motor task, F(1,33) = 46.6, p < 0.001. In addition, when the age groups were analyzed separately, the older adults showed no effect of task on RT (F < 1), but the younger adults did show an effect of task F(3,54) = 113.5, p < 0.001. Bonferroni t-tests showed that RTs for all conditions were different from one another in young adults (p < 0.05).
Because there were age differences in the tendency to endorse positive and negative traits, we also compared RTs for Self and Other judgments (see Table 1) by positive and negative valence in a 2 (group) × 2 (Self/Other) × 2 (valence) ANOVA. There were significant effects of valence, F(1,25) = 60.5, p < 0.001, and valence x group, F(1,25) = 8.5, p < 0.01. When analyzed separately by valence, there was a significant effect of task for RTs to positive words, F(1,33) = 7.3, p < 0.02, due to longer RTs for endorsing traits relating to others, but no effect of group. For RTs to negative words, the only significant effect was that of group, F(1,25) = 7.7, p = 0.01, due to faster responses in young adults. Thus, older adults tended to rate themselves and others more positively than did younger adults; younger adults endorsed more negative traits than older adults, and were faster to do so.
3.2 fMRI – Task Effects
The task-PLS identified two patterns of whole-brain activity that reliably differentiated the Self and Other tasks from the Vowel and Motor tasks and/or Baseline. The first pattern (p < 0.001, accounting for 60% of the covariance) showed a difference between all of the tasks and the Baseline condition (Figure 1a). In addition, this task-related pattern of activity was engaged to a greater degree in the Self and Other conditions than in the Vowel and Motor tasks. There were no age differences in this pattern except for the Motor task, during which the older adults showed more activity. More activity for the tasks relative to Baseline was seen in dorsomedial PFC, inferior frontal gyri, widespread regions of occipital cortex extending into temporal regions and the cerebellum, and bilateral putamen. More activity during Baseline was seen in parts of middle cingulate cortex, retrosplenial cortex, precuneus, and bilateral posterior parahippocampal gyri (see Table 2 for a list of regions contributing to this LV).
Figure 1.
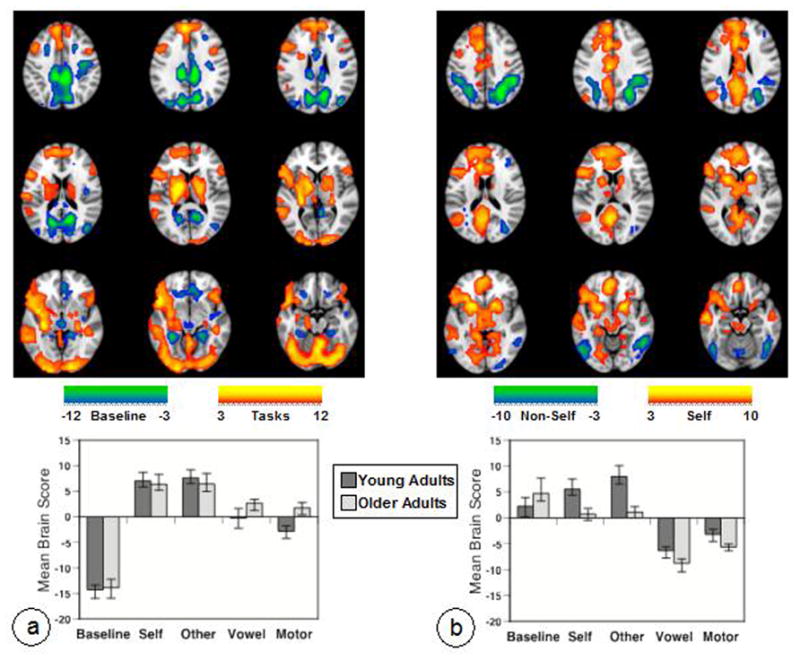
Results of the task-PLS analysis are shown on axial slices from the MNI152 average structural brain. Panel a shows LV1 and Panel b shows LV2. In the brain images (data have been resampled to 1 mm isotropic voxel size for display purposes here and in subsequent figures), greater activity in regions shown in warm colors is seen in conditions where the mean brain score (shown in the graphs below) is above zero (zero indicates overall mean activity as these scores have been mean-centered). Greater activity in cool-colored areas is seen in those conditions with mean brain scores below zero. The color bars indicate the minimum and maximum BSRs for each LV (threshold set to BSR=3). The graphs show the average of the mean-centered brain scores for each condition in each group (error bars are the 95% confidence intervals from the bootstrap procedure). Non-overlapping confidence intervals indicate differences between conditions or groups.
Table 2.
Brain Activity associated with Tasks vs. Rest
| Region | BA | X | Y | Z | BSR |
|---|---|---|---|---|---|
| Task > Rest | |||||
| R inferior frontal gyrus | 9/45 | 52 | 12 | 36 | 5.7 |
| R inferior frontal gyrus | 47 | 48 | 32 | −12 | 6.9 |
| L dorsomedial frontal cortex | 9 | −4 | 48 | 32 | 9.7 |
| L middle frontal gyrus | 9/45 | −40 | 16 | 40 | 6.7 |
| L inferior frontal gyrus | 47 | −48 | 20 | −12 | 10.4 |
| R superior temporal gyrus | 38 | 52 | 20 | −28 | 7.2 |
| R middle temporal gyrus | 21 | 48 | −32 | −8 | 7.2 |
| L middle temporal gyrus | 21 | −56 | −32 | −8 | 7.1 |
| R cuneus | 18 | 20 | −92 | −4 | 9.9 |
| L cuneus | 18 | −16 | −100 | −8 | 10.6 |
| R thalamus | 28 | −28 | 4 | 8.7 | |
| R putamen/GP | 20 | −8 | 12 | 8.1 | |
| L putamen | −28 | −20 | 0 | 12.1 | |
| R cerebellum | 16 | −80 | −32 | 12.5 | |
| L cerebellum | −32 | −56 | −28 | 10.4 | |
| Rest > Task | |||||
| R middle frontal gyrus | 8 | 24 | 20 | 40 | −6.2 |
| R middle frontal gyrus | 9 | 28 | 36 | 28 | −5.1 |
| L superior frontal gyrus | 8 | −20 | 12 | 44 | −7.5 |
| R anterior cingulate gyrus | 32 | 4 | 44 | −4 | −6.4 |
| R precentral gyrus | 6 | 36 | −12 | 36 | −7.6 |
| R parahippocampal gyrus | 36 | 24 | −36 | −12 | −6.9 |
| L parahippocampal gyrus | 36 | −28 | −44 | −12 | −8.0 |
| R posterior cingulate gyrus | 31 | 12 | −32 | 36 | −13.7 |
| R retrosplenial cortex | 18/31 | 16 | −60 | 20 | −10.8 |
| L retrosplenial cortex | 31 | −16 | −64 | 16 | −9.3 |
| R inferior parietal lobe | 39 | 44 | −76 | 24 | −9.0 |
| L superior occipital gyrus | 19 | −32 | −80 | 32 | −7.8 |
| R midbrain | 4 | −20 | −4 | −6.4 | |
| R insula | 40 | −8 | −8 | −5.9 | |
R = right hemisphere; L = left hemisphere; BA = Brodmann’s area; X = right/left; Y = anterior/posterior; Z = superior/inferior; BSR = bootstrap ratio.
The second LV (p < 0.001, accounting for 26% of the covariance) showed the pattern of activity in young adults that we have reported previously (Grigg & Grady, 2010a). The young adults showed a robust increase of activity in a distributed set of brain regions during the Self and Other tasks, an intermediate level of activity in these areas during Baseline, and reduced activity during the Vowel and Motor tasks, which had activation of a different set of areas (Figure 1b). Increased activity in the self tasks relative to the non-self tasks in the younger adults was seen in a number of DN regions, including PCC, ventromedial and dorsomedial PFC, left angular gyrus, bilateral medial temporal regions, left superior frontal gyrus, and bilateral anterior temporal cortices. In addition, strong increases of activity were observed in RN regions, such as bilateral ventral striatum, anterior cingulate gyrus, and thalamus. More activity during the Vowel and Motor tasks relative to the Self and Other tasks was seen in bilateral superior parietal cortex, right dorsolateral PFC, and bilateral occipitotemporal regions (see Table 3 for a list of regions contributing to this LV). The older adults showed a similar pattern of contrasting activity between the self and non-self tasks (Figure 1b). However, two major differences also were noted. There was less activity during the Self and Other conditions, relative to Baseline, in the older adults, unlike younger adults who showed the opposite effect. Also the older adults had less activity than young adults during Self and Other, but more activity during Vowel and Motor than younger adults.
3.3 fMRI – Functional Connectivity
The task analysis indicated that regions related to both the DN and RN were active during the Self and Other tasks, relative to the Vowel and Motor tasks, but provided no information on whether activity in these areas was functionally integrated. That is, the task analysis does not tell us about the functional connections within the networks, or whether these networks function relatively independently of one another, or overlap in their spatial patterns to some degree. To answer these questions we assessed the functional connectivity (via seed-PLS) of the DN using a seed in the PCC, and in the RN using a right ventral striatum region as the seed. We will first describe the results of the seed analyses for the task runs (including the Baseline, Self and Other conditions) and then the functional connectivity patterns identified at rest.
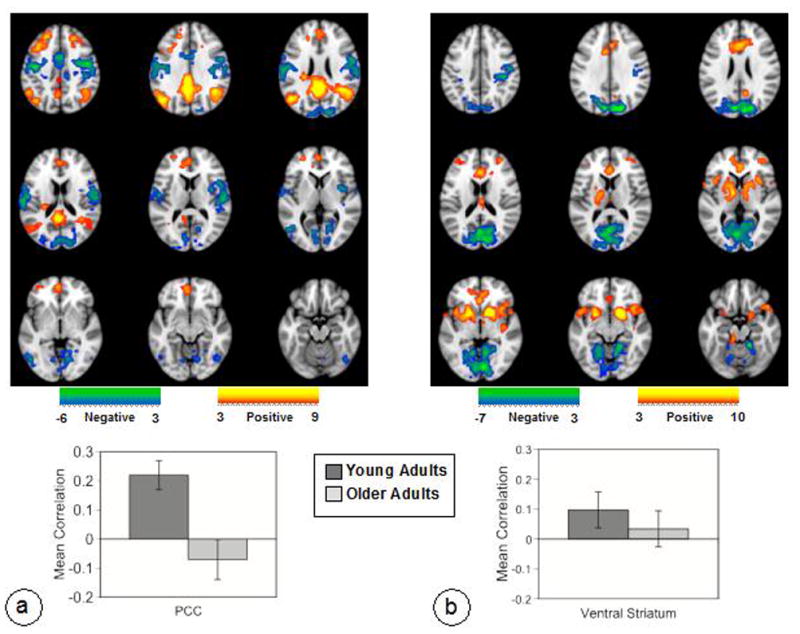
During the Baseline, Self and Other conditions the PCC showed a pattern of functional connectivity that was robustly expressed across all three conditions in younger adults (p < 0.001, 31% covariance, Figure 2a). This connectivity pattern included regions typically reported in studies of DN connectivity (e.g., Buckner, et al., 2008; Fox, et al., 2005; Grigg & Grady, 2010a; Toro, et al., 2008), as well as the inferior frontal gyrus and caudate nucleus bilaterally (Figure 2a and Table 4). In older adults, activity in this set of regions was significantly correlated with the PCC during the Baseline and Other conditions, but not during the Self condition (Figure 2a); in addition, older adults showed weaker connectivity relative to younger adults in the Self condition.
Figure 2.

Functional connectivity of the DN (a) and RN (b) are shown on axial slices from the MNI152 average structural brain. Functional connectivity of the PCC and other DN regions (positive correlations, shown in warm colors) was robust across Baseline, Self and Other conditions in younger adults, and for Baseline and Other in the older group (correlation was not different from zero for Self in older adults). Functional connectivity of the right ventral striatum and the rest of the RN (positive correlations, shown in warm colors) was robust across all three conditions in younger adults, but was not reliably different from zero in the Other condition for older adults. The color bars indicate the minimum and maximum BSRs for each LV (threshold set to BSR=3). The graphs show the correlations between brain scores and seed activity for each condition. Error bars are the 95% confidence intervals from the bootstrap procedure.
Table 4.
Functional Connectivity Patterns of the PCC During Task and Resting-state Runs in Younger and Older Adults
| Task | Resting State | |||||||
|---|---|---|---|---|---|---|---|---|
|
| ||||||||
| Region | X | Y | Z | BSR | X | Y | Z | BSR |
| Positive Correlations | ||||||||
| R superior frontal gyrus | 12 | 32 | 44 | 6.2 | 28 | 36 | 40 | 5.3 |
| L superior frontal gyrus | −16 | 28 | 52 | 8.5 | −16 | 28 | 52 | 4.6 |
| Dorsomedial frontal | −4 | 56 | 24 | 6.1 | 4 | 48 | 24 | 4.3 |
| Ventromedial frontal | 0 | 44 | −12 | 9.1 | −4 | 56 | −8 | 5.4 |
| L inferior frontal gyrus | −40 | 12 | 40 | 5.6 | −32 | 20 | 44 | 9.0 |
| R inferior parietal | 56 | −56 | 28 | 7.4 | 44 | −48 | 28 | 7,6 |
| L inferior parietal | −52 | −56 | 20 | 8.1 | −44 | −64 | 24 | 6.8 |
| R cerebellum | 36 | −60 | −44 | 7.3 | 28 | −76 | −32 | 5.7 |
| L cerebellum | −16 | −32 | −44 | 6.4 | −16 | −76 | −28 | 5.7 |
| R inferior frontal gyrus | 36 | 36 | −20 | 8.8 | ||||
| L inferior frontal gyrus | −40 | 36 | −12 | 6.7 | ||||
| R middle temporal | 64 | −16 | −20 | 6.4 | ||||
| L middle temporal | −56 | −24 | −8 | 7.1 | ||||
| R caudate | 20 | 28 | −8 | 4.2 | ||||
| L caudate | −16 | 12 | 4 | 4.7 | ||||
| L medial temporal lobe | −28 | −20 | −24 | 5.8 | ||||
| L superior frontal gyrus | −24 | 56 | 4 | 4.1 | ||||
| Negative Correlations | ||||||||
| Middle cingulate gyrus | 8 | 8 | 44 | −6.2 | ||||
| R cuneus | 20 | −94 | 24 | −5.1 | ||||
| R lingual gyrus | 28 | −52 | 0 | −4.6 | ||||
| R fusiform gyrus | 48 | −64 | −12 | −4.5 | ||||
| L fusiform gyrus | −44 | −64 | −8 | −4.4 | ||||
| R insula | 40 | 0 | 12 | −5.0 | ||||
| L precentral gyrus | −36 | −12 | 40 | −6.0 | ||||
| R postcentral gyrus | 40 | −16 | 28 | −6.4 | ||||
R = right hemisphere; L = left hemisphere; BA = Brodmann’s area; X = right/left; Y = anterior/posterior; Z = superior/inferior; BSR = bootstrap ratio.
The pattern of functional connectivity seen with the ventral striatum seed (p < 0.001, 33% covariance; Figure 2b) was consistent with previous papers on the RN (Camara, et al., 2009; Cauda, et al., 2011; Krebs, et al., 2011; Ye, et al., 2011), and included bilateral ventral striatum, vmPFC and anterior cingulate, dorsomedial PFC, thalamus, and the ventral tegmental area (Figure 2b and Table 5). Additional connectivity was seen in regions of temporal and parietal cortex and the left insula. This pattern of connectivity was seen across all three conditions in young adults, but was reliable only for Baseline and Self in older adults, not for Other. Older adults also showed weaker connectivity relative to younger adults in the Other condition. Interestingly, no robust negative correlations were seen for either the ventral striatum or PCC seed during the Baseline, Self and Other conditions.
Table 5.
Functional Connectivity Patterns of the Ventral Striatum During Task and Resting-State Runs in Younger and Older Adults
| Task | Resting-state | |||||||
|---|---|---|---|---|---|---|---|---|
|
| ||||||||
| Region | X | Y | Z | BSR | X | Y | Z | BSR |
| Positive Correlations | ||||||||
| L striatum | −12 | 8 | 0 | 13.9 | −16 | 12 | −4 | 7.4 |
| Dorsomedial frontal | 8 | 36 | 28 | 6.0 | 4 | 28 | 20 | 5.8 |
| Ventromedial frontal | 16 | 44 | −8 | 7.8 | 4 | 32 | −4 | 6.3 |
| R middle frontal gyrus | 52 | 40 | 12 | 4.9 | 36 | 52 | 16 | 5.1 |
| L insula | −36 | 4 | 0 | 6.7 | −36 | 12 | −4 | 5.1 |
| L precentral gyrus | −44 | −16 | 40 | 4.9 | ||||
| R inferior parietal | 60 | −40 | 20 | 4.9 | ||||
| L middle temporal | −44 | −68 | 8 | 4.7 | ||||
| R cerebellum | 28 | −40 | −28 | 6.3 | ||||
| Ventral tegmental area | 0 | −24 | −28 | 7.0 | ||||
| R insula | 44 | −12 | −4 | 4.7 | ||||
| L thalamus | −16 | −8 | 12 | 4.7 | ||||
| Negative Correlations | ||||||||
| R postcentral gyrus | 44 | −28 | 44 | −7.8 | ||||
| L postcentral gyrus | −24 | −32 | 48 | −5.7 | ||||
| R cuneus | 20 | −80 | 32 | −9.9 | ||||
| L cuneus | −4 | −80 | 28 | −6.7 | ||||
| R lingual gyrus | 8 | −80 | −4 | −7.2 | ||||
| R cerebellum | 20 | −40 | −16 | −7.3 | ||||
| L cerebellum | −16 | −48 | −12 | −5.0 | ||||
R = right hemisphere; L = left hemisphere; BA = Brodmann’s area; X = right/left; Y = anterior/posterior; Z = superior/inferior; BSR = bootstrap ratio.
These patterns of functional connectivity for the PCC and striatum appeared to overlap substantially with the regions that showed more activity for the Self and Other tasks (LV2 from the task-PLS), but to be largely non-overlapping with each other. To assess this, we constructed overlap maps between the spatial patterns from the two seed analyses (done on the Baseline, Self and Other conditions) and the second LV from the task-PLS, which maximally distinguished Self and Other from Vowel and Motor. Although the task-related pattern of activity was more extensive than the functional connectivity patterns, there was considerable overlap between the task-related activity and functional connectivity in the DN and RN (Figure 3). This overlap included the major nodes for each network, supporting the idea that both networks were active during the Self and Other conditions. For the DN (Figure 3a), this overlap included the left inferior frontal gyrus, vmPFC, left inferior parietal lobe, left superior frontal gyrus, and bilateral temporal lobes, in addition to the PCC. Overlap between the task-related pattern and RN functional connectivity included bilateral ventral striatum, ventral and dorsal regions of the anterior cingulate, left inferior frontal gyrus, left thalamus and midbrain (Figure 3b). Although there were general brain areas where both functional connectivity patterns overlapped with the task pattern, the specific areas were different. For example, although both DN and RN overlapped with the task pattern in anterior/medial portions of the brain, the RN overlapped with the task pattern in the anterior cingulate, whereas the DN overlapped primarily in ventromedial and dorsomedial regions of PFC. In addition, the region of left inferior frontal gyrus where the DN overlapped with the task pattern was anterior to the overlapping region between the RN and the task pattern. These overlap maps indicated that both the DN and RN, as defined by the seeds, are engaged during the Self and Other tasks, but also suggested that the two networks are largely different in terms of the brain regions that are involved. This was confirmed by assessing the overlap of the two functional connectivity patterns (see Supplementary Figure 1). There were small regions of overlap in bilateral striatum and anterior cingulate, but otherwise the two connectivity patterns were distinct.
Figure 3.

Overlap maps for the two functional connectivity patterns (seen in figure 2) and the second task LV (seen in Figure 1b) are shown on axial slices from the MNI152 average structural brain. Red areas are those where there was more activity for the Self and Other tasks (relative to Vowel and Motor), green areas are those with positive functional connectivity with either the PCC (a) or the right ventral striatum (b), and yellow areas are those with overlap between the task and functional connectivity maps. A BSR threshold of 3.0 was used for all images in these maps.
The primary functional connectivity patterns of the PCC and ventral striatum during the resting-state run (both p < 0.001) very much resembled the patterns seen in Figure 2 (see Supplementary Figure 2). Both younger and older adults showed strong connectivity within the networks across the resting time series (see Supplementary Figure 3), and there were no age differences in the overall strength of these correlations for either seed (both t’s < 1). However, both seed analyses also identified secondary connectivity patterns (DN, accounting for 5% covariance, p < 0.001; RN, accounting for 4% covariance, p < 0.001). These secondary LVs showed a less stable pattern of functional connectivity over time, such that some of the resting blocks were characterized by positive functional connectivity within the DN and RN (warm colored regions in Figure 4), and other blocks were characterized by connectivity in a different set of regions that, as a group, were negatively correlated with the DN and RN (cool colors in Figure 4; See also Supplementary Figure 4). For this reason, the mean correlation values across the entire resting scan (shown in Figure 4) were not strongly positive. In addition, there was a significant age difference in the correlation distributions for the DN (t(58) = 3.5, p < 0.01). Younger adults showed stronger connectivity within DN regions (Figure 4a, warm colors), whereas older adults had stronger connectivity in the set of regions anti-correlated with the DN (Figure 4a, cool colors), which included sensorimotor cortices and occipital cortex (Table 4; see also Supplementary Figure 4). In contrast, there were no age differences in the secondary RN connectivity pattern (Figure 4b, t < 1). Although an alternate network, negatively correlated with the RN, was identified, there was no age difference in the relative strength of the expression of these two networks over the resting state run (Supplementary Figure 4). The anti-correlated network for the RN also included sensorimotor and occipital regions (Table 5), as did the DN anti-correlated network, although these regions were more extensive in occipital cortex for the RN and in sensorimotor regions for the DN.
Figure 4.
Secondary functional connectivity patterns of the DN (a) and RN (b) during the resting-state scan are shown on axial slices from the MNI152 average structural brain. Functional connectivity of both networks was temporally variable, with some time periods showing connectivity within the DN and RN (warm colors) and others showing connectivity within the cool colored regions. The graphs show the mean correlation (across the 30 resting “blocks”) between brain scores and seed activity for each group. Error bars are the standard error of the mean. See Supplementary Figure 4 for the full time courses of correlation values.
These functional connectivity results suggested that although the DN and RN showed robust connectivity during the task runs and the resting-state runs in both younger and older adults, older adults showed some evidence of weaker functional connectivity. To explore these age differences in functional connectivity further, we calculated correlations among the brain scores from the task and resting seed-PLS analyses. These correlations did not assess functional connectivity directly (because this was calculated across participants, individual measurements of connectivity were not available), but rather assessed the degree to which expression of the network patterns of functional connectivity identified for the PCC and ventral striatum were correlated across the task conditions and resting state. Four correlations were calculated in each group to assess associations within rest, within task, and across rest and task: 1) the average of the DN brain scores at rest (from LV2) vs. the average RN brain scores at rest (also from LV2); 2) DN brain scores from the Self condition vs. RN brain scores from the Other condition; 3) DN-Self vs. DN-Rest; and 4) RN-Other vs. RN-Rest. All significant correlations reported here also were reliable according to 95% CIs (determined via 1000 bootstraps).
Both groups showed significant positive correlations between DN and RN network activity at rest (Figure 5a), and the young group also showed a positive correlation between network activity scores during the task conditions (Figure 5b). This indicates that, at least during rest, participants with higher expression of the DN also showed higher expression of the RN, despite the relative lack of spatial overlap between the two networks. Correlations between resting and task network activity for the DN were not reliable in either group (Figure 5c). The same was true for the RN (Figure 5d); however the two correlations differed between the age groups (Z = 2.42, p < 0.02). That is, those younger adults with higher RN activity at rest tended to show higher activity during the task, whereas the opposite was true for older adults.
Figure 5.
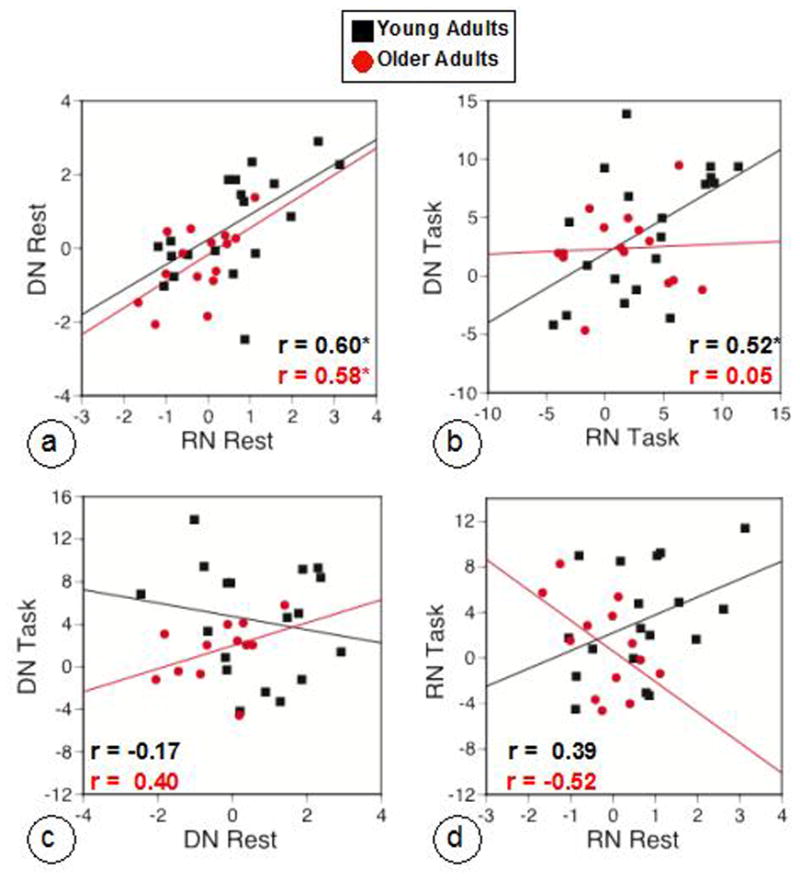
Scatter plots for the correlations among the network activity patterns for the DN and RN. a: the correlation between brain scores from the resting seed PLS of the PCC (DN, LV2) and ventral striatum (RN, LV2), with more positive brain scores indicating more activity in the DN and RN regions seen in Figure 4; b: the correlation between brain scores from the task-run seed PLS of the PCC (Self condition) and ventral striatum (Other condition), with more positive brain scores indicating more activity in the DN and RN regions seen in Figure 2; c: the correlation between brain scores from the task-run seed PLS of the PCC (Self condition) and resting seed PLS for the PCC; d: the correlation between brain scores from the task-run seed PLS of the ventral striatum (Other condition) and resting seed PLS for the striatum. Correlation coefficient values are shown for young (black) and older (red) adults; ‘*’ denotes p < 0.05. Note that the sample sizes for older adults in the rest-task correlations are smaller than for the within-rest or within-task comparisons due to some older participants not having usable task data or rest data.
3.4 Relations among Personality Scores, Trait Ratings and Brain Measures
Finally, we wished to determine if the individual expression of the patterns of activity indentified by the task and seed analyses were related to the endorsement of positive and negative traits for Self and Other, or to the personality measures. Because the positive and negative trait ratings were negatively correlated, and significantly so for Other judgments (r = −0.74, p < 0.001 in young; r = −0.67, p < 0.01 in old), we created a single measure for Self and Other conditions by subtracting the proportion of ‘yes’ responses to negative words from that for positive words. Thus, a higher score reflects more endorsements of positive traits and/or fewer endorsements of negative traits, whereas a lower score reflects the opposite trend. To assess the relations among the brain and behavior variables we carried out four regression analyses for each age group, to predict the Self and Other trait ratings, and agreeableness and conscientiousness from the NEO (the two traits where there were age differences). The analyses of the Self and Other ratings used as predictors those variables most relevant to these ratings: 1) for the Self rating, the predictors were the two personality measures, the brain scores from the Self task (LV2, where there was an age difference), and the brain scores from the Self condition in the task-run PCC functional connectivity analysis (again, where there was an age difference); 2) for the Other rating, the predictors were the two personality measures, the brain scores from the Other task, and the brain scores from the Other condition in the ventral striatum functional connectivity analysis. Because the personality scores could be related either to Self or Other measures, the two models for these scores included Self/Other ratings as well as the brain scores from the Self and Other task and connectivity analyses2.
The model for Self ratings in younger adults was significant (F(4,15) = 5.0, p < 0.01), with agreeableness being the only significant predictor (β = 0.65, t = 2.9, p < 0.05). The analysis for agreeableness also was significant (F(6,13) = 9.5, p < 0.001). Three variables predicted agreeableness in younger adults: Self ratings (β = 0.47, t = 3.1, p < 0.01), Other ratings (β = 0.41, t = 3.2, p < 0.01), and brain activity during the Self task (β = −0.73, t = −2.9, p < 0.05). These results indicate a robust relation between agreeableness and more positive Self ratings. In addition, those younger adults who were more likely to endorse positive traits for themselves, and their close other, but showed less activity in DN and RN regions during the Self task, scored higher on agreeableness. The models for Other ratings and for conscientiousness were not significant in younger adults (F < 1). None of the models for the older adults was significant, although there was a trend for Self ratings (F(4,11) = 2.7, p = 0.08; p > 0.20 for other analyses), and, like young adults, agreeableness was the only predictor (β = 0.67, t = 3.0, p < 0.05). Thus, although there were some associations among behavioral measures in both age groups, only agreeableness in young adults showed any relation to the brain measures.
4. Discussion
In the current study we examined age differences in brain activity, with a focus on the default and reward networks, during internally-focused tasks requiring judgments about personality traits. In terms of behavior on the tasks, younger adults endorsed more negative traits, relative to the older adults, whereas older adults endorsed more positive traits. We found a distributed pattern of activity that characterized all the tasks, relative to Baseline, as well as one that differentiated the two self-relevant tasks from the non-self tasks. The DN and RN were more active during the Self and Other tasks in both groups, but this activity was lower in the older adults. We also examined functional connectivity of the DN and RN in the three conditions where a self-related focus was more likely (Baseline, Self and Other). We found robust functional connectivity within the networks during Baseline in both age groups, but these functional interactions were weaker during Self and Other in the older adults. Intrinsic functional connectivity in the DN was also weaker in the older adults, whereas the connectivity of the RN at rest was equivalent in the two age groups, suggesting greater vulnerability overall of the DN.
4.1 Task Performance
Only the younger adults showed differences in RT across the tasks. However, the only age difference in RT was during the Motor condition, so that overall, response times were similar between younger and older adults. The most interesting behavioral result was the difference in the degree to which younger and older adults endorsed positive and negative traits for both themselves and their close other. Older adults endorsed positive traits more often than did younger adults, whereas younger adults were more likely to endorse negative traits. Older adults also were slower than young adults to endorse negative traits, suggesting that this required more consideration of their own qualities and those of their close other. This finding differs from our earlier work, in which no age differences in self ratings were found (Keightley, et al., 2006), but is consistent with numerous reports of a negative emotional bias in younger adults and a positive emotional bias in older adults (e.g., Charles, et al., 2003; Mather & Carstensen, 2003; Murphy & Isaacowitz, 2008; Spaniol, et al., 2008). Older adults also scored more highly on agreeableness, consistent with this type of positivity bias and with reports of more positive affect or mood in older relative to younger adults (Gross et al., 1997; Lawton, Kleban, Rajagopal, & Dean, 1992) and with reported age differences in personality traits (e.g., McCrae, et al., 1999; McCrae, et al., 2005).
This type of positivity bias in older adults has been somewhat elusive in the literature (for a review see Murphy & Isaacowitz, 2008), but this may be because of sampling issues. That is, when a relatively small sample size is studied, that particular group of older adults may or may not have better mood, or rate themselves higher on some personality traits, and may or may not show an emotional bias on the specific tasks under study. When very large samples are studied (Stone, Schwartz, Broderick, & Deaton, 2010), or longitudinal designs are used (Carstensen et al., 2011), the trend for greater positivity in older adults is quite robust. Our results fit nicely with this idea and indicate that the positivity effect can be found with relatively simple personality trait judgments.
4.2 Task-Related Brain Activity
There were two whole-brain patterns that distinguished Self and Other tasks from the Vowel and Motor tasks. The first was a general task-related pattern that was recruited during all the tasks, relative to Baseline, but also was engaged to a greater degree by the Self and Other tasks. These areas included those that would be involved in basic processing of the stimuli, such as occipital and temporal lobe areas involved in visual perception of words (e.g., Dehaene, Le Clec, Poline, Le Bihan, & Cohen, 2002; Price et al., 1994), rostral prefrontal cortex important for cognitive control (Bunge, Helskog, & Wendelken, 2009; Vincent, Kahn, Snyder, Raichle, & Buckner, 2008), and left frontal and temporal regions involved in semantic processing (e.g., Thompson-Schill, 2003; Turkeltaub, Eden, Jones, & Zeffiro, 2002; Wagner, Pare-Blagoev, Clark, & Poldrack, 2001). Our finding of greater activity in these areas during Self and Other, relative to Vowel and Motor, indicates greater demand on these processes during the self-related tasks despite the similarity in stimuli and response characteristics across tasks. This difference in task demand also was reflected in the longer RTs for the Self and Other tasks in young adults. This RT effect was not seen in the older adults, although this certainly does not rule out differences in cognitive demand across the tasks in this group.
The second set of regions active during the Self and Other tasks was spatially distinct from regions involved during the Vowel and Motor tasks, and included areas corresponding to both the DN and RN. We have reported this result previously in the young adults (Grigg & Grady, 2010a), and suggested that the DN as a whole is involved in constructing or simulating a social context that involves processing information about the self and other people. Activity in the ventral striatum and other reward-related areas is consistent with the idea that the processes involved in self-reference and reward are closely linked and highly interactive (Northoff & Hayes, 2011). Along with the DN and RN, regions active during the Self and Other conditions included the left inferior frontal gyrus and anterior insula, which may be related to stimulus salience (Seeley et al., 2007), autobiographical memory processes (Addis, et al., 2004; Burianova & Grady, 2007; Maguire & Frith, 2003), or access to the semantic knowledge thought to underlie the type of personality judgments required by our tasks (Klein & Gangi, 2010).
The areas with the opposite pattern of activity, i.e., more active for the Vowel and Motor tasks, were limited to inferior/superior parietal lobes and middle temporal gyri. Both of these areas of cortex are considered to be part of a network that is more active during externally driven tasks, such as our Vowel and Motor tasks, relative to internally-focused tasks or periods of rest (e.g., Grady, et al., 2010; Toro, et al., 2008). This external-task related network also is sometimes anti-correlated with the DN (Fox, et al., 2005). Activity in these areas during our Vowel and Motor tasks can best be interpreted as a reflection both of this inverse relation between the DN and task network, and of the general attentional and visual processing needed for the external tasks.
4.3 Age differences in Task-related activity
The pattern of activity differentiating the self-relevant from the non-self tasks in younger adults was lowest during the non-self tasks, higher during spontaneous internal thought that takes place during Baseline blocks, and higher still during the tasks that specifically required a judgment about personally-relevant information. In contrast, this pattern of activity was engaged to its greatest extent in older adults during Baseline, with lower activity during Self and Other, and the least activity during the Vowel and Motor tasks. In addition, older adults engaged the Self/Other pattern of activity to a lesser degree than the younger adults. Thus, although the older adults showed differentiation between the self and non-self tasks in the same set of regions that showed this differentiation in young adults, the extent to which this activity was recruited was reduced with age. This reduction in self-relevant activity in the older adults may be related to their greater tendency to endorse positive over negative traits. That is, there was a significant age difference for both positive and negative ratings, as well as an age difference in the brain activity that accompanied these ratings. This suggests the intriguing idea that more engagement of the DN and/or RN during these kinds of self-relevant tasks may be associated with greater negativity in one’s outlook, as well as with younger age. This interpretation is consistent with the hypothesized relation between over-active DN activity and a negative self focus in depression (Lemogne, Delaveau, Freton, Guionnet, & Fossati, 2012), and with the association found here between increased activity during the Self condition and lower agreeableness scores in the younger adults.
Additionally, the age reduction in self-relevant activity in older adults could reflect a reduced dynamic range of activity in these brain networks, relative to their younger counterparts. This interpretation is consistent with recent evidence that older adults have reduced variability in the fMRI brain signal relative to younger adults during both baseline and task periods (Garrett, Kovacevic, McIntosh, & Grady, 2010, 2011), a finding that also suggests less dynamic fluctuation in older adults’ brain activity. Our finding here of smaller activity increases in the DN during internally-driven tasks, coupled with reports that older adults have a smaller reduction in DN activity during some externally-driven tasks relative to young adults (Grady, et al., 2010; Grady, et al., 2006; Lustig, et al., 2003), also would be consistent with this idea of a smaller dynamic range.
We also found that engagement of superior parietal and occipital regions during the Vowel and Motor tasks, relative to Self and Other, was larger in the older adults. This result is similar to a finding from one of our earlier studies reporting data from a set of purely externally-driven tasks relative to a fixation condition (Grady, et al., 2010). In that study, older adults showed greater engagement of similar parietal and occipital areas, as well as some dorsolateral PFC regions, compared to younger adults during attention and working memory tasks. That finding of greater activity in areas related to general task performance (i.e., the task positive network, Grady, et al., 2010; Spreng, Wojtowicz, & Grady, 2010), taken together with our current results, and the numerous reports of age differences in the DN (e.g., Andrews-Hanna, et al., 2007; Lustig, et al., 2003), support the idea that the balance between the DN and the task network is altered with age and that this alteration can have an impact on multiple cognitive domains (Grady, et al., 2006).
4.4 Functional Connectivity
For both the DN and RN, we found patterns of connectivity that were strongly expressed in younger adults during the Baseline, Self and Other conditions, and during a resting-state scan. The regions involved in these patterns of connectivity were quite similar to other reports of connectivity in these networks (e.g., Cauda, et al., 2011; Toro, et al., 2008), indicating that our seed-PLS analyses demonstrate reasonable instantiations of these two networks that are robust under conditions in which they would be expected to be relevant. Indeed, the regions that we identified in our task analysis and chose for our seeds are very similar to regions identified with quite different tasks and/or used as seeds by other researchers (e.g., Andrews-Hanna, et al., 2010; Camara, et al., 2009; Krebs, et al., 2011; Toro, et al., 2008), suggesting that the same regions of PCC and ventral striatum are critically involved in a variety of cognitive states that would modulate activity in the DN and RN.
Our analyses also show several novel and important aspects to these networks. First, the substantial overlap between the functional connectivity patterns identified during the Self and Other tasks and the areas that showed increased activity specifically during these tasks supports the idea that both networks were involved in this task effect. That is, the processing needed to carry out the self-relevant tasks involved increased activity in both the DN and the RN, adding further support to the idea that self and reward are intimately linked. Secondly, although these two networks were both involved in self-relevant processing, their contributions to the Self/Other task effect and their functional connectivity patterns were relatively distinct spatially. Therefore, these two networks participate in self-relevant processing but appear to make relatively independent contributions in terms of the brain regions involved. Nevertheless, the individual expressions of activity in the DN and RN, as seen during the Self/Other tasks and at rest (in the secondary connectivity patterns), were positively correlated, especially in younger adults. This suggests that these two networks can be engaged to a similar degree, providing additional support for a close link between self and reward. In addition, given that there were some restricted regions of overlap in the functional connectivity patterns of the DN and RN in anterior cingulate and striatum, future work should examine whether these regions represent points of convergence and communication between the two networks.
A third interesting aspect of our data is that the functional connectivity patterns that emerged from the task conditions were quite similar, but not identical, to the ones that resulted from the resting-state seed analyses. An obvious difference was the negative correlations evident in the resting-state pattern that were not seen in the task pattern. We have previously noted that when using PLS to assess resting-state functional connectivity in the DN, the first LV contains only positive correlations that are robust across the entire resting run, whereas the second shows a more restricted set of regions with positive connectivity and a less temporally stable pattern of correlations, with switching between the DN and an alternate network that is negatively correlated with it (Grigg & Grady, 2010b). The current study shows that this is also true for the RN, and suggests that both the DN and RN have some aspects of their connectivity that are temporally and spatially dynamic. It also was the case that the functional connectivity patterns identified during the task conditions included regions not seen in either the primary or secondary resting connectivity pattern. These included some regions in bilateral inferior PFC and left caudate for the DN, and left premotor, left temporal, and ventral tegmental regions for the RN. This suggests that a core set of regions in both the DN and RN shows strong functional connectivity regardless of whether this is assessed during a task or at rest, but that other regions may be recruited into the network depending on task demands.
4.5 Age Differences in Functional Connectivity
The older group had robust functional connectivity of the DN during Baseline and Other conditions, but not during Self, and intrinsic functional connectivity at rest also was reduced relative to the younger adults. Weaker connectivity in the DN has been shown a number of times in older adults when functional connectivity has been measured during resting-state scans or fixation (Andrews-Hanna, et al., 2007; Grady, et al., 2010; Hedden, et al., 2009; Park, et al., 2010), or during externally-driven tasks (Sambataro, et al., 2010). Our findings of reduced DN connectivity at rest and during a self-reference task suggest that the processes involved in making judgments about the self rely heavily on the functional connectivity of the DN in younger adults, but that the involvement of this network for self-reference is less consistent in older adults.
We also found that functional connectivity in the RN was weaker in the older adults during the Other condition, similar to the weakened connectivity in the DN with age. This, along with reduced activity in this network during the Self and Other conditions, is in line with earlier reports of age differences in activation in reward related regions during tasks that directly tap into the learning and processing of the rewarding properties of stimuli (Dreher, et al., 2008; Mell, et al., 2009). However, the intrinsic functional connectivity of the RN was not reduced in older relative to younger adults, suggesting that age differences in this network are sensitive to task demands but not necessarily present in the basic underlying functional connections of these regions. This finding also suggests that the DN may be more vulnerable overall to the effects of older age, consistent not only with the many reports of age differences in this network, but also with the predilection of Alzheimer-related degenerative processes for some of the DN’s nodes (Buckner et al., 2009; Sperling et al., 2009).
It is not clear why the functional connectivity of the DN should be disrupted in older adults for the Self condition and connectivity in the RN reduced with age only during the Other condition. One, admittedly speculative, explanation could be that although both the DN and RN participate in the tasks used here, the DN may be more closely tied to the specific type of self processing employed and the RN to processing of information about other people. If so, the age differences might reflect task-specific differences in the link between these processes and network connectivity, perhaps due to strategy differences in the way young and older adults approach the tasks. Understanding the specific age difference in the DN for the Self task and in the RN for the Other task clearly will require further study, but this pattern of effects does suggest an age-related shift in the balance between DN and RN engagement during these kinds of tasks, as suggested above for the DN and the task-positive network.
In terms of the relations among network expression at rest and during the task, we found that in general these correlations were not particularly strong, but were generally positive in both groups. This indicates that there is some co-activation of the DN and RN, providing further support for a strong link between the self and reward. The only reliable age difference in these correlations was found in the association between network activity in the RN during task performance and at rest. Younger adults who showed more RN activity at rest tended also to show more activity during the Other task, whereas older adults showed the opposite effect. This finding, along with the age difference in functional connectivity of the RN during the Other task, suggests that task-related modulation of network engagement may differ with age. However, given that neither of the within-group correlations between task and resting RN expression was significant, any interpretation of the age difference in the correlations is tentative. At this point, we can conclude that there is some consistency in the degree of network expression across various cognitive states, in both younger and older adults, and that an understanding of age differences in this consistency will need further exploration.
4.6 Correlations between Brain and Behavioral Indices
The associations that we observed between agreeableness and the tendency to rate oneself in a more positive light are not surprising, but do indicate a consistency in how our participants carried out these judgments. In addition, this relation, along with the age difference in agreeableness, may explain the difference in results between the current study and our earlier paper that found no age differences in self ratings (Keightley, et al., 2006). That earlier study reported no age differences in either agreeableness or self ratings, so differences across samples in personality scores, coupled with a relation between personality traits such as agreeableness and self ratings, could result in inconsistent findings of age effects in these ratings.
The degree to which individuals expressed the patterns of task- or connectivity-related network activity did not predict their tendency to endorse positive and negative trait words. However, in the younger group, increased task-related activity during the Self condition, along with more negative Self and Other ratings, was associated with lower agreeableness scores. This suggests that more activity during social judgments in DN and RN regions may indicate a strategy for these judgments that emphasizes negative aspects, particularly in those younger adults who score low on agreeableness. In addition, this association among negative self-assessments, personality, and stronger engagement of these brain networks is interesting in light of the considerable research showing that younger adults tend to have more negative affect than older adults (e.g., Carstensen, et al., 2011; Stone, et al., 2010), and our finding that older adults have weaker activation and functional connectivity in the DN. That is, if older adults modulate their emotional responses to be more positive, in line with their motivational goals (Carstensen, et al., 2003; Mather & Carstensen, 2005), and activity in the DN is associated with cognitive processes leading to greater negativity, then reduced DN engagement and/or functional connectivity during social cognitive tasks may be a reflection of these goals. It should be noted, however that these interpretations of the relation between DN activity and self-relevant judgments are tentative, given that older adults did not show any significant associations among the brain measures and behavior.
4.7 Conclusions
In this experiment we examined activity and functional connectivity in two distinct brain networks to identify modulations during processing of information relevant to the self. Both younger adults and older adults had more activity in regions associated with the default and reward networks during tasks requiring them to judge themselves and a close other in terms of personality traits, consistent with ideas of the self concept that link it tightly to reward processing. The finding that the activation of these networks was significantly less in the older adults, coupled with weaker functional connectivity in these networks during the self-relevant tasks in the older group, suggest that both the DN and RN contribute less consistently to this type of social judgment with aging, which may be related to the types of judgments that they make. It may also be the case that older adults have a smaller dynamic range of activity in the DN and RN. Finally, we also found that increased engagement of the DN and RN during self judgments and more negative self assessments in younger adults were predictive of lower agreeableness, which, combined with reduced activity and connectivity of these networks in older adults, is consistent with the often reported “positivity bias” in aging.
Supplementary Material
Acknowledgments
The authors would like to Annette Weeks-Holder and staff of the Baycrest fMRI centre for technical assistance. This work was supported by the Canadian Institutes of Health Research (MOP14036 to CLG), the Canada Research Chairs program, the Ontario Research Fund, the Canadian Foundation for Innovation, and the Heart and Stroke Foundation Centre for Stroke Recovery.
Footnotes
Note that this approach provides results comparable to those obtained when using ANOVA to contrast group means per condition, with corrections for multiple comparisons.
Mean values, calculated within group, were used for missing values (one young participant was omitted from the seed-PLS for the PCC and one did not have behavior recorded during the scans; one older adult did not take the NEO and one was omitted from the seed-PLS for the PCC).
References
- Abler B, Walter H, Erk S, Kammerer H, Spitzer M. Prediction error as a linear function of reward probability is coded in human nucleus accumbens. NeuroImage. 2006;31:790–795. doi: 10.1016/j.neuroimage.2006.01.001. [DOI] [PubMed] [Google Scholar]
- Addis DR, McIntosh AR, Moscovitch M, Crawley AP, McAndrews MP. Characterizing spatial and temporal features of autobiographical memory retrieval networks: a partial least squares approach. Neuroimage. 2004;23:1460–1471. doi: 10.1016/j.neuroimage.2004.08.007. [DOI] [PubMed] [Google Scholar]
- Ames DL, Jenkins AC, Banaji MR, Mitchell JP. Taking another person’s perspective increases self-referential neural processing. Psychological Science. 2008;19:642–644. doi: 10.1111/j.1467-9280.2008.02135.x. [DOI] [PubMed] [Google Scholar]
- Anderson N. Likeableness ratings of 555 personality trait adjectives. Journal of Personality and Social Psychology. 1968;9:272–279. doi: 10.1037/h0025907. [DOI] [PubMed] [Google Scholar]
- Andrews-Hanna JR, Reidler JS, Sepulcre J, Poulin R, Buckner RL. Functional- anatomic fractionation of the brain’s default network. Neuron. 2010;65:550–562. doi: 10.1016/j.neuron.2010.02.005. [DOI] [PMC free article] [PubMed] [Google Scholar]
- Andrews-Hanna JR, Snyder AZ, Vincent JL, Lustig C, Head D, Raichle ME, Buckner RL. Disruption of large-scale brain systems in advanced aging. Neuron. 2007;56:924–935. doi: 10.1016/j.neuron.2007.10.038. [DOI] [PMC free article] [PubMed] [Google Scholar]
- Behrens TE, Hunt LT, Woolrich MW, Rushworth MF. Associative learning of social value. Nature. 2008;456:245–249. doi: 10.1038/nature07538. [DOI] [PMC free article] [PubMed] [Google Scholar]
- Bellebaum C, Kobza S, Thiele S, Daum I. Processing of expected and unexpected monetary performance outcomes in healthy older subjects. Behavioral Neuroscience. 2011;125:241–251. doi: 10.1037/a0022536. [DOI] [PubMed] [Google Scholar]
- Buckner RL, Andrews-Hanna JR, Schacter DL. The brain’s default network: anatomy, function, and relevance to disease. Annals of the New York Academy of Science. 2008;1124:1–38. doi: 10.1196/annals.1440.011. [DOI] [PubMed] [Google Scholar]
- Buckner RL, Carroll DC. Self-projection and the brain. Trends in Cognitive Science. 2007;11:49–57. doi: 10.1016/j.tics.2006.11.004. [DOI] [PubMed] [Google Scholar]
- Buckner RL, Sepulcre J, Talukdar T, Krienen FM, Liu H, Hedden T, Andrews-Hanna JR, Sperling RA, Johnson KA. Cortical hubs revealed by intrinsic functional connectivity: mapping, assessment of stability, and relation to Alzheimer’s disease. Journal of Neuroscience. 2009;29:1860–1873. doi: 10.1523/JNEUROSCI.5062-08.2009. [DOI] [PMC free article] [PubMed] [Google Scholar]
- Bunge SA, Helskog EH, Wendelken C. Left, but not right, rostrolateral prefrontal cortex meets a stringent test of the relational integration hypothesis. NeuroImage. 2009;46:338–342. doi: 10.1016/j.neuroimage.2009.01.064. [DOI] [PMC free article] [PubMed] [Google Scholar]
- Burianova H, Grady CL. Common and unique neural activations in autobiographical, episodic, and semantic retrieval. Journal of Cognitive Neuroscience. 2007;19:1520–1534. doi: 10.1162/jocn.2007.19.9.1520. [DOI] [PubMed] [Google Scholar]
- Camara E, Rodriguez-Fornells A, Munte TF. Functional connectivity of reward processing in the brain. Frontiers in Human Neuroscience. 2009;2:article 19. doi: 10.3389/neuro.09.019.2008. [DOI] [PMC free article] [PubMed] [Google Scholar]
- Carstensen LL, Fung HF, Charles ST. Socioemotional selectivity theory and the regulation of emotion in the second half of life. Motivation and Emotion. 2003;27:103–123. [Google Scholar]
- Carstensen LL, Turan B, Scheibe S, Ram N, Ersner-Hershfield H, Samanez-Larkin GR, Brooks KP, Nesselroade JR. Emotional experience improves with age: evidence based on over 10 years of experience sampling. Psychology and Aging. 2011;26:21–33. doi: 10.1037/a0021285. [DOI] [PMC free article] [PubMed] [Google Scholar]
- Cauda F, Cavanna AE, D’Agata F, Sacco K, Duca S, Geminiani GC. Functional Connectivity and Coactivation of the Nucleus Accumbens: A Combined Functional Connectivity and Structure-Based Meta-analysis. Journal of Cognitive Neuroscience. 2011;23:2864–2877. doi: 10.1162/jocn.2011.21624. [DOI] [PubMed] [Google Scholar]
- Charles ST, Mather M, Carstensen LL. Aging and emotional memory: the forgettable nature of negative images for older adults. Journal of Experimental Psychology: General. 2003;132:310–324. doi: 10.1037/0096-3445.132.2.310. [DOI] [PubMed] [Google Scholar]
- Conway MA, Pleydell-Pearce CW. The construction of autobiographical memories in the self-memory system. Psychological Review. 2000;107:261–288. doi: 10.1037/0033-295x.107.2.261. [DOI] [PubMed] [Google Scholar]
- Costa PT, McCrae RR. Revised NEO Personality Inventory (NEO-PI-R) and NEO Five Factor Inventory (NEO-FFI) Professional Manual. Odessa, Florida: Psychological Assessment Resources; 1992. [Google Scholar]
- Cox RW. AFNI: software for analysis and visualization of functional magnetic resonance neuroimages. Computers & Biomedical Research. 1996;29:162–173. doi: 10.1006/cbmr.1996.0014. [DOI] [PubMed] [Google Scholar]
- Craik FIM, Moroz TM, Moscovitch M, Stuss DT, Winocur G, Tulving E, Kapur S. In search of the self: A positron emission tomography investigation. Psychological Science. 1999;10:26–34. [Google Scholar]
- Cross SE, Madson L. Models of the self: self-construals and gender. Psychological Bulletin. 1997;122:5–37. doi: 10.1037/0033-2909.122.1.5. [DOI] [PubMed] [Google Scholar]
- Damoiseaux JS, Beckmann CF, Sanz Arigita EJ, Barkhof F, Scheltens P, Stam CJ, Smith SM, Rombouts SA. Reduced resting-state brain activity in the “default network” in normal aging. Cerebral Cortex. 2008;18:1856–1864. doi: 10.1093/cercor/bhm207. [DOI] [PubMed] [Google Scholar]
- Dehaene S, Le Clec HG, Poline JB, Le Bihan D, Cohen L. The visual word form area: a prelexical representation of visual words in the fusiform gyrus. Neuroreport. 2002;13:321–325. doi: 10.1097/00001756-200203040-00015. [DOI] [PubMed] [Google Scholar]
- Dreher JC, Meyer-Lindenberg A, Kohn P, Berman KF. Age-related changes in midbrain dopaminergic regulation of the human reward system. Proceedings of the National Academy of Science U S A. 2008;105:15106–15111. doi: 10.1073/pnas.0802127105. [DOI] [PMC free article] [PubMed] [Google Scholar]
- Duzel E, Schutze H, Yonelinas AP, Heinze HJ. Functional phenotyping of successful aging in long-term memory: Preserved performance in the absence of neural compensation. Hippocampus. 2011;21:803–814. doi: 10.1002/hipo.20834. [DOI] [PubMed] [Google Scholar]
- Ebner NC, Riediger M, Lindenberger U. Schema reliance for developmental goals increases from early to late adulthood: improvement for the young, loss prevention for the old. Psychology and Aging. 2009;24:310–323. doi: 10.1037/a0015430. [DOI] [PubMed] [Google Scholar]
- Efron B. Nonparametric estimates of standard error: The jackknife, the bootstrap, and other methods. Biometrika. 1981;68:589–599. [Google Scholar]
- Eppinger B, Herbert M, Kray J. We remember the good things: Age differences in learning and memory. Neurobiology of Learning and Memory. 2010;93:515–521. doi: 10.1016/j.nlm.2010.01.009. [DOI] [PubMed] [Google Scholar]
- Esposito F, Aragri A, Pesaresi I, Cirillo S, Tedeschi G, Marciano E, Goebel R, Di Salle F. Independent component model of the default-mode brain function: combining individual-level and population-level analyses in resting-state fMRI. Magnetic Resonance Imaging. 2008;26:905–913. doi: 10.1016/j.mri.2008.01.045. [DOI] [PubMed] [Google Scholar]
- Feyers D, Collette F, D’Argembeau A, Majerus S, Salmon E. Neural networks involved in self-judgement in young and elderly adults. NeuroImage. 2010;53:341–347. doi: 10.1016/j.neuroimage.2010.05.071. [DOI] [PubMed] [Google Scholar]
- Folstein MF, Folstein SE, McHugh PR. “Mini Mental State”- a practical method for grading the cognitive state of patients for the clinician. Journal of Psychiatric Research. 1975;12:189–198. doi: 10.1016/0022-3956(75)90026-6. [DOI] [PubMed] [Google Scholar]
- Fossati P, Hevenor SJ, Graham S, Grady CL, Keightley ML, Craik FIM, Mayberg H. In search of the emotional self. A fMRI study using positive and negative emotional words. American Journal of Psychiatry. 2003;160:1938–1945. doi: 10.1176/appi.ajp.160.11.1938. [DOI] [PubMed] [Google Scholar]
- Fossati P, Hevenor SJ, Lepage M, Graham SJ, Grady C, Keightley ML, Craik F, Mayberg H. Distributed self in episodic memory: neural correlates of successful retrieval of self-encoded positive and negative personality traits. NeuroImage. 2004;22:1596–1604. doi: 10.1016/j.neuroimage.2004.03.034. [DOI] [PubMed] [Google Scholar]
- Fox MD, Snyder AZ, Vincent JL, Corbetta M, Van Essen DC, Raichle ME. The human brain is intrinsically organized into dynamic, anticorrelated functional networks. Proceedings of the National Academy of Science U S A. 2005;102:9673–9678. doi: 10.1073/pnas.0504136102. [DOI] [PMC free article] [PubMed] [Google Scholar]
- Garrett DD, Kovacevic N, McIntosh AR, Grady CL. Blood oxygen level-dependent signal variability is more than just noise. Journal of Neuroscience. 2010;30:4914–4921. doi: 10.1523/JNEUROSCI.5166-09.2010. [DOI] [PMC free article] [PubMed] [Google Scholar]
- Garrett DD, Kovacevic N, McIntosh AR, Grady CL. The importance of being variable. Journal of Neuroscience. 2011;31:4496–4503. doi: 10.1523/JNEUROSCI.5641-10.2011. [DOI] [PMC free article] [PubMed] [Google Scholar]
- Glisky EL, Marquine MJ. Semantic and self-referential processing of positive and negative trait adjectives in older adults. Memory. 2009;17:144–157. doi: 10.1080/09658210802077405. [DOI] [PMC free article] [PubMed] [Google Scholar]
- Glover GH, Li TQ, Ress D. Image-based method for retrospective correction of physiological motion effects in fMRI: RETROICOR. Magnetic Resonance in Medicine. 2000;44:162–167. doi: 10.1002/1522-2594(200007)44:1<162::aid-mrm23>3.0.co;2-e. [DOI] [PubMed] [Google Scholar]
- Grady CL, Hongwanishkul D, Keightley ML, Lee WSC, Hasher L. The effect of age on memory for emotional faces. Neuropsychology. 2007;21:371–380. doi: 10.1037/0894-4105.21.3.371. [DOI] [PubMed] [Google Scholar]
- Grady CL, Protzner AB, Kovacevic N, Strother SC, Afshin-Pour B, Wojtowicz M, Anderson JA, Churchill N, McIntosh AR. A multivariate analysis of age-related differences in default mode and task-positive networks across multiple cognitive domains. Cerebral Cortex. 2010;20:1432–1447. doi: 10.1093/cercor/bhp207. [DOI] [PMC free article] [PubMed] [Google Scholar]
- Grady CL, Springer MV, Hongwanishkul D, McIntosh AR, Winocur G. Age- related changes in brain activity across the adult lifespan. Journal of Cognitive Neuroscience. 2006;18:227–241. doi: 10.1162/089892906775783705. [DOI] [PubMed] [Google Scholar]
- Green L, Myerson J, Lichtman D, Rosen S, Fry A. Temporal discounting in choice between delayed rewards: the role of age and income. Psychology and Aging. 1996;11:79–84. doi: 10.1037//0882-7974.11.1.79. [DOI] [PubMed] [Google Scholar]
- Grigg O, Grady CL. The default network and processing of personally relevant information: Converging evidence from task-related modulations and functional connectivity. Neuropsychologia. 2010a;48:3815–3823. doi: 10.1016/j.neuropsychologia.2010.09.007. [DOI] [PMC free article] [PubMed] [Google Scholar]
- Grigg O, Grady CL. Task-related effects on the temporal and spatial dynamics of resting-state functional connectivity in the default network. PLoS ONE. 2010b;5:e13311. doi: 10.1371/journal.pone.0013311. [DOI] [PMC free article] [PubMed] [Google Scholar]
- Gross JJ, Carstensen LL, Pasupathi M, Tsai J, Skorpen CG, Hsu AY. Emotion and aging: experience, expression, and control. Psychology and Aging. 1997;12:590–599. doi: 10.1037//0882-7974.12.4.590. [DOI] [PubMed] [Google Scholar]
- Gusnard DA, Akbudak E, Shulman GL, Raichle ME. Medial prefrontal cortex and self-referential mental activity: Relation to a default mode of brain function. Proceedings of the National Academy of Science, USA. 2001;98:4259–4264. doi: 10.1073/pnas.071043098. [DOI] [PMC free article] [PubMed] [Google Scholar]
- Gutchess AH, Kensinger EA, Schacter DL. Aging, self-referencing, and medial prefrontal cortex. Social Neuroscience. 2007;2:117–133. doi: 10.1080/17470910701399029. [DOI] [PubMed] [Google Scholar]
- Gutchess AH, Kensinger EA, Schacter DL. Functional neuroimaging of self- referential encoding with age. Neuropsychologia. 2010;48:211–219. doi: 10.1016/j.neuropsychologia.2009.09.006. [DOI] [PMC free article] [PubMed] [Google Scholar]
- Gutchess AH, Kensinger EA, Yoon C, Schacter DL. Ageing and the self- reference effect in memory. Memory. 2007;15:822–837. doi: 10.1080/09658210701701394. [DOI] [PubMed] [Google Scholar]
- Haber SN, Knutson B. The reward circuit: linking primate anatomy and human imaging. Neuropsychopharmacology. 2010;35:4–26. doi: 10.1038/npp.2009.129. [DOI] [PMC free article] [PubMed] [Google Scholar]
- Hedden T, Van Dijk KR, Becker JA, Mehta A, Sperling RA, Johnson KA, Buckner RL. Disruption of functional connectivity in clinically normal older adults harboring amyloid burden. Journal of Neuroscience. 2009;29:12686–12694. doi: 10.1523/JNEUROSCI.3189-09.2009. [DOI] [PMC free article] [PubMed] [Google Scholar]
- Isaacowitz DM, Allard ES, Murphy NA, Schlangel M. The time course of age- related preferences toward positive and negative stimuli. Journal of Gerontology B Psychological Science and Social Science. 2009;64:188–192. doi: 10.1093/geronb/gbn036. [DOI] [PMC free article] [PubMed] [Google Scholar]
- Izuma K, Saito DN, Sadato N. Processing of social and monetary rewards in the human striatum. Neuron. 2008;58:284–294. doi: 10.1016/j.neuron.2008.03.020. [DOI] [PubMed] [Google Scholar]
- Johnson MK, Raye CL, Mitchell KJ, Touryan SR, Greene EJ, Nolen-Hoeksema S. Dissociating medial frontal and posterior cingulate activity during self-reflection. Social Cognitive and Affective Neuroscience. 2006;1:56–64. doi: 10.1093/scan/nsl004. [DOI] [PMC free article] [PubMed] [Google Scholar]
- Keightley ML, Winocur G, Burianova H, Hongwanishkul D, Grady C. Age Effects on Social Cognition: Faces Tell A Different Story. Psychology and Aging. 2006;21:558–572. doi: 10.1037/0882-7974.21.3.558. [DOI] [PubMed] [Google Scholar]
- Kelley WM, Macrae CN, Wyland CL, Caglar S, Inati S, Heatherton TF. Finding the self? An event-related fMRI study. Journal of Cognitive Neuroscience. 2002;14:785–794. doi: 10.1162/08989290260138672. [DOI] [PubMed] [Google Scholar]
- Klein SB, Gangi CE. The multiplicity of self: neuropsychological evidence and its implications for the self as a construct in psychological research. Ann N Y Acad Sci. 2010;1191:1–15. doi: 10.1111/j.1749-6632.2010.05441.x. [DOI] [PubMed] [Google Scholar]
- Knutson B, Taylor J, Kaufman M, Peterson R, Glover G. Distributed neural representation of expected value. Journal of Neuroscience. 2005;25:4806–4812. doi: 10.1523/JNEUROSCI.0642-05.2005. [DOI] [PMC free article] [PubMed] [Google Scholar]
- Krebs RM, Heipertz D, Schuetze H, Duzel E. Novelty increases the mesolimbic functional connectivity of the substantia nigra/ventral tegmental area (SN/VTA) during reward anticipation: Evidence from high-resolution fMRI. NeuroImage. 2011;58:647–655. doi: 10.1016/j.neuroimage.2011.06.038. [DOI] [PubMed] [Google Scholar]
- Krishnan A, Williams LJ, McIntosh AR, Abdi H. Partial Least Squares (PLS) methods for neuroimaging: a tutorial and review. NeuroImage. 2011;56:455–475. doi: 10.1016/j.neuroimage.2010.07.034. [DOI] [PubMed] [Google Scholar]
- Lawton MP, Kleban MH, Rajagopal D, Dean J. Dimensions of affective experience in three age groups. Psychology and Aging. 1992;7:171–184. doi: 10.1037//0882-7974.7.2.171. [DOI] [PubMed] [Google Scholar]
- Lemogne C, Delaveau P, Freton M, Guionnet S, Fossati P. Medial prefrontal cortex and the self in major depression. J Affect Disord. 2012;136:e1–e11. doi: 10.1016/j.jad.2010.11.034. [DOI] [PubMed] [Google Scholar]
- Levine B, Turner GR, Tisserand D, Hevenor SJ, Graham SJ, McIntosh AR. The functional neuroanatomy of episodic and semantic autobiographical remembering: a prospective functional MRI study. Journal of Cognitive Neuroscience. 2004;16:1633–1646. doi: 10.1162/0898929042568587. [DOI] [PubMed] [Google Scholar]
- Liang X, Zebrowitz LA, Zhang Y. Neural activation in the “reward circuit” shows a nonlinear response to facial attractiveness. Social Neuroscience. 2010;5:320–334. doi: 10.1080/17470911003619916. [DOI] [PMC free article] [PubMed] [Google Scholar]
- Liu X, Hairston J, Schrier M, Fan J. Common and distinct networks underlying reward valence and processing stages: a meta-analysis of functional neuroimaging studies. Neuroscience and Biobehavioral Reviews. 2011;35:1219–1236. doi: 10.1016/j.neubiorev.2010.12.012. [DOI] [PMC free article] [PubMed] [Google Scholar]
- Lustig C, Snyder AZ, Bhakta M, O’Brien KC, McAvoy M, Raichle ME, Morris JC, Buckner RL. Functional deactivations: change with age and dementia of the Alzheimer type. Proceedings of the National Academy of Science U S A. 2003;100:14504–14509. doi: 10.1073/pnas.2235925100. [DOI] [PMC free article] [PubMed] [Google Scholar]
- Maguire EA, Frith CD. Aging affects the engagement of the hippocampus during autobiographical memory retrieval. Brain. 2003;126:1511–1523. doi: 10.1093/brain/awg157. [DOI] [PubMed] [Google Scholar]
- Mather M, Carstensen LL. Aging and attentional biases for emotional faces. Psychological Science. 2003;14:409–415. doi: 10.1111/1467-9280.01455. [DOI] [PubMed] [Google Scholar]
- Mather M, Carstensen LL. Aging and motivated cognition: the positivity effect in attention and memory. Trends in Cognitive Science. 2005;9:496–502. doi: 10.1016/j.tics.2005.08.005. [DOI] [PubMed] [Google Scholar]
- McCrae RR, Costa PT, Pedroso de Lima M, Simoes A, Ostendorf F, Angleitner A, Marusic I, Bratko D, Caprara GV, Barbaranelli C, Chae JH, Piedmont RL. Age differences in personality across the adult life span: parallels in five cultures. Developmental Psychology. 1999;35:466–477. doi: 10.1037//0012-1649.35.2.466. [DOI] [PubMed] [Google Scholar]
- McCrae RR, Martin TA, Costa PT., Jr Age trends and age norms for the NEO Personality Inventory-3 in adolescents and adults. Assessment. 2005;12:363–373. doi: 10.1177/1073191105279724. [DOI] [PubMed] [Google Scholar]
- McIntosh AR. Mapping cognition to the brain through neural interactions. Memory. 1999;7:523–548. doi: 10.1080/096582199387733. [DOI] [PubMed] [Google Scholar]
- McIntosh AR, Bookstein FL, Haxby JV, Grady CL. Spatial pattern analysis of functional brain images using Partial Least Squares. NeuroImage. 1996;3:143–157. doi: 10.1006/nimg.1996.0016. [DOI] [PubMed] [Google Scholar]
- McIntosh AR, Lobaugh NL. Partial least squates analysis of neuroimaging data: applications and advances. Neuroimage. 2004;23(Supplement 1):S250–S263. doi: 10.1016/j.neuroimage.2004.07.020. [DOI] [PubMed] [Google Scholar]
- McKiernan KA, Kaufman JN, Kucera-Thompson J, Binder JR. A parametric manipulation of factors affecting task-induced deactivation in functional neuroimaging. Journal of Cognitive Neuroscience. 2003;15:394–408. doi: 10.1162/089892903321593117. [DOI] [PubMed] [Google Scholar]
- Mell T, Wartenburger I, Marschner A, Villringer A, Reischies FM, Heekeren HR. Altered function of ventral striatum during reward-based decision making in old age. Frontiers in Human Neuroscience. 2009;3:article 34. doi: 10.3389/neuro.09.034.2009. [DOI] [PMC free article] [PubMed] [Google Scholar]
- Miller SL, Celone K, DePeau K, Diamond E, Dickerson BC, Rentz D, Pihlajamaki M, Sperling RA. Age-related memory impairment associated with loss of parietal deactivation but preserved hippocampal activation. Proceedings of the National Academy of Science USA. 2008;105:2181–2186. doi: 10.1073/pnas.0706818105. [DOI] [PMC free article] [PubMed] [Google Scholar]
- Mitchell KJ, Raye CL, Ebner NC, Tubridy SM, Frankel H, Johnson MK. Age-group differences in medial cortex activity associated with thinking about self-relevant agendas. Psychology and Aging. 2009;24:438–449. doi: 10.1037/a0015181. [DOI] [PMC free article] [PubMed] [Google Scholar]
- Moriguchi Y, Ohnishi T, Lane RD, Maeda M, Mori T, Nemoto K, Matsuda H, Komaki G. Impaired self-awareness and theory of mind: an fMRI study of mentalizing in alexithymia. NeuroImage. 2006;32:1472–1482. doi: 10.1016/j.neuroimage.2006.04.186. [DOI] [PubMed] [Google Scholar]
- Murphy NA, Isaacowitz DM. Preferences for emotional information in older and younger adults: a meta-analysis of memory and attention tasks. Psychology and Aging. 2008;23:263–286. doi: 10.1037/0882-7974.23.2.263. [DOI] [PubMed] [Google Scholar]
- Northoff G, Bermpohl F. Cortical midline structures and the self. Trends in Cognitive Science. 2004;8:102–107. doi: 10.1016/j.tics.2004.01.004. [DOI] [PubMed] [Google Scholar]
- Northoff G, Hayes DJ. Is our self nothing but reward? Biological Psychiatry. 2011;69:1019–1025. doi: 10.1016/j.biopsych.2010.12.014. [DOI] [PubMed] [Google Scholar]
- O’Doherty JP, Deichmann R, Critchley HD, Dolan RJ. Neural responses during anticipation of a primary taste reward. Neuron. 2002;33:815–826. doi: 10.1016/s0896-6273(02)00603-7. [DOI] [PubMed] [Google Scholar]
- Ochsner KN, Beer JS, Robertson ER, Cooper JC, Gabrieli JD, Kihsltrom JF, D’Esposito M. The neural correlates of direct and reflected self-knowledge. Neuroimage. 2005;28:797–814. doi: 10.1016/j.neuroimage.2005.06.069. [DOI] [PubMed] [Google Scholar]
- Pagnoni G, Zink CF, Montague PR, Berns GS. Activity in human ventral striatum locked to errors of reward prediction. Nature Neuroscience. 2002;5:97–98. doi: 10.1038/nn802. [DOI] [PubMed] [Google Scholar]
- Park DC, Polk TA, Hebrank AC, Jenkins LJ. Age differences in default mode activity on easy and difficult spatial judgment tasks. Frontiers in Human Neuroscience. 2010;3:article 75. doi: 10.3389/neuro.09.075.2009. [DOI] [PMC free article] [PubMed] [Google Scholar]
- Persson J, Lustig C, Nelson JK, Reuter-Lorenz PA. Age differences in deactivation: a link to cognitive control? Journal of Cognitive Neuroscience. 2007;19:1021–1032. doi: 10.1162/jocn.2007.19.6.1021. [DOI] [PubMed] [Google Scholar]
- Price CJ, Wise RJS, Watson JDG, Patterson K, Howard D, Frackowiak RSJ. Brain activity during reading. The effects of exposure duration and task. Brain. 1994;117:1255–1269. doi: 10.1093/brain/117.6.1255. [DOI] [PubMed] [Google Scholar]
- Raichle ME, MacLeod AM, Snyder AZ, Powers WJ, Gusnard DA, Shulman GL. A default mode of brain function. Proceedings of the National Academy of Science U S A. 2001;98:676–682. doi: 10.1073/pnas.98.2.676. [DOI] [PMC free article] [PubMed] [Google Scholar]
- Raven JC, Court JH, Raven J. The Mill Hill Vocabulary Scale: 1988 Revision. London: H.K. Lewis; 1988. [Google Scholar]
- Robinson MD, Clore GL. Episodic and semantic knowledge in emotional self- report: evidence for two judgment processes. Journal of Personality and Social Psychololgy. 2002;83:198–215. [PubMed] [Google Scholar]
- Rolls ET, McCabe C, Redoute J. Expected value, reward outcome, and temporal difference error representations in a probabilistic decision task. Cerebral Cortex. 2008;18:652–663. doi: 10.1093/cercor/bhm097. [DOI] [PubMed] [Google Scholar]
- Ruby P, Collette F, D’Argembeau A, Peters F, Degueldre C, Balteau E, Luxen A, Maquet P, Salmon E. Perspective taking to assess self-personality: what’s modified in Alzheimer’s disease? Neurobiology of Aging. 2009;30:1637–1651. doi: 10.1016/j.neurobiolaging.2007.12.014. [DOI] [PubMed] [Google Scholar]
- Samanez Larkin GR, Gibbs SE, Khanna K, Nielsen L, Carstensen LL, Knutson B. Anticipation of monetary gain but not loss in healthy older adults. Nature Neuroscience. 2007;10:787–791. doi: 10.1038/nn1894. [DOI] [PMC free article] [PubMed] [Google Scholar]
- Samanez-Larkin GR, Kuhnen CM, Yoo DJ, Knutson B. Variability in nucleus accumbens activity mediates age-related suboptimal financial risk taking. Journal of Neuroscience. 2010;30:1426–1434. doi: 10.1523/JNEUROSCI.4902-09.2010. [DOI] [PMC free article] [PubMed] [Google Scholar]
- Sambataro F, Murty VP, Callicott JH, Tan HY, Das S, Weinberger DR, Mattay VS. Age-related alterations in default mode network: Impact on working memory performance. Neurobiology of Aging. 2010;31:839–852. doi: 10.1016/j.neurobiolaging.2008.05.022. [DOI] [PMC free article] [PubMed] [Google Scholar]
- Sampson PD, Streissguth AP, Barr HM, Bookstein FL. Neurobehavioral effects of prenatal alchohol: Part II. Partial least squares analysis. Neurotoxicology and Teratology. 1989;11:477–491. doi: 10.1016/0892-0362(89)90025-1. [DOI] [PubMed] [Google Scholar]
- Saxe R, Moran JM, Scholz J, Gabrieli J. Overlapping and non-overlapping brain regions for theory of mind and self reflection in individual subjects. Social Cognitive and Affective Neuroscience. 2006;1:229–234. doi: 10.1093/scan/nsl034. [DOI] [PMC free article] [PubMed] [Google Scholar]
- Schott BH, Minuzzi L, Krebs RM, Elmenhorst D, Lang M, Winz OH, Seidenbecher CI, Coenen HH, Heinze HJ, Zilles K, Duzel E, Bauer A. Mesolimbic functional magnetic resonance imaging activations during reward anticipation correlate with reward-related ventral striatal dopamine release. Journal of Neuroscience. 2008;28:14311–14319. doi: 10.1523/JNEUROSCI.2058-08.2008. [DOI] [PMC free article] [PubMed] [Google Scholar]
- Seeley WW, Menon V, Schatzberg AF, Keller J, Glover GH, Kenna H, Reiss AL, Greicius MD. Dissociable intrinsic connectivity networks for salience processing and executive control. Journal of Neuroscience. 2007;27:2349–2356. doi: 10.1523/JNEUROSCI.5587-06.2007. [DOI] [PMC free article] [PubMed] [Google Scholar]
- Shulman GL, Fiez J, Corbetta M, Buckner RL, Miezin F, Raichle ME, Petersen SE. Common Blood Flow Changes Across Visual Tasks: Decreases in cerebral cortex. Journal of Cognitive Neuroscience. 1997;9:648–663. doi: 10.1162/jocn.1997.9.5.648. [DOI] [PubMed] [Google Scholar]
- Spaniol J, Voss A, Grady CL. Aging and emotional memory: cognitive mechanisms underlying the positivity effect. Psychology and Aging. 2008;23:859–872. doi: 10.1037/a0014218. [DOI] [PubMed] [Google Scholar]
- Sperling RA, Laviolette PS, O’Keefe K, O’Brien J, Rentz DM, Pihlajamaki M, Marshall G, Hyman BT, Selkoe DJ, Hedden T, Buckner RL, Becker JA, Johnson KA. Amyloid deposition is associated with impaired default network function in older persons without dementia. Neuron. 2009;63:178–188. doi: 10.1016/j.neuron.2009.07.003. [DOI] [PMC free article] [PubMed] [Google Scholar]
- Spreng RN, Grady CL. Patterns of brain activity supporting autobiographical memory, prospection and theory-of-mind, and their relationship to the default mode network. Journal of Cognitive Neuroscience. 2010;22:1112–1123. doi: 10.1162/jocn.2009.21282. [DOI] [PubMed] [Google Scholar]
- Spreng RN, Mar RA, Kim ASN. The common neural basis of autobiographical memory, prospection, navigation, theory of mind, and the default mode: A quantitative meta-analysis. Journal of Cognitive Neuroscience. 2009;21:489–510. doi: 10.1162/jocn.2008.21029. [DOI] [PubMed] [Google Scholar]
- Spreng RN, Stevens WD, Chamberlain JP, Gilmore AW, Schacter DL. Default network activity, coupled with the frontoparietal control network, supports goal-directed cognition. NeuroImage. 2010;53:303–317. doi: 10.1016/j.neuroimage.2010.06.016. [DOI] [PMC free article] [PubMed] [Google Scholar]
- Spreng RN, Wojtowicz M, Grady CL. Reliable differences in brain activity between young and old adults: a quantitative meta-analysis across multiple cognitive domains. Neuroscience and Biobehavioral Reviews. 2010;34:1178–1194. doi: 10.1016/j.neubiorev.2010.01.009. [DOI] [PubMed] [Google Scholar]
- Stone AA, Schwartz JE, Broderick JE, Deaton A. A snapshot of the age distribution of psychological well-being in the United States. Proceedings of the National Academy of Science U S A. 2010;107:9985–9990. doi: 10.1073/pnas.1003744107. [DOI] [PMC free article] [PubMed] [Google Scholar]
- Stuss DT, Gow CA, Hetherington CR. “No longer Gage”: frontal lobe dysfunction and emotional changes. Journal of Consulting and Clinical Psychology. 1992;60:349–359. doi: 10.1037//0022-006x.60.3.349. [DOI] [PubMed] [Google Scholar]
- Symons CS, Johnson BT. The self-reference effect in memory: a meta-analysis. Psychological Bulletin. 1997;121:371–394. doi: 10.1037/0033-2909.121.3.371. [DOI] [PubMed] [Google Scholar]
- Thompson-Schill SL. Neuroimaging studies of semantic memory: inferring “how” from “where”. Neuropsychologia. 2003;41:280–292. doi: 10.1016/s0028-3932(02)00161-6. [DOI] [PubMed] [Google Scholar]
- Toro R, Fox PT, Paus T. Functional Coactivation Map of the Human Brain. Cerebral Cortex. 2008;18:2553–2559. doi: 10.1093/cercor/bhn014. [DOI] [PMC free article] [PubMed] [Google Scholar]
- Turkeltaub PE, Eden GF, Jones KM, Zeffiro TA. Meta-analysis of the functional neuroanatomy of single-word reading: method and validation. Neuroimage. 2002;16:765–780. doi: 10.1006/nimg.2002.1131. [DOI] [PubMed] [Google Scholar]
- Uddin LQ, Iacoboni M, Lange C, Keenan JP. The self and social cognition: the role of cortical midline structures and mirror neurons. Trends in Cognitive Science. 2007;11:153–157. doi: 10.1016/j.tics.2007.01.001. [DOI] [PubMed] [Google Scholar]
- van der Meer L, Costafreda S, Aleman A, David AS. Self-reflection and the brain: a theoretical review and meta-analysis of neuroimaging studies with implications for schizophrenia. Neuroscience and Biobehavioral Reviews. 2010;34:935–946. doi: 10.1016/j.neubiorev.2009.12.004. [DOI] [PubMed] [Google Scholar]
- Vincent JL, Kahn I, Snyder AZ, Raichle ME, Buckner RL. Evidence for a Frontoparietal Control System Revealed by Intrinsic Functional Connectivity. Journal of Neurophysiology. 2008;100:3328–3342. doi: 10.1152/jn.90355.2008. [DOI] [PMC free article] [PubMed] [Google Scholar]
- Wagner AD, Pare-Blagoev EJ, Clark J, Poldrack RA. Recovering meaning: left prefrontal cortex guides controlled semantic retrieval. Neuron. 2001;31:329–338. doi: 10.1016/s0896-6273(01)00359-2. [DOI] [PubMed] [Google Scholar]
- Wang L, Laviolette P, O’Keefe K, Putcha D, Bakkour A, Van Dijk KR, Pihlajamaki M, Dickerson BC, Sperling RA. Intrinsic connectivity between the hippocampus and posteromedial cortex predicts memory performance in cognitively intact older individuals. NeuroImage. 2010;51:910–917. doi: 10.1016/j.neuroimage.2010.02.046. [DOI] [PMC free article] [PubMed] [Google Scholar]
- Wang L, Li Y, Metzak P, He Y, Woodward TS. Age-related changes in topological patterns of large-scale brain functional networks during memory encoding and recognition. NeuroImage. 2010;50:862–872. doi: 10.1016/j.neuroimage.2010.01.044. [DOI] [PubMed] [Google Scholar]
- Weiler JA, Bellebaum C, Daum I. Aging affects acquisition and reversal of reward- based associative learning. Learning and Memory. 2008;15:190–197. doi: 10.1101/lm.890408. [DOI] [PMC free article] [PubMed] [Google Scholar]
- Welzer H, Markowitsch HJ. Towards a bio-psycho-social model of autobiographical memory. Memory. 2005;13:63–78. doi: 10.1080/09658210344000576. [DOI] [PubMed] [Google Scholar]
- Ye Z, Hammer A, Camara E, Munte TF. Pramipexole modulates the neural network of reward anticipation. Human Brain Mapping. 2011;32:800–811. doi: 10.1002/hbm.21067. [DOI] [PMC free article] [PubMed] [Google Scholar]
- Zinck A. Self-referential emotions. Consciousness and Cognition. 2008;17:496–505. doi: 10.1016/j.concog.2008.03.014. [DOI] [PubMed] [Google Scholar]
Associated Data
This section collects any data citations, data availability statements, or supplementary materials included in this article.