

Abstract
Disease incidence rises rapidly with age and increases both human suffering and economic hardship while shortening life. Advances in understanding the signaling pathways and cellular processes that influence aging, support the possibility of reducing the incidence of age-related diseases and increasing lifespan by pharmacological intervention. Here, we demonstrate a novel pharmacological strategy that both reduces signs of aging in the budding yeast Saccharomyces cerevisiae and generates a synergistic increase in lifespan. By combining a low dose of rapamycin, to reduce activity of the target of rapamycin complex 1 (TORC1) protein kinase, and myriocin, to reduce sphingolipid synthesis, we show enhancement of autophagy, genomic stability, mitochondrial function, and AMP kinase pathway activity. These processes are controlled by evolutionarily conserved signal transduction pathways that are vital for maintaining a healthy state and promoting a long life. Thus, our data show that it ought to be possible to find pharmacological approaches to generate a synergistic reduction in the incidence of human age-related diseases to improve health quality in the elderly and enhance lifespan.
Keywords: TORC1, S6 Kinase, aging, genomic stability, autophagy, longevity
Introduction
Most people in western societies die from diabetes, cancer, cardiovascular or immune dysfunction or neurodegeneration, the so called age-related diseases. There is a growing interest in finding strategies to reduce the incidence of these diseases and improve human healthspan and perhaps lifespan (Niccoli & Partridge 2012). One promising strategy uses rapamycin to reduce activity of the target of rapamycin protein kinase complex 1 (TORC1). TORC1 is nearly ubiquitous in eukaryotes and plays evolutionarily conserved roles in aging and lifespan (Blagosklonny 2006; Fontana et al. 2010; Kapahi et al. 2010; Niccoli & Partridge 2012). One TORC1 substrate, the mammalian S6 protein kinase 1 (S6K1) and its budding yeast ortholog Sch9 (Fig. 1A), plays key roles in longevity, since deleting the S6K1 or SCH9 gene enhances lifespan in yeasts and mice, respectively (Fabrizio et al. 2001; Selman et al. 2009; Fontana et al. 2010).
Fig. 1.

Combination drug treatment enhances CLS and stress resistance. (A) Outline of the signaling pathways (colored ovals and lines), transcription factors (gray boxes) and cellular processes (tan boxes) that are modulated by combination drug treatment. NPD: Nitrogen Discrimination Pathway. (B) The viability of DBY746 cells incubated in SDC medium is shown as a function of days of incubation (day 1 = 72 hrs). Cells were treated with no drug, 45 ng/ml Myriocin (Myr, 112 nM), 450 pg/ml Rapamycin (Rap. 0.49 nM), 45 ng/ml Myr plus 450 pg/ml Rap in these and all other experiments, unless indicated otherwise. Data are for the mean ± SEM of viable cells in triplicate cultures in these and all other CLS experiments. The dotted straight line with an arrowhead indicates an increase in the CLS of cells treated with both drugs that is greater than the additive effect on CLS of each drug treatment compared to untreated cells (additive effect is indicated by a dashed survival curve). The p value for lifespan increase in panels B to E is computed using the area under the viability curves. (C) CLS of DBY746 cells switched to water after 72 hrs (CLS day 1) of incubation in SDC. (D) CLS of BY4743 cells grown in SDC medium. (E) CLS of BY4743 cells switched to water on CLS day 1. (F and G) Resistance of DBY746 or BY4743 cells on CLS day 1 to heat (55°C) or hydrogen peroxide (H2O2) stress. Photographs show a 10-fold dilution series (from left to right).
Recently we showed that Sch9 activity can be reduced and yeast chronological lifespan (CLS) increased by treating cells with the natural product myriocin (Huang et al. 2012). Myriocin inhibits the first enzyme in sphingolipid synthesis and moderate drug doses effectively reduce the steady-state level of several, but not all, sphingolipids. As a consequence, the Pkh1 and Pkh2 protein kinases, functional orthologs of mammalian phosphoinositide-dependent protein kinase 1 (PDK1) (Casamayor et al. 1999), are less active as is Sch9, one of their substrates (Fig. 1A) (Urban et al. 2007; Loewith & Hall 2011; Huang et al. 2012). In addition, we found that myriocin treatment extends CLS in sch9 mutant cells, indicating that myriocin influences lifespan by both Sch9-dependent and independent mechanisms
Dual control of Sch9 by TORC1 and Pkh1/2 suggested the possibility of producing a synergistic increase in CLS by treating cells with a low dose combination of myriocin and rapamycin. CLS is a measure of how well cells survive in stationary phase while in a non-dividing or Go state. The other measure of yeast longevity, replicative lifespan, measures how many times a cell can bud to yield a new cell. TORC1 and Sch9 regulate both forms of yeast lifespan and it is thought that they modulate metabolism in ways that enhance survival, similar to what calorie restriction does in many organisms to extend lifespan (Fontana et al. 2010; Anderson & Weindruch 2012; Longo et al. 2012).
We show that combination drug treatment creates a synergistic increase in CLS by modulating a wide array of processes and signaling pathways including the Snf1/AMP kinase, TORC1-Sch9 and PKA, which play evolutionarily conserved roles in regulating aging and longevity. Part of the mechanism for generating synergy appears to lie upstream of TORC1 and we discuss ways in which a low dose of the two drugs may reduce TORC1 activity.
Results
Lifespan and stress resistance
We identified low concentrations of myriocin or rapamycin having little effect on the CLS of haploid DBY746 cells when used individually, but produced a large and potentially synergistic increase (Table 1, bold numbers) in CLS when used together (Fig. 1B). Since aging and longevity are complex traits and are influenced by many factors, we examined other strains backgrounds (Longo et al. 2012) to show the general feasibility of lifespan enhancement by drug synergy. Diploid BY4743 cells show a smaller, but statistically significant increase in CLS when treated with the drug combination but not with the single drugs (Fig. 1D), indicating that the drug combination also enhances lifespan in BY4743 cells, although the increase is less than in DBY746 cells.
Table 1.
Combination drug treatment produces a synergistic increase in lifespan.
| Single Treatment concentrations (nM)† | Combination Treatment Concentrations (nM) | Synergy is defined as: | Molar ratio | |||||
|---|---|---|---|---|---|---|---|---|
| Rap | Myr | Rap | Myr | Survival (fold of control)¶ | CI < 1 Chou | α > 0 Greco | β4 > 0 Plummer | Myr/Rap |
| 0 | 0 | 0 | 0 | 1 | - | - | - | - |
| 1.31 | 1371.69 | 0.3 | 180 | 2.381 | 0.361 | 9.313 | 3.678 | 600 |
| 0.70 | 100.85 | 0.3 | 9 | 1.128 | 0.517 | 27.987 | 2.472 | 30 |
| 0.72 | 109.86 | 0.3 | 30 | 1.147 | 0.687 | 5.771 | 0.930 | 100 |
| 0.91 | 222.57 | 0.3 | 90 | 1.481 | 0.734 | 2.612 | 0.730 | 300 |
| 1.26 | 838.58 | 1 | 100 | 2.290 | 0.911 | 0.539 | 0.290 | 100 |
| 1.31‡ | 1180.9 | 0.49 | 112 | 2.361 | 0.470 | 7.049 | 2.807 | 229 |
| 1.07 | 379.97 | 1 | 30 | 1.868 | 1.011§ | −0.141 | −0.042 | 30 |
| 1.11 | 432.02 | 1 | 300 | 1.960 | 1.597 | −0.810 | −0.754 | 300 |
| 1.31 | 1232.53 | 1.5 | 45 | 2.369 | 1.186 | −2.055 | −0.908 | 30 |
| 1.09 | 405.16 | 1.5 | 150 | 1.929 | 1.746 | −1.297 | −1.045 | 100 |
| 0.69 | 94.58 | 2.5 | 250 | 1.111 | 6.267 | −1.267 | −1.702 | 100 |
| 1.37 | 1494.25 | 2.5 | 75 | 2.453 | 1.874 | −3.926 | −2.889 | 30 |
These values are the concentration of each individual drug, calculated from dose response curves, necessary to produce the same survival level as the combination treatment.
Cell survival determined on CLS day 5 for the combination treatments.
Values in this row are derived from the drug combination (0.49 nM rapamycin + 112 nM myriocin) used to generate the lifespan data shown in Fig. 1B.
Shaded values indicate additive or antagonistic effects of drug combinations in the corresponding row.
Calorie restriction (CR) enhances lifespan in many eukaryotes ranging from yeasts to mammals (Fontana et al. 2010; Anderson & Weindruch 2012). We determined if CR improves the ability of the drug combination to enhance CLS by transferring drug-treated or untreated cells from culture medium to water after entry into stationary phase (72 hrs of incubation) (Longo et al. 2012). This strategy allows the drugs to promote remodeling of metabolism during the growth phase and then examines survival after growth stops and the drugs are removed. With this strategy, the combination drug treatment produces a large enhancement of lifespan in BY4743 cells (Fig. 1E), similar to the enhancement found in DBY746 cells treated in the same manner (Fig. 1C). Thus, severe calorie restriction imposed at CLS day 1 changes some element of BY4743 physiology that enables the drug combination to generate a very large and potentially synergistic increase in lifespan, similar to the increase seen in DBY746 cells either under CR or non-CR conditions.
Increased resistance to nutritional and other stresses is a nearly universal feature of strategies that increase lifespan and is governed by several signaling pathways in yeast (Fig. 1A) (Kourtis & Tavernarakis 2011; De Virgilio 2012; Longo et al. 2012). We find that dual drug treatment increases resistance to both heat and oxidative stress in DBY746 and BY4743 cells even without CR treatment (Fig. 1F and 1G), consistent with the idea that dual drug treatment is modulating multiple signaling pathways with roles in stress resistance.
To assess whether the increase in CLS produced by the combination of myriocin and rapamycin is synergistic, not additive, we performed survival experiments similar in design to those used to develop drug combinations that produce a synergistic decrease in cancer cell survival, only we measured an increase in survival. We chose to measure DBY746 survival on CLS day 5, since at this time cells treated with the drug combination survive far better than cells treated with a single drug or no drug (Fig. 1B).
The effect of myriocin and rapamycin alone on survival was assessed to obtain the median effective concentrations (EC50) for each drug. The EC50 of rapamycin was 1.1 nM and that of myriocin was 314.7 nM. Non-linear regression was used to fit the survival verses concentration data (data not shown) and the resulting curves were used to determine the concentrations that would be required for each drug alone to elicit the same survival effect as that observed with combinations of rapamycin and myriocin in different molar ratios (Table 1).
Using these data we calculated the combination index (CI) according to Chou and Talalay (Chou & Talalay 1984). To test the robustness of this result, we also calculated the alpha and beta4 parameters that are used to determine deviation from additivity in the more restrictive models of Greco and Plummer, respectively (Greco et al. 1990; Plummer & Short 1990). The prediction of synergy was consistent across all mathematical models (Table 1). The molar ratio of the two drugs has no effect on synergy, but the drug concentration does. The effect approaches additivity as the concentrations approach 1 nM rapamycin and 180 nM myriocin. Below those concentrations, for both drugs, there is strong synergy and above those concentrations, for both drugs, there is antagonism (Table 1, shaded values).
Growth rate and cell density were measured also using a wide range of drug concentrations. Growth rate slowed with myriocin concentrations greater than 200 ng/ml (498 nM) (Fig. S1A) but was not affected even by the highest dose of rapamycin (Fig. S1B). Concentrations of myriocin above 30 ng/ml (75 nM) increase the final density of cells as do concentrations of rapamycin above 500 pg/ml (0.55 nM) (Figs. S1A and S1B). This mass increase may be due to changes in metabolism that promote better use of available carbon sources and other nutrients.
Growth curves and cell density values for a broad array of drug combinations gave a range of responses with some combinations not slowing growth and others completely impairing it (Fig. S1C). All combinations that produce a synergistic increase in survival (Table 1) also increase the final cell density. However, the converse is not true because some combinations that increase cell density produce additive or antagonistic effects on survival, indicating that above a certain level of one or the other drug there is no correlation between increased cell density and a synergistic increase in survival.
Autophagy
Autophagy is an evolutionarily conserved process for promoting intracellular reutilization of resources and maintaining organelle homeostasis in ways that slow aging and disease progression and enhance lifespan (Alvers et al. 2009; Green et al. 2011; Rubinsztein et al. 2011; Niccoli & Partridge 2012). The effect of the drug combination on autophagic flux was evaluated by measuring the cleavage of GFP from GFP-Atg8 (Cheong & Klionsky 2008). Appearance of free GFP requires formation of autophagosomes, their fusion to vacuoles (liposome) and protease activation. Only the combination drug treatment increases the level of free GFP above background, indicating an increase in autophagic flux (Fig. 2A, lane 4). This increase in free GFP is due to autophagy, since it does not appear in atg1 mutant cells where autophagy is blocked (Fig. 2A, lane 6). The slight increase in the level of Atg8-GFP protein in wild-type cells treated with both drugs may be due to increased gene expression.
Fig. 2.
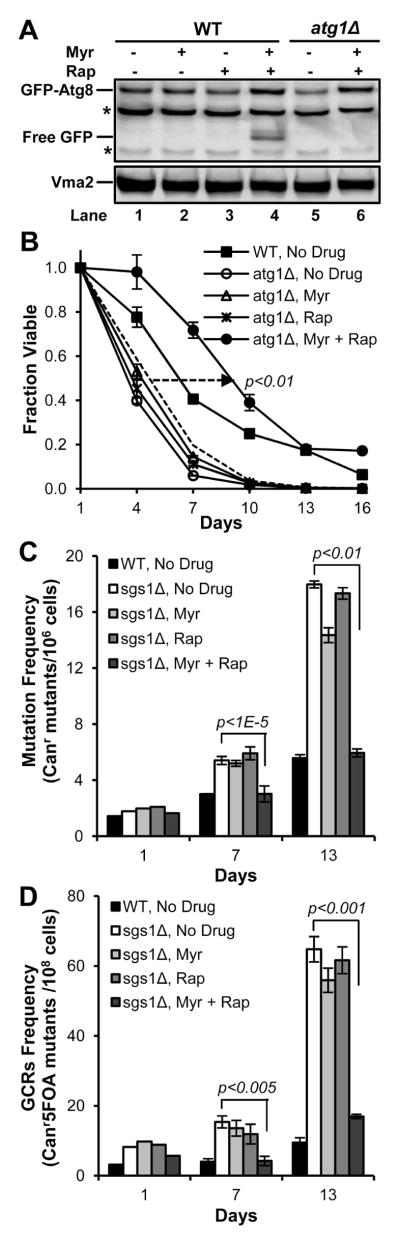
Combination drug treatment enhances autophagy and genome stability. (A) The effect of drug treatment on the level of autophagy, as measured by cleavage of GFP from GFP-Atg8, in log phase (A600nm = 1.0) wild-type (DBY746) or atg1Δ cells is shown in these immunoblots. The Vma2 protein is a loading control and the asterisks indicate antibody reaction with non-specific proteins. (B) CLS of wild-type or atg1Δ cells switched to water at CLS day 1. (C) The frequency of small chromosomal changes was evaluated during a CLS assay by measuring the frequency of canavanine-resistant mutants (Canr). Cells carrying a sgs1Δ allele were used to increase mutation frequency and improve quantification of drug effects. (D) The frequency of gross chromosomal rearrangements (GCRs) during a CLS assay is shown.
To determine if autophagy is necessary for the drug combination to produce an increase in lifespan, we measured CLS in atg1Δ cells. Dual drug treatment promotes an increase in the CLS of atg1 cells (Fig. 2B), although the increase is less than in wild-type cells (Fig. 1C). Thus, autophagy is required for the drug combination to produce a maximal increase in lifespan but is not needed to produce sub-maximal increases.
Genomic stability
DNA damage and genomic instability are hallmarks of cancer and aging (Salk et al. 2010; Pfau & Amon 2012). To determine if drug synergy reduces genomic instability, we used sgs1Δ cells because they show an age-dependent increase in genome instability that is regulated by Sch9 (Madia et al. 2008). Additionally, the low rate of gross chromosomal rearrangements in wild-type yeast cells hampers frequency measurements, but the sgs1Δ allele increases the frequency and improves quantification of drug effects. Sgs1, a member of the RecQ helicase family of DNA unwinding proteins which maintain genome stability, is defective in the premature aging disorder Werner’s syndrome and in the cancer-prone disorder Blooms’ syndrome. We find that the combination drug treatment reduces the frequency of small chromosomal changes involving point mutations, deletions, insertions and frame-shifts along with gross chromosomal rearrangements in sgs1Δ cells down to the level found in wild-type cells at days 7 and 13 of a CLS assay (Fig. 2C and 2D). The individual drugs produce no such reductions. Thus, the drug combination generates a greater than additive increase in genomic stability, which is at least in part due to down-regulation of the TORC1-Sch9 pathway (see below).
We also measured the effect of drug treatment on the frequency of small chromosomal mutations in wild-type DBY746 cells and find that dual drug treatment produces a statistically significant reduction in mutation frequency whereas the individual drugs do not reduce mutation frequency (Fig. S2).
Mitochondrial function
Mitochondria are the primary organelle for eukaryotic energy generation whose byproducts include reactive oxygen species (ROS) that seem to protect cells at relatively low levels, but damage cells at high levels and increase the rate of aging while reducing lifespan (Pan 2011; Ristow & Schmeisser 2011; Rubinsztein et al. 2011; Finkel 2012). Mitochondrial function declines with age and is thought to hasten the onset of age-associated diseases (Green et al. 2011; Niccoli & Partridge 2012). Superior mitochondrial function, as measured by respiration rate, is vital for yeast survival and is observed in long-lived mutant cells or wild-type cells treated with a high concentration of rapamycin or myriocin (Pan 2011; Pan et al. 2011; Huang et al. 2012; Longo et al. 2012). With dual drug treatment there is an increase in oxygen consumption in both log and stationary phase cells compared to untreated cells or cells treated with a single drug (Fig. 3A), consistent with increased lifespan (Fig. 1B–E). Since mitochondria generate most cellular ROS (Pan et al. 2011), we examined the level of superoxide by using dihydroethidium (DHE). There is an equal amount of superoxide in untreated or drug-treated log phase cells, but by stationary phase the level of superoxide is lower in cells treated with both drugs (Fig. 3B). While DHE primarily detects superoxide, it also detects other ROS such as the abundant hydrogen peroxide. To specifically measure hydrogen peroxide, we used 2′,7′-dichlorodihydrofluorescein (H2DCF-DA) and the results show that hydrogen peroxide is more abundant in log phase but lower in stationary cells treated with both drugs (Fig. 3C). These results support the view that combination drug treatment modulates superoxide and ROS levels to enhance CLS in ways that are similar to what has been observed in long-lived cells with reduced TORC1 or Sch9 activity (Mesquita et al. 2010; Pan et al. 2011).
Fig. 3.

Mitochondrial function and ROS levels are remodeled by combination drug treatment. (A) The rate of oxygen consumption is higher in log (A600nm = 1.0) and stationary phase cells (CLS day1) treated with both myriocin and rapamycin than in cells treated with a single drug or with no drug. (B) Combination drug treatment does not affect the concentration of superoxide anions in log phase cells, but does lower the concentration in stationary phase cells. (C) Dual drug treatment increases the concentration of hydrogen peroxide in log phase cells but reduces it in stationary phase cells.
Effect of the drug combination on TORC1
Activation of Sch9 requires phosphorylation by both TORC1 and Pkh1/2 (Urban et al. 2007). To determine if synergy is created upstream of one or both of these kinases, we examined phosphorylation of Sch9. Moderately high doses of myriocin are known to lower Pkh1/2 activity, causing a reduction in Sch9 phosphorylation on residue T570 (Huang et al. 2012). Neither the low dose of myriocin or rapamycin used here alters T570 phosphorylation (Fig. 4A, top panel). In contrast, the combination treatment causes about a 40% reduction in phosphorylation and, in addition, lowers the level of Sch9 protein by about 30%. Furthermore, the mobility of Sch9 shifts downward in the sample treated with the drug combination (Fig. 4A, lane 4), indicative of reduced C-terminal phosphorylation by TORC1 (Urban et al. 2007).
Fig. 4.

Combination drug treatment regulates signaling pathways that modulate aging and lifespan. (A) Phosphorylation of residue T570 of Sch9 in log phase (A600nm=1.0) DBY746 cells was monitored by using a phosphor-specific antibody (upper panel, Sch9-T570-P) whereas total Sch9 protein was measured by using a different antibody (middle panel). The ratio of phosphorylated to unphosphorylated T570 is shown below each lane in the top panel and below that are the average values, normalized to the no drug treatment. Total Sch9 protein was quantified for each lane (middle row of blots), averaged, and the average was normalized to the Vma2 loading control. (B) Phosphorylation of C-terminal residues in Sch9 by TORC1 is greatly reduced by combination drug treatment in log phase DBY746 cells producing HA-tagged Sch9. The ratio of phosphorylated (+P) to dephosphorylated (−P) is shown below the top panel. A high dose of rapamycin was used as a control to down-regulate TORC1 activity and cause nearly complete dephosphorylation of C-terminal residues (lane 5). (C) Combination drug treatment lowers TORC1 pathway activity. TORC1 activity was evaluated in log phase cells by measuring β-galactosidase activity in DBY746 cells carrying a MEP2-lacZ gene. (D) Dual drug treatment greatly reduces PKA activity as shown by decreased phosphorylation of the Atg13 protein. The panels show immunoblots made by using HA-tagged Atg13 protein immunoprecipitated from log phase (A600nm=1.0) DBY746 cells. The upper panel was probed with an antibody specific for PKA phosphorylation sites (Atg13-P) and the lower panel for total HA-tagged Atg13 protein (Atg13-3HA). The numerical ratio of the PKA-specific phosphorylation to total Atg13-3HA protein is shown below the panels (Atg13-P/Atg13). (E) Combination drug treatment activates the Snf1/AMPK pathway. Snf1/AMPK pathway activity was quantified by measuring β-galactosidase activity in log (Insert, A600nm=1.0, 16 hrs of incubation), post-diauxic shift (40 hrs of incubation) or stationary phase (70 hrs of incubation) DBY746 cells carrying pBGM18-ADH2/lacZ.
The effect of the combination drug treatment on C-terminal phosphorylation was quantified by using chemically fragmented Sch9 with a C-terminal 5-HA tag and then calculating the ratio of phosphorylated to non-phosphorylated C-terminal fragments (Fig. 4B, +P/−P). The combination drug treatment reduces phosphorylation by about 80% compared to no drug or single drug treatment (Fig. 4B, compare lane 4 with lanes 1–3; see complete blots in Fig. S3). For comparison, inhibiting TORC1 with a high dose of rapamycin nearly eliminates all Sch9 C-terminal phosphorylation (Fig. 4B, lane 5). The drug combination does not reduce the Sch9 protein level in this assay (Fig. S3). This difference may be due to the C-terminal epitope tag or overproduction of Sch9 protein, since in this assay cells express the SCH9-5HA allele from a CEN-vector and the wild-type SCH9 allele from the chromosome. The reduction in TORC1 phosphorylation of Sch9 caused by the combination drug treatment is larger than an additive effect of the two drugs, suggesting that at least some degree of synergy is generated upstream of TORC1. The drug combination is having a similar but smaller effect on Pkh1/2-mediated phosphorylation of T570. Determining how the drug combination influences the level of Sch9 and the Pkh1/2 pathway will require further study.
Another branch of the TORC1 pathway controls activity of the Gln3 transcription activator which regulates expression of genes involved in nitrogen metabolism, including the MEP2 gene encoding an ammonium transporter (Marini et al. 1997). Active TORC1 represses MEP2 expression, but the combination drug treatment induces a 13-fold increase in expression of a MEP2-lacZ reporter gene compared to no drug or a single drug treatment, indicating reduction of TORC1 activity by dual drug treatment (Fig. 4C). For comparison, strongly reducing TORC1 activity by high dose rapamycin treatment induces MEP2 expression by 32-fold (Fig. 4C). These data verify that the combination drug treatment reduces TORC1 activity to a greater degree than just an additive effect of the single drug treatments.
Activation of PKA
TORC1 and Sch9 function in networks to regulate cellular processes and one network link is with protein kinase A (PKA) which, like TORC1 and Sch9, plays roles in nutrient and stress sensing and CLS (Fig. 1A) (Soulard et al. 2010; De Virgilio 2012; Longo et al. 2012). To determine if the combination drug treatment lowers PKA activity, we examined Atg13 phosphorylation, since the phosphorylated form of this protein maintains autophagic flux at a low basal level in log phase cells (Stephan et al. 2009). Combination drug treatment causes a decrease in PKA-mediated phosphorylation of Atg13 compared to single or no drug treatment (Fig. 4D, top panel). Quantification of the ratio of PKA-phosphorylated Atg13 to total Atg13 protein shows that the effect of dual drug treatment is greater than additive (Fig. 4D, Atg13-P/Atg13). These results along with the GFP-Atg8 cleavage results and atg1Δ CLS data (Fig. 2A and 2B) show that the combination drug treatment increases autophagic flux and this contributes to enhancement of lifespan, all of which support the idea that combination drug treatment reduces PKA pathway activity.
AMPK/Snf1
The AMP-activated protein kinase (AMPK) is an evolutionarily conserved cellular energy sensor with vital roles in aging and lifespan (Hardie et al. 2012). Snf1, the yeast paralog of human AMPK, also performs numerous functions in yeast including ones essential for long life (De Virgilio 2012). Snf1 activity is low during log phase growth due to glucose repression, but rises as glucose is consumed. This decrease in glucose triggers the switch in energy generation from fermentation to respiration or the diauxic shift. Log phase cells treated with both drugs have an increased rate of respiration, suggesting that they have higher Snf1 activity compared to cells treated with one drug or no drug (Fig. 3A).
As another way to examine Snf1 activity, we measured expression of the ADH2 gene, encoding alcohol dehydrogenase, using an ADH2-lacZ reporter assay (Young et al. 2003). Combination drug treatment produces a small, but statistically significant increase in ADH2-lacZ expression in log phase cells, a 4-fold increase at the post-diauxic shift and a 3-fold increase at stationary phase relative to no drug or single drug treatment (Fig. 4E). Thus, dual drug treatment remodels intracellular signaling to promote activation of Snf1 and the processes it controls including respiration (Fig. 1A).
Discussion
Our data for DBY746 cells demonstrate that it is possible to produce a synergistic increase in lifespan by using low concentrations of rapamycin and myriocin (Table 1). As far as we know, this is the first example of synergistic lifespan enhancement produced by a drug combination. There seems to be no simple relationship between synergistic enhancement of survival and the concentration of drugs used to treat cells, indicating that synergy and survival result from multiple effects of the drugs and these in turn depend upon the concentration of each drug rather than their ratio.
Our data show that rather than simply reducing Sch9 activity, dual drug treatment produces more widespread effects and increases Snf1/AMPK activity while lowering activity of the PKA and TORC1 pathways. Many stresses are known to trigger a decrease in TORC1 activity in yeast and one mechanism is through binding with the Rho1 GTPase (Yan et al. 2012), an essential element of the mechanisms for sensing cell wall and membrane stress. We suggest that the combination drug treatment may, at least in part, produce a large reduction in TORC1 activity by inducing membrane and cell wall stress, which activates Rho1 causing it to bind and inhibit TORC1. Even if true, however, this explanation is likely to be only part of the overall mechanism for producing the synergy effects we observe. A thorough understanding of how the combination of myriocin and rapamycin produces a synergistic increase in yeast lifespan will likely require systems biology techniques, since the number and complexity of the signaling pathways and cellular processes uncovered by our data will be a challenge to fully understand and integrate into a coherent system by using purely intuitive approaches.
Drug synergy is an established protocol for treating infectious diseases and cancers, but is not widely touted as a strategy to prevent disease or slow aging. The idea of using rapamycin to lower TOR activity and reduce the incidence of age-related diseases and promote a healthier, longer life has been well publicized [e.g. (Blagosklonny 2006; Blagosklonny 2009; Bjedov & Partridge 2011)], particularly since it was shown to enhance lifespan in mice (Harrison et al. 2009). The therapeutic efficacy of rapamycin for treatment of cancers and other diseases is currently being evaluated in clinical trials using rapamycin alone or in combination with other drugs (http://clinicaltrials.gov). However, low dose rapamycin treatment over a long time frame has the undesirable effect of inducing insulin resistance (Lamming et al. 2012). Greater efficacy and fewer side effects may be achieved by using rapamycin in combination with myriocin or another drug to generate synergy. Moreover, low dose rapamycin therapy in combination with myriocin may be an effective way to lower the incidence of age-related diseases, since studies in rodents indicate the value of myriocin to treat diabetes, cancer, cardiomyopathy and atherosclerosis (Summers 2010; Jiang et al. 2011; Lee et al. 2012).
The cellular processes modulated by combination drug treatment in yeasts to enhance lifespan are evolutionarily conserved and this, along with data establishing the therapeutic value of rapamycin and myriocin in mammals, argues that reducing the incidence of age-related diseases in humans and improving the quality of life in the elderly by drug synergy is an achievable goal.
Experimental procedures
Yeast strains and plasmids used in this study are listed in Supplemental Information. The composition of synthetic dextrose complete (SDC) was as previously defined (Huang et al. 2012). For most experiments cells were cultured in SDC medium buffered to pH 4.5 with 200 mM Succinate (Fig.1B, 1C, 1F, Fig.2–4 and Figs. S1, S2 and S3). Experiments with BY4743 cells use SDC medium buffered to pH 6.0 with citrate phosphate (64.2 mM Na2HPO4, 17.9 mM citric acid) (Fig. 1D, 1E, 1G).
CLS was measured as previously described (Huang et al. 2012). For CLS assays involving a switch from SDC medium to water, the cells were centrifuged on 72 hrs of incubation (CLS day 1), washed twice with water and then cultured in the same volume of water as the volume of the initial culture medium. Every third day the cells were washed twice and suspended in fresh water. Stress resistance, age-dependent genomic stability, and immunoblotting assays were performed as previously described (Huang et al. 2012). Antibodies for immunoblotting included Anti-GFP (1:4,000) (Covance, Cat#: MMS-118P), Anti-Sch9 (Batch 2872, 1:1,000, OpenBiosystems), Phospho-specific anti-Sch9T570-P (1:10,000) (Urban et al. 2007), Phospho (Ser/Thr) anti-PKA substrate (1: 1,000) (Cell signaling Cat#: 9621), Anti-HA (1:4,000) (Sigma-Aldrich), Anti-Vma2 (1:4,000) (Invitrogen, Cat#: A6427). Other antibodies included alkaline phosphatase-linked anti-rabbit or anti-mouse IgG (Sigma-Aldrich). Fluorescent signals from membranes exposed to an ECF substrate (Amersham Biosciences) were analyzed by using a PhosphorImager (Bio-Rad, ChemiDoc MP Imaging System) and quantified by using Image Lab 4.0.1 Software. C-terminal phosphorylation of Sch9 was measured as described previously (Urban et al. 2007). GFP-Atg8 processing was measured as described previously (Cheong & Klionsky 2008).
To immunoprecipitate Atg13-3HA, DBY746 cells carrying pRS426-ATG13-3HA were cultured in SDC-ura supplemented with 100 μM CuSO4. Cells were grown from 0.005 to 1.0 A600nm. Then 25 A600nm units of cells were collected and total protein was extracted as described above. Anti-HA coupled sepharose beads, 30 μl (Cat#: AFC-101P, Covance) were washed 3 times with 800 μl of wash buffer [50 mM Tris-HCl, pH 7.5, 1 mM EDTA, 1% NP-40, 1× phosphatase inhibitors (10 mM NaF, 10 mM NaN3, 10 mM p-nitrophenylphosphate, 10 mM Na2P2O7, and 10 mM beta-glycerophosphate] in a 1.5 ml microfuge tube followed by centrifugation for 2 min at 2,500 rpm. The supernatant was carefully removed and the beads were resuspended by using 1 volume of protein extract (3 mg total protein) and 11 volumes of IP buffer [50 mM Tris-HCl, pH7.5, 150 mM NaCl, 1 mM EDTA, 1% NP-40, 1 mM PMSF (add freshly), 1 × phosphatase inhibitors and protease inhibitor cocktail (Cat#: 05892970001, Roche)]. Samples were incubated overnight at 4°C with gentle rotation. After incubation, the beads were washed 3 times with 1 ml wash buffer (this buffer contains 1 × phosphatase inhibitors, but no PMSF or protease inhibitors) and centrifuged 2 min at 2,500 rpm. All liquid was removed from beads and then 25 μl 2 × Laemmli sample buffer was added followed by heating at 95°C for 2 min. The sample was gently mixed and heated again for 4 min, followed by 1 min on ice, and loading on a 7.5% SDS-PAGE.
The rate of oxygen consumption was measured as previously described (Huang et al. 2012) using cells grown from an A600nm of 0.005 to 1. Oxygen consumption was measured by using a Hanstech Oxytherm monitor and the data are expressed as nmoles of oxygen consumed per min per 106 cells. For the ROS measurements, dihydroethidium staining was used to measure superoxide and 2′,7′-dichlorodihydrofluorescein staining was used to measure hydrogen peroxide (Mesquita et al. 2010). Log (A600nm=1.0) or stationary phase cells were collected, washed once with PBS and resuspended in PBS containing a 10 μM DHE or 10 μM H2DCF-DA. For DHE staining, cells were incubated for 10 min and for H2DCF-DA staining they were incubated for 90 min at 30°C and then washed twice with PBS and resuspend in 1 ml PBS. Fluorescence was measured in a fluorimeter (55 Luminescence Spectrometer, Perkin-Elmer) using 488 nm wavelength for excitation and 670 nm for emission with DHE-stained cells, and 488 nm for excitation and 530 nm emission with H2DCF-DA-stained cells. Data are presented as DHE or H2DCF-DA fluorescence per 108 cells corrected for the background fluorescence of unstained cells.
β-galactosidase activity was measured in cells grown to log (A600nm=1.0), post-diauxic shift or stationary phase. Cells were collected by centrifugation and resuspended in 1 ml of Z buffer (0.06 M Na2HPO4, 0.04 M NaH2PO4, 0.01 M KCl, 0.001 M MgSO4, 0.05 M β-mercaptoethanol, pH 7.0). Cells were made permeable by adding 25 μl chloroform and 40 μl 0.1% SDS followed by vortexing. β-galactosidase activity was expressed as nmol/min/108 cells.
Statistical analysis was performed by using a two-tailed Student’s t-test.
Supplementary Material
Fig. S1. Growth rate of cells treated with single drugs and combinations.
Fig. S2. Genomic stability in DBY746 cells during a CLS assay.
Fig. S3. Effect of drug synergy on phosphorylation of Sch9 C-terminal residues.
Table S1. Strains used in this study.
Table S2. Plasmids used in this study.
Acknowledgments
We thank Drs. B. Andre, M. Carlson, M. Hall, P. Herman, Y. Jiang, D. Klionsky, R. Loewith, and T. Young for reagents and suggestions. This work was supported by grant AG024377 from the National Institutes of Health (RCD) and in part by NIH Grant Number P20GM103486 from the National Institute of General Medical Sciences, its contents are solely the responsibility of the authors and do not necessarily represent the official views of the NIH or the NIGMS. Jun Liu was sponsored by the China Scholarship Council.
Footnotes
Author contributions
Drs. Dickson, Leggas and Huang designed the study. Dr. Huang, Jun Liu, Aaron Samide and Brad Withers performed experiments. Dr. Leggas perform data analysis to assess deviation from additivity in the survival experiments using drug combinations.. All authors contributed reagents and suggestions to the studies. Dr. Dickson wrote the text and the other authors contributed to the final text presentation.
Additional supporting information may be found in the online version of this article:
References
- Alvers AL, Fishwick LK, Wood MS, Hu D, Chung HS, Dunn WA, Jr, Aris JP. Autophagy and amino acid homeostasis are required for chronological longevity in Saccharomyces cerevisiae. Aging Cell. 2009;8:353–369. doi: 10.1111/j.1474-9726.2009.00469.x. [DOI] [PMC free article] [PubMed] [Google Scholar]
- Anderson RM, Weindruch R. The caloric restriction paradigm: implications for healthy human aging. Am J Hum Biol. 2012;24:101–106. doi: 10.1002/ajhb.22243. [DOI] [PMC free article] [PubMed] [Google Scholar]
- Bjedov I, Partridge L. A longer and healthier life with TOR down-regulation: genetics and drugs. Biochem Soc Trans. 2011;39:460–465. doi: 10.1042/BST0390460. [DOI] [PubMed] [Google Scholar]
- Blagosklonny MV. Aging and immortality: quasi-programmed senescence and its pharmacologic inhibition. Cell Cycle. 2006;5:2087–2102. doi: 10.4161/cc.5.18.3288. [DOI] [PubMed] [Google Scholar]
- Blagosklonny MV. Validation of anti-aging drugs by treating age-related diseases. Aging. 2009;1:281–288. doi: 10.18632/aging.100034. [DOI] [PMC free article] [PubMed] [Google Scholar]
- Casamayor A, Torrance PD, Kobayashi T, Thorner J, Alessi DR. Functional counterparts of mammalian protein kinases PDK1 and SGK in budding yeast. Curr Biol. 1999;9:186–197. doi: 10.1016/s0960-9822(99)80088-8. [DOI] [PubMed] [Google Scholar]
- Cheong H, Klionsky DJ. Biochemical methods to monitor autophagy-related processes in yeast. Meth Enzymol. 2008;451:1–26. doi: 10.1016/S0076-6879(08)03201-1. [DOI] [PubMed] [Google Scholar]
- Chou TC, Talalay P. Quantitative analysis of dose-effect relationships: the combined effects of multiple drugs or enzyme inhibitors. Adv Enzyme Regul. 1984;22:27–55. doi: 10.1016/0065-2571(84)90007-4. [DOI] [PubMed] [Google Scholar]
- De Virgilio C. The essence of yeast quiescence. FEMS Microbiol Rev. 2012;36:306–339. doi: 10.1111/j.1574-6976.2011.00287.x. [DOI] [PubMed] [Google Scholar]
- Fabrizio P, Pozza F, Pletcher SD, Gendron CM, Longo VD. Regulation of longevity and stress resistance by Sch9 in yeast. Science. 2001;292:288–290. doi: 10.1126/science.1059497. [DOI] [PubMed] [Google Scholar]
- Finkel T. Signal transduction by mitochondrial oxidants. J Biol Chem. 2012;287:4434–4440. doi: 10.1074/jbc.R111.271999. [DOI] [PMC free article] [PubMed] [Google Scholar]
- Fontana L, Partridge L, Longo VD. Extending healthy life span--from yeast to humans. Science. 2010;328:321–326. doi: 10.1126/science.1172539. [DOI] [PMC free article] [PubMed] [Google Scholar]
- Greco WR, Park HS, Rustum YM. Application of a new approach for the quantitation of drug synergism to the combination of cis-diamminedichloroplatinum and 1-beta-D-arabinofuranosylcytosine. Cancer Res. 1990;50:5318–5327. [PubMed] [Google Scholar]
- Green DR, Galluzzi L, Kroemer G. Mitochondria and the autophagy-inflammation-cell death axis in organismal aging. Science. 2011;333:1109–1112. doi: 10.1126/science.1201940. [DOI] [PMC free article] [PubMed] [Google Scholar]
- Hardie DG, Ross FA, Hawley SA. AMPK: a nutrient and energy sensor that maintains energy homeostasis. Nat Rev Mol Cell Biol. 2012;13:251–262. doi: 10.1038/nrm3311. [DOI] [PMC free article] [PubMed] [Google Scholar]
- Harrison DE, Strong R, Sharp ZD, Nelson JF, Astle CM, Flurkey K, Nadon NL, Wilkinson JE, Frenkel K, Carter CS, Pahor M, Javors MA, Fernandez E, Miller RA. Rapamycin fed late in life extends lifespan in genetically heterogeneous mice. Nature. 2009;460:392–395. doi: 10.1038/nature08221. [DOI] [PMC free article] [PubMed] [Google Scholar]
- Huang X, Liu J, Dickson RC. Down-regulating sphingolipid synthesis increases yeast lifespan. PLoS Genet. 2012;8:e1002493. doi: 10.1371/journal.pgen.1002493. [DOI] [PMC free article] [PubMed] [Google Scholar]
- Jiang XC, Goldberg IJ, Park TS. Sphingolipids and cardiovascular diseases: lipoprotein metabolism, atherosclerosis and cardiomyopathy. Adv Exp Med Biol. 2011;721:19–39. doi: 10.1007/978-1-4614-0650-1_2. [DOI] [PubMed] [Google Scholar]
- Kapahi P, Chen D, Rogers AN, Katewa SD, Li PW, Thomas EL, Kockel L. With TOR, less is more: a key role for the conserved nutrient-sensing TOR pathway in aging. Cell Metab. 2010;11:453–465. doi: 10.1016/j.cmet.2010.05.001. [DOI] [PMC free article] [PubMed] [Google Scholar]
- Kourtis N, Tavernarakis N. Cellular stress response pathways and ageing: intricate molecular relationships. EBMO J. 2011;30:2520–2531. doi: 10.1038/emboj.2011.162. [DOI] [PMC free article] [PubMed] [Google Scholar]
- Lamming DW, Ye L, Katajisto P, Goncalves MD, Saitoh M, Stevens DM, Davis JG, Salmon AB, Richardson A, Ahima RS, Guertin DA, Sabatini DM, Baur JA. Rapamycin-induced insulin resistance is mediated by mTORC2 loss and uncoupled from longevity. Science. 2012;335:1638–1643. doi: 10.1126/science.1215135. [DOI] [PMC free article] [PubMed] [Google Scholar]
- Lee YS, Choi KM, Lee S, Sin DM, Lim Y, Lee YM, Hong JT, Yun YP, Yoo HS. Myriocin, a serine palmitoyltransferase inhibitor, suppresses tumor growth in a murine melanoma model by inhibiting de novo sphingolipid synthesis. Cancer Biol Ther. 2012;13:92–100. doi: 10.4161/cbt.13.2.18870. [DOI] [PubMed] [Google Scholar]
- Loewith R, Hall MN. Target of rapamycin (TOR) in nutrient signaling and growth control. Genetics. 2011;189:1177–1201. doi: 10.1534/genetics.111.133363. [DOI] [PMC free article] [PubMed] [Google Scholar]
- Longo VD, Shadel GS, Kaeberlein M, Kennedy B. Replicative and Chronological Aging in Saccharomyces cerevisiae. Cell Metab. 2012;16:18–31. doi: 10.1016/j.cmet.2012.06.002. [DOI] [PMC free article] [PubMed] [Google Scholar]
- Madia F, Gattazzo C, Wei M, Fabrizio P, Burhans WC, Weinberger M, Galbani A, Smith JR, Nguyen C, Huey S, Comai L, Longo VD. Longevity mutation in SCH9 prevents recombination errors and premature genomic instability in a Werner/Bloom model system. J Cell Biol. 2008;180:67–81. doi: 10.1083/jcb.200707154. [DOI] [PMC free article] [PubMed] [Google Scholar]
- Marini AM, Soussi-Boudekou S, Vissers S, Andre B. A family of ammonium transporters in Saccharomyces cerevisiae. Mol Cell Bio. 1997;17:4282–4293. doi: 10.1128/mcb.17.8.4282. [DOI] [PMC free article] [PubMed] [Google Scholar]
- Mesquita A, Weinberger M, Silva A, Sampaio-Marques B, Almeida B, Leao C, Costa V, Rodrigues F, Burhans WC, Ludovico P. Caloric restriction or catalase inactivation extends yeast chronological lifespan by inducing H2O2 and superoxide dismutase activity. Proc Natl Acad Sci USA. 2010;107:15123–15128. doi: 10.1073/pnas.1004432107. [DOI] [PMC free article] [PubMed] [Google Scholar]
- Niccoli T, Partridge L. Ageing as a risk factor for disease. Curr Biol. 2012;22:R741–752. doi: 10.1016/j.cub.2012.07.024. [DOI] [PubMed] [Google Scholar]
- Pan Y. Mitochondria, reactive oxygen species, and chronological aging: A message from yeast. Exp Gerontol. 2011;46:847–852. doi: 10.1016/j.exger.2011.08.007. [DOI] [PubMed] [Google Scholar]
- Pan Y, Schroeder EA, Ocampo A, Barrientos A, Shadel GS. Regulation of yeast chronological life span by TORC1 via adaptive mitochondrial ROS signaling. Cell Metab. 2011;13:668–678. doi: 10.1016/j.cmet.2011.03.018. [DOI] [PMC free article] [PubMed] [Google Scholar]
- Pfau SJ, Amon A. Chromosomal instability and aneuploidy in cancer: from yeast to man. EMBO Rep. 2012;13:515–527. doi: 10.1038/embor.2012.65. [DOI] [PMC free article] [PubMed] [Google Scholar]
- Plummer JL, Short TG. Statistical modeling of the effects of drug combinations. J Pharmacol Methods. 1990;23:297–309. doi: 10.1016/0160-5402(90)90058-s. [DOI] [PubMed] [Google Scholar]
- Ristow M, Schmeisser S. Extending life span by increasing oxidative stress. Free Radic Biol Med. 2011;51:327–336. doi: 10.1016/j.freeradbiomed.2011.05.010. [DOI] [PubMed] [Google Scholar]
- Rubinsztein DC, Marino G, Kroemer G. Autophagy and aging. Cell. 2011;146:682–695. doi: 10.1016/j.cell.2011.07.030. [DOI] [PubMed] [Google Scholar]
- Salk JJ, Fox EJ, Loeb LA. Mutational heterogeneity in human cancers: origin and consequences. Annu Rev Pathol. 2010;5:51–75. doi: 10.1146/annurev-pathol-121808-102113. [DOI] [PMC free article] [PubMed] [Google Scholar]
- Selman C, Tullet JM, Wieser D, Irvine E, Lingard SJ, Choudhury AI, Claret M, Al-Qassab H, Carmignac D, Ramadani F, Woods A, Robinson IC, Schuster E, Batterham RL, Kozma SC, Thomas G, Carling D, Okkenhaug K, Thornton JM, Partridge L, Gems D, Withers DJ. Ribosomal protein S6 kinase 1 signaling regulates mammalian life span. Science. 2009;326:140–144. doi: 10.1126/science.1177221. [DOI] [PMC free article] [PubMed] [Google Scholar]
- Soulard A, Cremonesi A, Moes S, Schutz F, Jeno P, Hall MN. The rapamycin-sensitive phosphoproteome reveals that TOR controls protein kinase A toward some but not all substrates. Mol Biol Cell. 2010;21:3475–3486. doi: 10.1091/mbc.E10-03-0182. [DOI] [PMC free article] [PubMed] [Google Scholar]
- Stephan JS, Yeh YY, Ramachandran V, Deminoff SJ, Herman PK. The Tor and PKA signaling pathways independently target the Atg1/Atg13 protein kinase complex to control autophagy. Proc Natl Acad Sci USA. 2009;106:17049–17054. doi: 10.1073/pnas.0903316106. [DOI] [PMC free article] [PubMed] [Google Scholar]
- Summers SA. Sphingolipids and insulin resistance: the five Ws. Curr Opin Lipidol. 2010;21:128–135. doi: 10.1097/MOL.0b013e3283373b66. [DOI] [PubMed] [Google Scholar]
- Urban J, Soulard A, Huber A, Lippman S, Mukhopadhyay D, Deloche O, Wanke V, Anrather D, Ammerer G, Riezman H, Broach JR, De Virgilio C, Hall MN, Loewith R. Sch9 is a major target of TORC1 in Saccharomyces cerevisiae. Mol Cell. 2007;26:663–674. doi: 10.1016/j.molcel.2007.04.020. [DOI] [PubMed] [Google Scholar]
- Yan G, Lai Y, Jiang Y. The TOR complex 1 is a direct target of Rho1 GTPase. Mol Cell. 2012;45:743–753. doi: 10.1016/j.molcel.2012.01.028. [DOI] [PMC free article] [PubMed] [Google Scholar]
- Young ET, Dombek KM, Tachibana C, Ideker T. Multiple pathways are co-regulated by the protein kinase Snf1 and the transcription factors Adr1 and Cat8. J Biol Chem. 2003;278:26146–26158. doi: 10.1074/jbc.M301981200. [DOI] [PubMed] [Google Scholar]
Associated Data
This section collects any data citations, data availability statements, or supplementary materials included in this article.
Supplementary Materials
Fig. S1. Growth rate of cells treated with single drugs and combinations.
Fig. S2. Genomic stability in DBY746 cells during a CLS assay.
Fig. S3. Effect of drug synergy on phosphorylation of Sch9 C-terminal residues.
Table S1. Strains used in this study.
Table S2. Plasmids used in this study.