

Abstract
OBJECTIVE
Nonalcoholic fatty liver (NAFL) is thought to contribute to insulin resistance and its metabolic complications. However, some individuals with NAFL remain insulin sensitive. Mechanisms involved in the susceptibility to develop insulin resistance in humans with NAFL are largely unknown. We investigated circulating markers and mechanisms of a metabolically benign and malignant NAFL by applying a metabolomic approach.
RESEARCH DESIGN AND METHODS
A total of 265 metabolites were analyzed before and after a 9-month lifestyle intervention in plasma from 20 insulin-sensitive and 20 insulin-resistant subjects with NAFL. The relevant plasma metabolites were then tested for relationships with insulin sensitivity in 17 subjects without NAFL and in plasma from 29 subjects with liver tissue samples.
RESULTS
The best separation of the insulin-sensitive from the insulin-resistant NAFL group was achieved by a metabolite pattern including the branched-chain amino acids leucine and isoleucine, ornithine, the acylcarnitines C3:0-, C16:0-, and C18:0-carnitine, and lysophosphatidylcholine (lyso-PC) C16:0 (area under the ROC curve, 0.77 [P = 0.00023] at baseline and 0.80 [P = 0.000019] at follow-up). Among the individual metabolites, predominantly higher levels of lyso-PC C16:0, both at baseline (P = 0.0039) and at follow-up (P = 0.001), were found in the insulin-sensitive compared with the insulin-resistant subjects. In the non-NAFL groups, no differences in lyso-PC C16:0 levels were found between the insulin-sensitive and insulin-resistant subjects, and these relationships were replicated in plasma from subjects with liver tissue samples.
CONCLUSIONS
From a plasma metabolomic pattern, particularly lyso-PCs are able to separate metabolically benign from malignant NAFL in humans and may highlight important pathways in the pathogenesis of fatty liver–induced insulin resistance.
The prevalence of nonalcoholic fatty liver (NAFL) is increasing worldwide and is now affecting >30% of adults and a considerable number of children in developed countries. NAFL represents a strong and independent predictor of type 2 diabetes, the metabolic syndrome, and cardiovascular disease, findings that are probably largely attributable to dysregulated hepatic metabolic signaling, resulting in insulin resistance, which is often found in fatty liver (1–8). In fact, in humans, among several body fat compartments that are considered to play a major role in the pathogenesis of insulin resistance as visceral fat and intramyocellular fat, liver fat is most strongly associated with insulin resistance (9,10). However, a considerable amount of subjects with NAFL and without more advanced stages of fatty liver–associated diseases remain insulin sensitive (11).
The following question remains: Can broad systematic blood screening help to find mechanisms and/or markers for the dissociation of NAFL from insulin resistance in humans? Furthermore, are these parameters also relevant in subjects without NAFL or can they even help to identify NAFL-associated insulin resistance? To address these questions in the current study, we used precise phenotyping methods in humans that allowed careful quantification of body fat compartments, liver fat content, and glucose and lipid metabolism and combined this setting with a targeted plasma metabolomic approach.
RESEARCH DESIGN AND METHODS
Subjects
Caucasians from the southern part of Germany participated in the ongoing Tübingen Lifestyle Intervention Program (12,13). Individuals were included in the study when they fulfilled at least one of the following criteria: a family history of type 2 diabetes, a BMI >27 kg/m2, and a previous diagnosis of impaired glucose tolerance and/or of gestational diabetes. They were considered healthy according to a physical examination and routine laboratory tests. The participants had no history of liver disease and did not consume more than two alcoholic drinks per day. Serum aminotransferase levels were <2.5 times the upper limit of normal. In a first approach, out of 330 subjects who met the aforementioned requirements, i.e., had measurements of body fat distribution and liver fat content, using magnetic resonance techniques at baseline (12), we randomly selected 40 subjects who had NAFL for metabolomics analysis. We then measured the identified metabolomic parameters in 17 subjects who underwent the same phenotyping strategies and who did not have NAFL. Finally, we measured the relevant metabolites in a third group of 29 subjects from whom liver tissue samples were available. Informed written consent was obtained from all participants after the nature and possible consequences of the studies were explained and the local medical ethics committee had approved the protocol.
Lifestyle intervention
The 57 subjects who underwent precise phenotyping participated in the 9-month lifestyle intervention. After the baseline measurements, individuals underwent dietary counseling and had up to 10 sessions with a dietitian. Counseling was aimed to reduce body weight, intake of calories, and, particularly, intake of calories from fat and to increase intake of fibers. Individuals were asked to perform at least 3 h of moderate sports per week. Aerobic endurance exercise (e.g., walking or swimming) with an only moderate increase in the heart rate was encouraged (13).
Total body fat, body fat distribution, and lean body mass
Measurements of total body and visceral fat and lean body mass were performed by an axial T1-weighted fast spin echo technique with a 1.5-T whole-body imager (14).
Noninvasive measurement of liver fat content and intramyocellular lipids
Liver fat content was noninvasively measured by localized proton magnetic resonance (1HMR) spectroscopy as previously described (14). NAFL was defined as liver fat content >5.56% (15). Intramyocellular lipid content of the tibialis anterior muscle was determined as previously described (14).
Oral glucose tolerance test and clinical chemical analyses
The 57 individuals who underwent precise phenotyping and the intervention also underwent a 75-g oral glucose tolerance test (OGTT) at baseline and after 9 months of lifestyle intervention. Whole-body insulin sensitivity was calculated from glucose and insulin values during the OGTT as proposed by Matsuda and DeFronzo (16). In the 29 subjects from whom liver samples were available, the homeostatic model assessment of insulin resistance (HOMA-IR) was calculated from fasting blood samples (glucose [mmol/L] ⋅ insulin [mU/L]/22.5). Blood glucose was determined using a bedside glucose analyzer (YSI, Yellow Springs, CO). Plasma insulin was determined on an ADVIA Centaur XP and all other routine parameters on an ADVIA 1800 clinical chemistry system (Siemens Healthcare Systems, Erlangen, Germany). Serum plasminogen activator inhibitor 1 was measured by ELISA (Bender MedSystems), and fetuin-A was measured by an immunoturbidimetic method (BioVendor Laboratory Medicine, Modreci, Czech Republic) (17). The metabolic syndrome was estimated based on the recommendation of the Executive Summary of the Third Report of the National Cholesterol Education Program (NCEP) Expert Panel on Detection, Evaluation, and Treatment of High Blood Cholesterol in Adults (Adult Treatment Panel III) (18).
Liver samples
The 29 Caucasians (62.8 ± 2.2 years of age; sex, 22 male/7 female; BMI, 25.5 ± 0.85 kg/m2) who underwent liver surgery were fasted overnight prior to the collection of blood samples and liver biopsies. Subjects tested negative for viral hepatitis and had no liver cirrhosis. Liver samples were taken from normal, nondiseased tissue during surgery, immediately frozen in liquid nitrogen, and stored at −80°C.
Metabolite profiling
At baseline and after 9 months of lifestyle intervention, 265 blood metabolites were analyzed by the targeted IDQ metabolomics platform from Biocrates (Innsbruck, Austria). This platform combines flow injection (acylcarnitines and glycerophospholipids), liquid chromatographic (amino acids and bile acids), gas chromatographic (free fatty acids), and mass spectrometric approaches. For the replication of the findings on palmitoyl lysophospatidylcholine (lyso-PC C16:0) in the lifestyle intervention study, lyso-PC C16:0 levels were measured with another method, targeted ultraperformance liquid chromatography mass spectrometry, in the fasting blood samples of the subjects from whom liver samples were available.
Statistical analyses
First, 40 subjects with NAFL were randomly selected from a larger group solely based on their liver fat content at baseline, when they had NAFL (liver fat content >5.56%). Subjects were then divided into two groups based on the median insulin sensitivity, which was measured from the OGTT as proposed by Matsuda and DeFronzo (16) (insulin-sensitive and insulin-resistant NAFL groups). This simple two-step approach was specifically chosen to not introduce a bias that may arise by an artificial matching process, e.g., when matching for age, sex, and or adiposity, because today it is not known how these parameters influence the relationship of liver fat content with insulin sensitivity. The same approach was chosen for the 17 subjects without NAFL (insulin-sensitive and insulin-resistant non-NAFL groups). Pearson correlations were used to test for relationships between continuous variables. Paired Student t tests were performed to compare data obtained from the same experimental group. When different groups were compared, two-sample Student t tests were applied. In addition, repeated-measures multivariate ANOVA (MANOVA) was used, which allowed us to test in a more general aspect for differences in the parameters between the insulin-sensitive and insulin-resistant groups, as well as for changes of the parameters within the subjects and to perform group × time interaction tests. For the evaluation of the mass spectrometric data, a signal-to-noise ratio of 3 was set as the limit of detection. If not otherwise stated, a significance threshold of α = 0.01 was used as a reasonable compromise between type I (false-positive) and type II (false-negative) error, as previously suggested (19). Statistical analysis was performed using Matlab version 7.9.0.529 (R2009b) (The MathWorks Inc.).
To assess the discriminative potential of metabolite subsets in a multivariate manner, we applied a wrapper-based feature subset selection approach resorting to six different heuristic optimization techniques implemented in the EvA2 framework and six classification algorithms from the WEKA package (20). We applied the feature subset selection procedures individually and additionally integrated them into an ensemble to discover particularly robust metabolite subsets (21). Comparable approaches have demonstrated their usefulness in mass spectrometry studies (22).
RESULTS
Characteristics of the subjects with NAFL
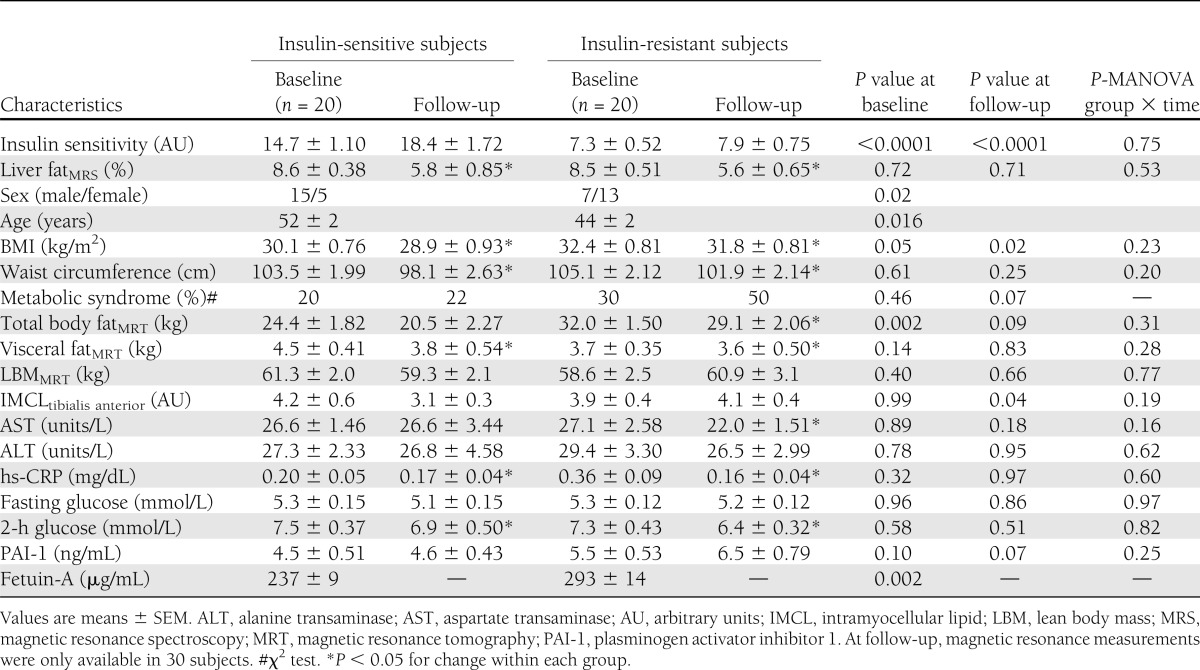
At baseline, the 20 insulin-sensitive and 20 insulin-resistant subjects in the NAFL groups had almost an identical mean liver fat content, whereas the mean insulin sensitivity differed largely based on the allocation of the subjects into the groups (Table 1). There was a dominance of males (75%) in the insulin-sensitive group and of females (65%) in the insulin-resistant group as well as a significant difference in age between the groups. The insulin-resistant women were older than the insulin-sensitive women (54 ± 4 vs. 46 ± 2 years, P = 0.06), and it is possible that more women in the insulin-resistant group were postmenopausal. General adiposity, as estimated from the BMI and precisely measured by magnetic resonance imaging, was lower in the insulin-sensitive group. No differences in plasma levels were detected for aspartate transaminase, alanine transaminase, high-sensitivity C-reactive protein (hs-CRP), fasting glucose, or 2-h glucose (Table 1). Also, no differences were found between the groups in the serum lipid profiles (Supplementary Table 1). Statistically significant higher fetuin-A levels, which may indicate elevated hepatic inflammation, were found in the insulin-resistant group. During the lifestyle intervention, liver fat content decreased significantly and to a similar extent in both NAFL groups, and the difference in insulin sensitivity remained unaltered between the groups at follow-up (Table 1). In the repeated-measures MANOVA, the statistical relationships at baseline and at follow-up, which were observed between and within the groups, were largely similar to the results of the Student t tests (data not shown).
Table 1.
Selected characteristics of the 40 subjects with NAFL at baseline and after 9 months of lifestyle intervention
Predictive effect of a metabolite pattern to separate insulin-sensitive from insulin-resistant subjects with NAFL
After the initial evaluation of 265 plasma metabolite measurements, 85 metabolites had to be excluded based on low signal intensities (Supplementary Tables 2 and 3). First, we hypothesized that a pattern of metabolites may be able to separate insulin-sensitive from insulin-resistant subjects with NAFL. The detected pattern included seven metabolites contributing to the separation of insulin-sensitive from insulin-resistant individuals with NAFL, both at baseline and at follow-up (Fig. 1A and D). We found that the sum of the levels of the metabolites of this pattern, which consisted of the branched-chain amino acids (BCAAs) leucine and isoleucine, ornithine, the acylcarnitines C3:0-, C16:0-, and C18:0-carnitine, and lyso-PC C16:0, was higher in the insulin-sensitive compared with the insulin-resistant NAFL groups at baseline and at follow-up (Fig. 1B and E). More importantly, using a naive Bayes classifier, this metabolite pattern at baseline separated insulin-sensitive from insulin-resistant subjects with a relatively high discriminatory power at baseline (area under the ROC curve, 0.77; positive predictive value, 0.75; negative predictive value, 0.88; sensitivity, 0.90; specificity, 0.70) (Fig. 1C). No such level of significance could be observed for any single metabolite. Interestingly, although many parameters changed during the intervention, the metabolite pattern measured at follow-up also discriminated the insulin-sensitive from the insulin-resistant subjects at follow-up (positive predictive value, 0.83; negative predictive value, 0.77; sensitivity, 0.75; specificity, 0.85) (Fig. 1E and F).
Figure 1.

A plasma metabolite pattern predicts insulin sensitivity in NAFL. Plasma pattern of seven metabolites consistent with lyso-PC C16:0, ornithine, leucine, isoleucine, and C3:0-, C16:0-, and C18:0-carnitine for insulin-sensitive (blue) and insulin-resistant (red) subjects with NAFL at baseline (A) and after 9 months of lifestyle intervention (D). Each axis represents one metabolite, and all axes have their common origin in the center of the circle. The circle has radius 1 and intersects all axes at 1 (at the arrowhead) and −1 (in the lower half). The blue and red stars denote the individuals represented by the levels of the corresponding metabolites, projected to the axes after mean centering and scaling to unit variance. An individual’s metabolite level was combined by equally weighted linear combination. The connecting lines between the stars meet at the center (i.e., mean) of all individuals of each group to indicate the separation of the groups in this projection. The closer the center of one of the groups is to 1, the higher the levels of the metabolites in that group compared with the comparator group. Differences in this plasma metabolite pattern between insulin-sensitive and insulin-resistant subjects with NAFL at baseline (B) and after 9 months of lifestyle intervention (E); depicted P for differences between the groups in two-sample Student t tests. P < 0.0001 for a group, P = 0.26 for time, and P = 0.55 for a group × time effect in the repeated-measures multivariate ANOVA test. Discriminating power of the plasma metabolite pattern to differentiate insulin-sensitive from insulin-resistant subjects with NAFL at baseline (C) and after 9 months of lifestyle intervention (F) (area under the ROC curve). AU, arbitrary units; AUC, area under the curve.
The metabolic fingerprints of insulin-sensitive and -resistant subjects with NAFL
Next, we investigated which of the individual metabolites were different between the insulin-sensitive and the insulin-resistant subjects with NAFL. The plasma levels of total lyso-PCs reached the significance level P < 0.01 at baseline (Fig. 2A). Within the metabolite group of lyso-PCs, lyso-PC C16:0 levels were different, with 19.4% lower plasma levels in insulin-resistant subjects (mean, 70.42 vs. 86.34 µmol/L; P = 0.0039) (Fig. 2B). Because there was a sex difference between the NAFL groups, we also adjusted for sex using general linear regression models, and the differences between the groups for total lyso-PCs and lyso-PC C16:0 were not largely affected (P = 0.008 and 0.015, respectively). Interestingly, the relationships were also not affected by the lifestyle intervention (e.g., for lyso-PC C16:0: insulin resistant, 71.79 µmol/L vs. insulin sensitive, 88.64 µmol/L), and the same differences in the metabolite parameters were found between the insulin-sensitive and the insulin-resistant NAFL groups after the intervention (Fig. 2C and D).
Figure 2.

Plasma lysophosphatidylcholine (lyso-PC) levels in insulin-sensitive and insulin-resistant subjects with NAFL. Plasma levels of total lyso-PCs (A) and lyso-PC C16:0 (B) of the insulin-sensitive group with NAFL and the insulin-resistant group with NAFL before the 9 months of lifestyle intervention (baseline). Plasma levels of total lyso-PCs (C) and lyso-PC C16:0 (D) after the 9 months of lifestyle intervention of the insulin-sensitive group with NAFL and the insulin-resistant group with NAFL; depicted P for differences between the groups in two-sample Student t tests. P = 0.001 for a group, P = 0.27 for a time, and P = 0.44 for a group × time effect (total lyso-PCs) (A and C) and P = 0.0009 for a group, P = 0.35 for a time, and P = 0.65 for a group × time effect (palmitoyl lyso-PCs) (B and D) in the repeated-measures multivariate ANOVA test.
Then, we investigated which metabolites correlated with insulin sensitivity in all 40 subjects and in the 20 insulin-sensitive and in the 20 insulin-resistant NAFL groups analyzed separately. At baseline, the most robust correlations (significant relationships with insulin sensitivity were found in all subjects and in both NAFL groups analyzed separately) were present among the lyso-PCs (Supplementary Table 4). In all 40 subjects, for example, lyso-PC C16:0 correlated not only positively with insulin sensitivity (r = 0.38, P = 0.016) but also negatively with circulating hs-CRP (r = −0.54, P = 0.0004), a marker of subclinical inflammation. During the lifestyle intervention, insulin sensitivity increased (P = 0.04) and hs-CRP levels decreased (P = 0.006), but lyso-PC C16:0 levels did not change (P = 0.37). Interestingly, at follow-up, the relationship of lyso-PC C16:0 levels with insulin sensitivity was similarly strong (r = 0.39, P = 0.014) compared with baseline; however, the relationship of lyso-PC C16:0 levels with hs-CRP levels was no longer significant (r = −0.23, P = 0.16).
Relationships of lyso-PC C16:0 levels with insulin sensitivity in subjects without NAFL
We then tested whether the blood lyso-PC C16:0 levels were also different between the respective non-NAFL groups (Supplementary Table 5). No difference in the lyso-PC C16:0 levels was found (insulin sensitive, 85.5 ± 3.3 µmol/L; insulin resistant, 84.1 ± 6.7 µmol/L; P = 0.86). Power analyses revealed that we had a power of 0.97 to find the same difference in lyso-PC C16:0 that we observed in the NAFL groups.
Relationships of lyso-PC C16:0 levels with insulin sensitivity and hepatic inflammation in subjects with liver samples
Finally, we investigated whether similar relationships were apparent in blood from subjects who underwent liver tissue sampling. Subjects in the upper (n = 7; triglyceride content, 4.8 ± 0.6%) and lower (n = 7; triglyceride content, 0.7 ± 0.07%) quartiles of liver triglyceride content were divided by the medians in fasting HOMA-IR. In the upper quartile, liver triglyceride content was not different (Supplementary Fig. 1A); however, the HOMA-IR was lower (Supplementary Fig. 1B) and lyso-PC C16:0 levels were higher (Supplementary Fig. 1C) and a trend for less inflammation was found (Supplementary Fig. 1D–F) in the insulin-sensitive compared with the insulin-resistant group. No difference in lyso-PC C16:0 levels was seen in the respective groups of the lower quartile (74.5 ± 2.4 vs. 64.8 ± 2.4 µmol/L, P = 0.56).
CONCLUSIONS
Considering that among body fat and ectopic lipid compartments, liver fat content correlates most strongly with insulin sensitivity (9,10), the fact that some subjects can accumulate large amounts of fat within the liver yet remain insulin sensitive is an unexpected finding for many researchers. However, there is increasing data supporting the existence of such a phenotype (11,12,23), and the investigation of mechanisms determining this phenotype may help to advance our knowledge, specifically about signaling and detoxification pathways that are involved in the regulation of insulin sensitivity in NAFL.
In the current study, using a plasma metabolomic approach, we first found that a metabolite pattern including the BCAAs leucine and isoleucine, ornithine, the acylcarnitines C3:0-, C16:0-, and C18:0-carnitine, and lyso-PC C16:0 was able to separate the insulin-sensitive from the insulin-resistant NAFL groups with a relatively high discriminative power. Interestingly, the same metabolomic pattern separated the NAFL groups after a lifestyle intervention, after liver fat content and insulin sensitivity had changed, yet similar relationships for liver fat and insulin sensitivity were still apparent between the groups. When we then studied the individual metabolites comprising this metabolomic pattern, we found lyso-PCs to most strongly correlate with insulin sensitivity in subjects with NAFL. These findings support that a metabolomic pattern, particularly one including lyso-PC C16:0, may be a circulating marker of insulin sensitivity in NAFL.
The metabolomic pattern that we have identified to separate the NAFL groups includes BCAAs. They were shown by interesting studies from Newgard et al., Gerszten, and others (19,24–26) to be important for the regulation of glucose metabolism. In addition, Perseghin and colleagues (27) showed that in first-degree relatives of type 2 diabetic individuals, not only glucose and fatty acid metabolism but also leucine metabolism showed resistance to insulin. In our present study, we also detected correlations of leucine and isoleucine with insulin sensitivity at baseline in our 40 subjects with NAFL. However, and in contrast to what we had expected, these relationships were positive. Interestingly, in the smaller group of 17 subjects without NAFL, these relationships were negative (both r < −0.42 and both P < 0.09). In addition, we detected a strong interaction effect of these circulating BCAAs with NAFL (both P < 0.006) but not with BMI, to determine insulin sensitivity. Although we have no explanation for this novel observation, and cannot rule out that the relatively small sample size may have brought about this finding, it may be of importance for further studies on the role of BCAAs in the regulation of insulin sensitivity, particularly in the aspect of NAFL.
What is known about the role of lyso-PCs in metabolism? Lyso-PCs in plasma are primarily generated from PCs of lipoproteins or from membrane-derived PCs by the action of secretory or lipoprotein-bound phospholipase A2. Another source of plasma lyso-PC levels is the production from PCs by endothelial lipase as well as from HDL or oxidized LDL by lecithin-cholesterol acyltransferase, which is secreted from the liver. On the other hand, lyso-PCs can also be reacylated to PC by the action of lyso-PC acyltransferase. Interestingly, most recently, a study in mice identified palmitoyl-, stearoyl-, and oleoyl-lyso-PCs to be lower in the serum of NASH animals compared with animals with simple steatosis and suggested that high lyso-PC acyltransferase activity is involved in this process (28). By the action of lysophospholipase D/autotoxin plasma, lyso-PC can also be transformed to lysophosphatidic acid and sphingosine-1-phosphate, important extracellular signaling lipids with multiple biological functions (29). Finally, the bioavailability of choline, which is required for hepatic PC genesis, plays an important role in the pathophysiology of NAFL and its progression, and is regulated by the gut microbiome (30), may determine the plasma lyso-PC levels. Interestingly, recently lyso-PC C16:0 was found to enhance glucose uptake in an insulin-independent and protein kinase C-δ–dependent manner in adipocytes (31). This finding was confirmed in vivo by glucose-lowering effects of lyso-PC C16:0 in type 1 and type 2 diabetes mouse models (31). Whether these effects and putatively beneficial effects of lyso-PC C16:0 on glucose uptake in other tissues translate into a positive effect on whole-body glucose uptake needs to be investigated in future studies.
In contrast to glucose metabolism, the role of lyso-PCs in the regulation of inflammation has been studied more extensively. It has been shown that lyso-PC C16:0 is able to inhibit reactive oxygen species production in stimulated polymorphonuclear leukocytes (32,33). As putative mechanisms of action, lyso-PCs activate G protein–coupled receptors (GPR4, G2A, and GPR119) that are involved, for example, in migration and apoptosis of immune cells, osteoclastogenesis and angiogenesis, and insulin secretion from β-cells (29). Importantly, lyso-PCs were recently found to enhance the suppressive function of human CD4+CD25+ regulatory T cells (Tregs) (34). Tregs secrete anti-inflammatory signals, inhibit macrophage migration, and induce noninflammatory M2-like macrophage differentiation (35). In addition, defects in Treg function are considered to play a role not only in autoimmune diseases, such as autoimmune hepatitis (36), but also in other causes of hepatic inflammation (37,38). In agreement with an anti-inflammatory property of lyso-PCs, we detected strong negative relationships of total lyso-PCs and lyso-PC C16:0 with hs-CRP levels in our subjects with NAFL.
We then asked whether lyso-PC C16:0 levels also differ between insulin-sensitive and insulin-resistant subjects without NAFL. No such relationship was found. Importantly, the insulin-sensitive and insulin-resistant subjects in the respective NAFL and non-NAFL groups had very similar insulin sensitivity (Fig. 3). This indicates that lyso-PC C16:0 levels may be a good marker of subclinical inflammation and insulin resistance and may putatively protect from inflammatory processes, specifically in NAFL. In support of this hypothesis, we found lyso-PC C16:0 to be negatively associated with insulin resistance in subjects with high, but not low, liver tissue lipid content. Certainly, because of the very small sample size of this group, we cannot draw definite conclusions from this observation. Importantly, the replication was not only done in a separate population than the initial screening population but another method of measurement of lyso-PC C16:0 levels was also applied. Interestingly, in the large Relationship Between Insulin Sensitivity and Cardiovascular Risk (RISC) study, lyso-PCs were also found to negatively correlate with estimated hepatic insulin resistance (39). Also in agreement with our present data, the correlations were stronger in the subjects with NAFL compared with the subjects without hepatic steatosis (A.G., personal communication). Moreover, and in agreement with our hypothesis, our liver histology data indicate that hepatic inflammation is present when plasma lyso-PC C16:0 levels are low.
Figure 3.

Relationships of liver fat content with insulin sensitivity at the baseline visit. The insert depicts the mean (SE) values for the respective groups and the level of statistical significance. *P < 0.05 for differences between the insulin-resistant and insulin-sensitive groups. P = 0.20 for differences between the insulin-sensitive and P = 0.18 for differences between the insulin-resistant groups. #P < 0.05 for differences between the insulin-resistant NAFL group and all other groups. AU, arbitrary units.
In summary, from a panel of 180 metabolites, the lyso-PC concentrations differed most strongly between insulin-sensitive and insulin-resistant subjects with NAFL. These relationships, as well as the correlations with insulin sensitivity, were still apparent after 9 months of lifestyle intervention. Interestingly, lyso-PC levels did not change during this intervention, indicating that they are genetically determined. The fact that the correlations of lyso-PC levels with insulin sensitivity and with systemic and hepatic inflammation were less strong or absent when liver fat content was low, and the knowledge about the signaling properties of lyso-PCs, supports the hypothesis that a genetically determined high lyso-PC availability may protect specifically from fatty acid–induced insulin resistance and hepatic inflammation when NAFL is present. Alternatively, elevated circulating lyso-PCs may not be functionally active in this process but represent activated pathways in the synthesis or metabolism of phospholipids and phosphatidylcholine and, thus, in the generation of hepatic endoplasmic reticulum stress (40) (Supplementary Fig. 2).
In conclusion, in the future, a metabolomic fingerprint, most robust in the class of lyso-PCs, may be able to differentiate insulin-sensitive from insulin-resistant subjects with NAFL. Furthermore, as low lyso-PC levels appear to specifically be a marker of NAFL-associated insulin resistance, these findings may highlight novel and interesting pathways for the studies on the pathogenesis of insulin resistance in NAFL.
Acknowledgments
This work was supported in part by the Competence Network for Diabetes Mellitus, funded by the Federal Ministry of Education and Research (FkZ 01 GI 1104A), a grant from the German Federal Ministry of Education and Research to the German Center for Diabetes Research, a grant from the Sino-German Center for Research Promotion (Deutsche Forschungsgemeinschaft [DFG] and Natural Science Foundation of China, GZ 753) to G.X. and R.L., and the DFG (KFO 114). N.S. is currently supported by a Heisenberg Professorship from the DFG (STE 1096/3-1).
The supporters had no influence on the study design and on the collection, analysis, and interpretation of the data.
No potential conflicts of interest relevant to this article were reported.
R.L., H.F., and N.S. researched data and wrote the manuscript. S.D., A.Z., M.H.d.A., M.S., H.S., and H.-U.H. designed the study, contributed to the discussion, and reviewed the manuscript. L.R., K.K., A.P., P.A., J.L., G.X., A.K., J.M., F.S., E.S., A.G., and A.F. researched data and edited the manuscript. All authors provided substantial contributions to conception and design, acquisition of data or analysis and interpretation of data, drafting the article or revising it critically for important intellectual content, and final approval of the version to be published. N.S. is the guarantor of this work and, as such, had full access to all the data in the study and takes responsibility for the integrity of the data and the accuracy of the data analysis.
Parts of this study were presented at the 72nd Scientific Sessions of the American Diabetes Association, Philadelphia, Pennsylvania, 8–12 June 2012.
Footnotes
This article contains Supplementary Data online at http://care.diabetesjournals.org/lookup/suppl/doi:10.2337/dc12-1760/-/DC1.
References
- 1.Cohen JC, Horton JD, Hobbs HH. Human fatty liver disease: old questions and new insights. Science 2011;332:1519–1523 [DOI] [PMC free article] [PubMed] [Google Scholar]
- 2.Roden M. Mechanisms of disease: hepatic steatosis in type 2 diabetes—pathogenesis and clinical relevance. Nat Clin Pract Endocrinol Metab 2006;2:335–348 [DOI] [PubMed] [Google Scholar]
- 3.Stefan N, Kantartzis K, Häring HU. Causes and metabolic consequences of fatty liver. Endocr Rev 2008;29:939–960 [DOI] [PubMed] [Google Scholar]
- 4.Kotronen A, Yki-Järvinen H. Fatty liver: a novel component of the metabolic syndrome. Arterioscler Thromb Vasc Biol 2008;28:27–38 [DOI] [PubMed] [Google Scholar]
- 5.Perseghin G. Viewpoints on the way to a consensus session: where does insulin resistance start? The liver. Diabetes Care 2009;32(Suppl. 2):S164–S167 [DOI] [PMC free article] [PubMed] [Google Scholar]
- 6.Cusi K. Role of obesity and lipotoxicity in the development of nonalcoholic steatohepatitis: pathophysiology and clinical implications. Gastroenterology 2012;142:711–725.e6 [DOI] [PubMed]
- 7.Gastaldelli A, Cusi K, Pettiti M, et al. Relationship between hepatic/visceral fat and hepatic insulin resistance in nondiabetic and type 2 diabetic subjects. Gastroenterology 2007;133:496–506 [DOI] [PubMed] [Google Scholar]
- 8.Larson-Meyer DE, Newcomer BR, Ravussin E, et al. Intrahepatic and intramyocellular lipids are determinants of insulin resistance in prepubertal children. Diabetologia 2011;54:869–875 [DOI] [PMC free article] [PubMed] [Google Scholar]
- 9.Stefan N, Kantartzis K, Machann J, et al. Identification and characterization of metabolically benign obesity in humans. Arch Intern Med 2008;168:1609–1616 [DOI] [PubMed] [Google Scholar]
- 10.Fabbrini E, Magkos F, Mohammed BS, et al. Intrahepatic fat, not visceral fat, is linked with metabolic complications of obesity. Proc Natl Acad Sci USA 2009;106:15430–15435 [DOI] [PMC free article] [PubMed] [Google Scholar]
- 11.Stefan N, Häring HU. The metabolically benign and malignant fatty liver. Diabetes 2011;60:2011–2017 [DOI] [PMC free article] [PubMed] [Google Scholar]
- 12.Kantartzis K, Peter A, Machicao F, et al. Dissociation between fatty liver and insulin resistance in humans carrying a variant of the patatin-like phospholipase 3 gene. Diabetes 2009;58:2616–2623 [DOI] [PMC free article] [PubMed] [Google Scholar]
- 13.Kantartzis K, Thamer C, Peter A, et al. High cardiorespiratory fitness is an independent predictor of the reduction in liver fat during a lifestyle intervention in non-alcoholic fatty liver disease. Gut 2009;58:1281–1288 [DOI] [PubMed] [Google Scholar]
- 14.Machann J, Thamer C, Stefan N, et al. Follow-up whole-body assessment of adipose tissue compartments during a lifestyle intervention in a large cohort at increased risk for type 2 diabetes. Radiology 2010;257:353–363 [DOI] [PubMed] [Google Scholar]
- 15.Szczepaniak LS, Nurenberg P, Leonard D, et al. Magnetic resonance spectroscopy to measure hepatic triglyceride content: prevalence of hepatic steatosis in the general population. Am J Physiol Endocrinol Metab 2005;288:E462–E468 [DOI] [PubMed] [Google Scholar]
- 16.Matsuda M, DeFronzo RA. Insulin sensitivity indices obtained from oral glucose tolerance testing: comparison with the euglycemic insulin clamp. Diabetes Care 1999;22:1462–1470 [DOI] [PubMed] [Google Scholar]
- 17.Stefan N, Fritsche A, Weikert C, et al. Plasma fetuin-A levels and the risk of type 2 diabetes. Diabetes 2008;57:2762–2767 [DOI] [PMC free article] [PubMed] [Google Scholar]
- 18.Expert Panel on Detection, Evaluation, and Treatment of High Blood Cholesterol in Adults Executive Summary of The Third Report of The National Cholesterol Education Program (NCEP) Expert Panel on Detection, Evaluation, And Treatment of High Blood Cholesterol In Adults (Adult Treatment Panel III). JAMA 2001;285:2486–2497 [DOI] [PubMed] [Google Scholar]
- 19.Wang TJ, Larson MG, Vasan RS, et al. Metabolite profiles and the risk of developing diabetes. Nat Med 2011;17:448–453 [DOI] [PMC free article] [PubMed] [Google Scholar]
- 20.Kronfeld M, Planatscher H, Zell A. Learning and intelligent optimization. Lect Notes Comput Sci 2010;6073:247–250 [Google Scholar]
- 21.Franken H, Lehmann R, Häring HU, Fritsche A, Stefan N, Zell A. Wrapper- and ensemble-based feature subset selection methods for biomarker discovery in targeted metabolomics. In Pattern Recognition in Bioinformatics Loog M, Wessels L, Reinders M, Ridder D, Eds. Berlin/Heidelberg, Springer, 2011, p. 121–132 [Google Scholar]
- 22.Ressom HW, Varghese RS, Abdel-Hamid M, et al. Analysis of mass spectral serum profiles for biomarker selection. Bioinformatics 2005;21:4039–4045 [DOI] [PubMed] [Google Scholar]
- 23.Amaro A, Fabbrini E, Kars M, et al. Dissociation between intrahepatic triglyceride content and insulin resistance in familial hypobetalipoproteinemia. Gastroenterology 2010;139:149–153 [DOI] [PMC free article] [PubMed] [Google Scholar]
- 24.Newgard CB, An J, Bain JR, et al. A branched-chain amino acid-related metabolic signature that differentiates obese and lean humans and contributes to insulin resistance. Cell Metab 2009;9:311–326 [DOI] [PMC free article] [PubMed] [Google Scholar]
- 25.Huffman KM, Shah SH, Stevens RD, et al. Relationships between circulating metabolic intermediates and insulin action in overweight to obese, inactive men and women. Diabetes Care 2009;32:1678–1683 [DOI] [PMC free article] [PubMed] [Google Scholar]
- 26.Würtz P, Mäkinen VP, Soininen P, et al. Metabolic signatures of insulin resistance in 7,098 young adults. Diabetes 2012;61:1372–1380 [DOI] [PMC free article] [PubMed]
- 27.Lattuada G, Sereni LP, Ruggieri D, et al. Postabsorptive and insulin-stimulated energy homeostasis and leucine turnover in offspring of type 2 diabetic patients. Diabetes Care 2004;27:2716–2722 [DOI] [PubMed] [Google Scholar]
- 28.Tanaka N, Matsubara T, Krausz KW, Patterson AD, Gonzalez FJ. Disruption of phospholipid and bile acid homeostasis in mice with nonalcoholic steatohepatitis. Hepatology 2012;56:118–129 [DOI] [PMC free article] [PubMed] [Google Scholar]
- 29.Schmitz G, Ruebsaamen K. Metabolism and atherogenic disease association of lysophosphatidylcholine. Atherosclerosis 2010;208:10–18 [DOI] [PubMed] [Google Scholar]
- 30.Corbin KD, Zeisel SH. Choline metabolism provides novel insights into nonalcoholic fatty liver disease and its progression. Curr Opin Gastroenterol 2012;28:159–165 [DOI] [PMC free article] [PubMed] [Google Scholar]
- 31.Yea K, Kim J, Yoon JH, et al. Lysophosphatidylcholine activates adipocyte glucose uptake and lowers blood glucose levels in murine models of diabetes. J Biol Chem 2009;284:33833–33840 [DOI] [PMC free article] [PubMed] [Google Scholar]
- 32.Lin P, Welch EJ, Gao XP, Malik AB, Ye RD. Lysophosphatidylcholine modulates neutrophil oxidant production through elevation of cyclic AMP. J Immunol 2005;174:2981–2989 [DOI] [PubMed] [Google Scholar]
- 33.Müller J, Petković M, Schiller J, Arnold K, Reichl S, Arnhold J. Effects of lysophospholipids on the generation of reactive oxygen species by fMLP- and PMA-stimulated human neutrophils. Luminescence 2002;17:141–149 [DOI] [PubMed] [Google Scholar]
- 34.Hasegawa H, Lei J, Matsumoto T, Onishi S, Suemori K, Yasukawa M. Lysophosphatidylcholine enhances the suppressive function of human naturally occurring regulatory T cells through TGF-β production. Biochem Biophys Res Commun 2011;415:526–531 [DOI] [PubMed] [Google Scholar]
- 35.Osborn O, Olefsky JM. The cellular and signaling networks linking the immune system and metabolism in disease. Nat Med 2012;18:363–374 [DOI] [PubMed] [Google Scholar]
- 36.Buckner JH. Mechanisms of impaired regulation by CD4(+)CD25(+)FOXP3(+) regulatory T cells in human autoimmune diseases. Nat Rev Immunol 2010;10:849–859 [DOI] [PMC free article] [PubMed] [Google Scholar]
- 37.Speletas M, Argentou N, Germanidis G, et al. Foxp3 expression in liver correlates with the degree but not the cause of inflammation. Mediators Inflamm 2011;2011:827565. [DOI] [PMC free article] [PubMed] [Google Scholar]
- 38.Peiseler M, Sebode M, Franke B, et al. FOXP3+ regulatory T cells in autoimmune hepatitis are fully functional and not reduced in frequency. J Hepatol 2012;57:125–132 [DOI] [PubMed] [Google Scholar]
- 39.Gastaldelli A, Natali A, Gall WE, et al. RISC investigators Metabolomic profile associated with hepatic insulin resistance in nondiabetic subjects: results from the RISC Study. Diabetes 2012;61(Suppl. 1):A461 [Google Scholar]
- 40.Fu S, Yang L, Li P, et al. Aberrant lipid metabolism disrupts calcium homeostasis causing liver endoplasmic reticulum stress in obesity. Nature 2011;473:528–531 [DOI] [PMC free article] [PubMed] [Google Scholar]