

Abstract
OBJECTIVE
Inflammation is associated with pancreatic β-cell apoptosis and reduced insulin sensitivity. Literature suggests that interleukin (IL)-1β may contribute to the pathogenesis of type 2 diabetes mellitus (T2DM). This study aimed to determine the efficacy, safety, and tolerability of LY2189102, a neutralizing IL-1β antibody, in T2DM patients.
RESEARCH DESIGN AND METHODS
Phase II, randomized, double-blind, parallel, placebo-controlled study of subcutaneous LY2189102 (0.6, 18, and 180 mg) administered weekly for 12 weeks in T2DM patients on diet and exercise, with or without approved antidiabetic medications.
RESULTS
LY2189102 reduced HbA1c at 12 weeks (adjusted mean differences versus placebo: −0.27, −0.38 and −0.25% for 0.6, 18 and 180 mg doses, respectively), and fasting glucose at multiple time points compared with placebo. LY2189102 also reduced postprandial glycemia, and inflammatory biomarkers, including hs-CRP and IL-6. LY2189102 was generally well tolerated.
CONCLUSIONS
Weekly subcutaneous LY2189102 for 12 weeks was well tolerated, modestly reduced HbA1c and fasting glucose, and demonstrated significant anti-inflammatory effects in T2DM patients. Neutralizing IL-1β holds promise as a convenient adjuvant treatment for T2DM.
Type 2 diabetes occurs when pancreatic β-cell function fails to compensate for insulin resistance (1,2). As the duration of diabetes increases, β-cell function progressively deteriorates, partly as a result of apoptotic cell death (3–5). Inflammation is associated with pancreatic β-cell apoptosis and reduced insulin sensitivity, supporting the notion that inflammation plays a key role in aggravating or even causing type 2 diabetes specifically or the metabolic syndrome generally (6). Interleukin (IL)-1β is an inflammatory mediator that may contribute to this pathophysiology. IL-1β expression has been observed in β-cells of patients with type 2 diabetes (7). Moreover, production and secretion of IL-1β from β-cells is induced by high glucose levels and inhibits the function and promotes the apoptosis of β-cells (7–10). The IL-1 receptor antagonist (IL-1ra) protects human β-cells from glucose-induced functional impairment (7) and apoptosis, and its expression is decreased in patients with type 2 diabetes (11).
The hypothesis that blocking IL-1β activity could be therapeutic in type 2 diabetes was tested clinically with anakinra, a recombinant IL-1ra (12,13). Results from a proof-of-concept study indicated that anakinra modestly improved hemoglobin A1c (HbA1c) relative to placebo, reduced circulating inflammatory cytokines, and showed signs of improved β-cell secretory function after 13 weeks of daily subcutaneous dosing (13). Nine months after treatment completion, anakinra-treated patients continued to have improved proinsulin/insulin ratios and reduced inflammatory cytokines; anakinra responders required less exogenous insulin than did nonresponders (14). Clinical evaluation of a neutralizing IL-1β monoclonal antibody (XOMA 052) in type 2 diabetic patients showed similar results. XOMA 052 improved HbA1c relative to placebo after a single intravenous infusion and after repeated subcutaneous dosing; improvements in fasting blood glucose and insulin sensitivity after subcutaneous dosing were also noted (15).
Typically only a small percentage of cytokine receptors require engagement to activate downstream signaling pathways, and cytokines are typically labile proteins expressed at low concentrations. Because anakinra binds to the IL-1 receptor and has a short half-life (4–6 h) (16), it is unclear whether the modest nature of the response in type 2 diabetes was related to compound-specific properties or a reflection of the role of this cytokine pathway in the disease pathogenesis. Although XOMA 052 binds and neutralizes IL-1β directly and has a longer half-life, it was dosed in a limited number of subjects and for short duration. Further evaluation of the intervention in the IL-1β pathway in diabetes would help determine whether this approach could be a successful therapy.
LY2189102 (LY) is a humanized monoclonal antibody (IgG4) that binds to IL-1β with high affinity (2.8 pmol/L) and neutralizes its activity. Previous clinical studies have evaluated its safety and pharmacokinetics, as well as its effects on signs and symptoms of rheumatoid arthritis (NCT00380744). This phase II study aimed to evaluate the efficacy, safety, and tolerability of LY in type 2 patients with diabetes treated with diet and exercise, with or without approved antidiabetic medications.
RESEARCH DESIGN AND METHODS
Protocol H9C-MC-BBDK (NCT00942188) was a phase II, randomized, double-blind, parallel, placebo-controlled study in type 2 diabetic patients conducted between June 2009 and November 2010. Among 19 secondary and tertiary U.S. sites, 17 sites randomized at least 1 patient. The trial consisted of 2–6 weeks for screening and baseline; 12 weeks of treatment, and 12 weeks of follow-up (Supplementary Figure 1).
Patients were randomized 1:1:1:1 to 0.6, 18, or 180 mg LY or placebo, dosed weekly with two 1.5-mL s.c. injections for 12 weeks (13 doses). Allocation was accomplished with a computer-generated schedule; randomization was at the study level with no stratifications used. Coded medication labels were used, and all injections were identical in appearance to conceal allocation. Efficacy, safety, and tolerability were evaluated for 24 weeks (12 weeks of dosing and 12 weeks of follow-up). This study was reviewed and approved by local research ethics committees and conducted according to the principles expressed in the Declaration of Helsinki.
Basic inclusion criteria were as follows: men and women 20–75 years old, diagnosed with type 2 diabetes according to American Diabetes Association 2007 criteria (17), with duration >3 months (confirmed by fasting C-peptide levels ≥0.8 ng/mL), BMI between 25 and 40 kg/m2, and stable condition on diet and exercise with or without approved antidiabetic agents (except thiazolidinediones or insulin) for ≥ 8 weeks, and a baseline HbA1c between 7 and 10% and high-sensitivity C-reactive protein (hs-CRP) ≥2 mg/L. Anti-inflammatory drugs (including corticosteroids and nonsteroidal anti-inflammatory agents) were not permitted, except for aspirin (allowed up to 100 mg/day). It was recommended that patients be on background statin therapy per National Cholesterol Education Program Adult Treatment Panel III guidelines (18). Patients were excluded from participation if they had GAD65 autoantibodies, had evidence of tuberculosis or hepatitis B or C, had symptomatic herpes zoster or live or attenuated vaccination within 3 months of randomization, or had a screening fasting glucose ≥270 mg/dL.
The doses selected in this study were intended to provide proof of the mechanistic concept and to generate an exploratory dose-response relationship that could guide future development. The highest dose (180 mg) was considered the maximum feasible dose and was not expected to exceed previously tested and safe exposure levels. The intermediate and low doses were chosen to explore the dose-response relationship in the different pharmacodynamic end points and were based on exploratory hs-CRP data in a previous study in patients with rheumatoid arthritis.
Efficacy and pharmacodynamic assessments
Glucose-lowering assessments included HbA1c at screening and at weeks −2, 0, 6, 10, 12, 18, and 24; fasting glucose at screening and at weeks −2, 0, 1–13, 18, and 24; fasting insulin at screening and at weeks −2, 0, 2, 4, 6, 8, 10, 12, 13, 18, and 24 weeks; fasting C-peptide at screening and at weeks 12, 13, 18, and 24 weeks; and 0–2 h postprandial glucose and insulin changes after a mixed meal tolerance test (MMTT) at weeks −2, 0, 10, 12, and 24. Inflammatory and lipid biomarker measurements included hs-CRP, IL-1β, IL-1ra, IL-6, IL-8, tumor necrosis factor-α (TNF-α), plasminogen activator inhibitor 1 (PAI-1), leptin, adiponectin, fibrinogen, apolipoprotein (apo) A1, apoCIII, HDL, LDL, total cholesterol, fasting triglycerides (TG), and free fatty acids, each assessed at weeks 0, 4, 12, and 24 (hs-CRP and TGs also measured at weeks 8, 13, and 18 [both] and −2, 2, 6, and 10 [TGs]).
Safety assessments
A physical examination was conducted at each weekly visit; blood tests were performed at baseline and weeks 1, 4, 12, 18, and 24; and hypoglycemic events were captured with a patient diary. Development of immunogenicity to LY was assessed with a specific qualitative assay. LY concentrations were measured before dosing on day 0 and at all subsequent study visits.
Statistical analysis
Sample size.
The planned sample size of ~100 was sufficient for a one-sided 75% CI upper bound of −0.68% in HbA1c mean change from baseline difference between LY and placebo at end of dosing, assuming a dropout rate of 30%, SD of 0.8%, and mean change from baseline difference between LY and placebo at end of dosing of at least −0.87% HbA1c. According to data from antidiabetic compounds (data not shown), a difference of −0.87% HbA1c at 12 weeks may translate into a −1.0% HbA1c difference at 1 year.
Efficacy analyses.
Efficacy analyses were conducted with the compliant analysis set, consisting of all patients who received at least 11 doses of study drug according to the treatment assigned. Safety and tolerability were evaluated across the study duration with the full analysis set, consisting of all patients who received at least 1 dose of study drug according to the treatment assigned.
The primary efficacy analysis was the upper bound of a one-sided 75% CI of the difference in HbA1c mean change from baseline for each LY dose and all LY doses combined versus placebo at the end of dosing, as determined with an ANCOVA model with treatment, site, and baseline HbA1c as covariates. Baseline was defined as the mean of HbA1c values at weeks −2 and 0. End of dosing was defined as the mean of HbA1c values at weeks 10 and 12. All other statistical analyses were assessed at the two-sided 0.05 level.
Additional prespecified analyses included changes from baseline in HbA1c assessments; the number of patients achieving HbA1c <7% at the end of dosing and at week 24; fasting glucose, insulin, and C-peptide changes from baseline; and postprandial glucose and insulin changes after MMTT at postbaseline visits.
Pharmacodynamic analyses.
Pharmacodynamic evaluations included change from baseline for hs-CRP, IL-1β, IL-1ra, IL-6, IL-8, TNF-α, PAI-1, leptin, adiponectin, fibrinogen, apoA1, apoCIII, HDL, LDL, total cholesterol, and free fatty acids at post baseline visits. Changes from baseline versus placebo were analyzed with ANCOVA models, with treatment, site, and baseline value as covariates.
RESULTS
A total of 106 patients were randomized and comprised the full analysis set. The compliant set included 79 patients, 23 of whom received placebo, and 21, 16, and 19 of whom received 0.6, 18, and 180 mg of LY, respectively. Three patients were discontinued by the sponsor: one (placebo) because of elevated blood glucose; one (18 mg) because of failure to meet entrance criteria (randomized in error); and one (18 mg) because of noncompliance. Supplementary Figure 2 is a schematic of the subject participation.
Baseline characteristics were generally similar across treatment groups (Supplementary Table 1). The mean and median (not shown) durations of diabetes were lower in the 0.6-mg group than in the other groups. At baseline, the mean values for hs-CRP, HbA1c, and fasting glucose were highest in the 180-mg group and lowest in the 0.6-mg group. For fasting insulin, some variability was observed for the mean values across treatment groups. The majority of patients on antidiabetic medications were taking biguanides (74.1–88.5% across the four treatment groups), followed by sulfonylureas (18.5–30.8%); four patients in the 180-mg group were taking dipeptidyl peptidase 4 inhibitors; one patient in the 0.6-mg group was taking a glucagon-like peptide 1 agonist, and 1 patient in the 18-mg group had been taking thiazolidinedione derivatives before discontinuation for this protocol violation.
Glucose-lowering measures
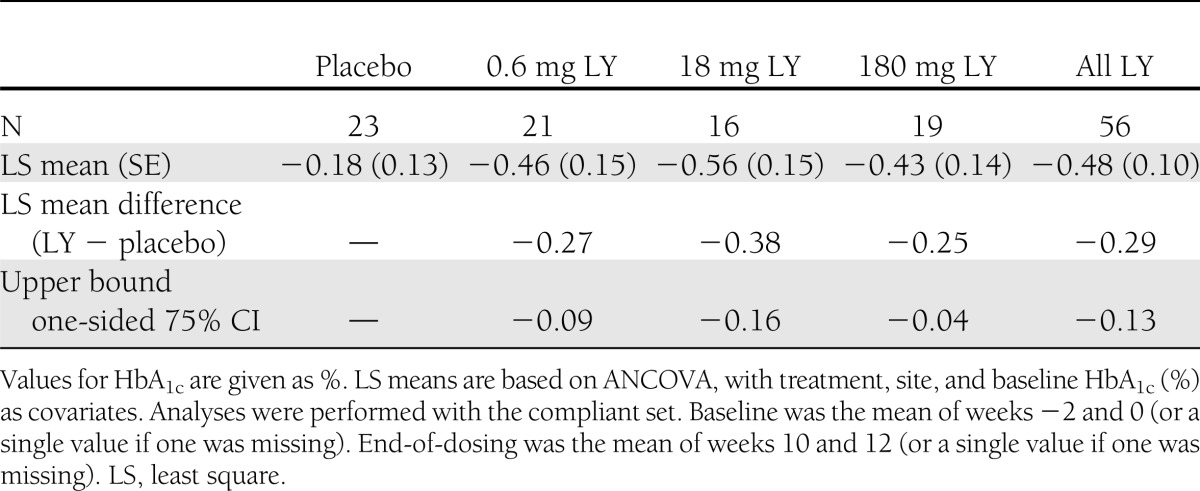
All three LY dose groups and the combined group of all LY patients showed greater reductions in change from baseline HbA1c (%) at end of dosing relative to placebo. The response was nonetheless modest, and mean reductions versus placebo ranged from −0.25 to −0.38% (Table 1). No clear difference in HbA1c effect was seen between LY doses, and the reduction in HbA1c remained evident but was partially reversed at week 24 (12 weeks after the last dose), especially for the lowest dose group (Supplementary Table 2). The percentages of patients achieving HbA1c <7% at the end of dosing were 8.7, 52.4, 31.3, and 26.3% for placebo and 0.6, 18, and 180 mg LY, respectively.
Table 1.
HbA1c change from baseline at end of dosing by treatment
Fasting glucose was reduced during the treatment period (Fig. 1A) but reversed during the follow up period. Fasting insulin and C-peptide were also evaluated throughout the study; there were no obvious differences between any LY dose group and placebo.
Figure 1.
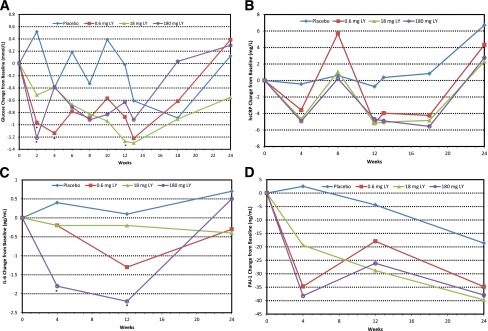
Glucose and inflammatory biomarker changes from baseline by treatment. Symbols indicate actual mean change from baseline. A: Fasting glucose. *P ≤ 0.05 versus placebo per ANCOVA in the compliant set with treatment, site, and baseline fasting glucose as covariates. Baseline means (SD) were 9.3 (1.7), 8.2 (1.8), 9.1 (2.2), and 10.3 (2.1) mmol/L for placebo and 0.6, 18, and 180 mg LY, respectively. B: Plasma hs-CRP. All LY values, except at week 8, were P ≤ 0.05 versus placebo per ANCOVA in the compliant set with treatment, site, and baseline hs-CRP as covariates. Baseline means (SD) were 6.1 (4.5), 6.2 (6.2), 6.0 (4.5), and 7.2 (7.0) mg/L for placebo and 0.6, 18, and 180 mg LY, respectively. C: IL-6. *P < 0.05 versus placebo per ANCOVA in the compliant set with treatment, site, and baseline IL-6 as covariates. Baseline means (SD) were 3.1 (1.9), 3.0 (2.0), 5.9 (12.6), and 4.1 (5.0) pg/mL for placebo and 0.6, 18, and 180 mg LY, respectively. D: PAI-1. Baseline means (SD) were 249.0 (71.9), 222.7 (51.0), 215.3 (63.8), and 219.4 (61.7) ng/mL for placebo and 0.6, 18, and 180 mg LY, respectively.
There was a significant reduction in postprandial glycemia at end of dosing for the LY treatment groups relative to placebo (measured at 2 h after meal ingestion; treatment main effect P = 0.021), with an average drop of 0.03 mmol/L for placebo and drops of 1.2, 1.4, and 2 mmol/L for 0.6, 18, and 180 mg LY, respectively (Fig. 2A); however, the effect was not significant at week 24. The ratio of the total area under the curve (AUC) for insulin to the total AUC for glucose showed a trend toward a positive LY effect (Fig. 2B) but did not reach statistical significance (P = 0.117). The trends were weaker for the insulin sensitivity index composite (19) and 2-h insulin levels (Fig. 2C and D).
Figure 2.
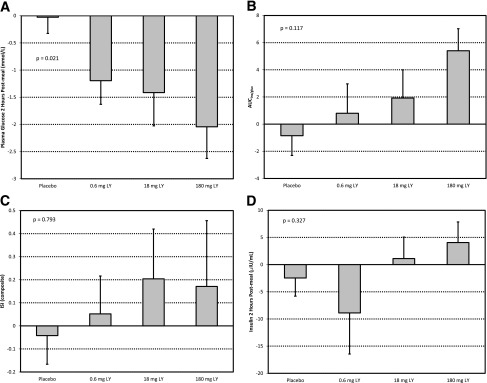
Mean change from baseline to end of dosing from MMTT analysis, by treatment group. ANCOVA main treatment effect P value shown. A: Plasma glucose (mmol/L) at 2 h after meal ingestion. B: Ratio of AUC of insulin to AUC of glucose (AUCins/gluc). C: Index of whole-body insulin sensitivity: ISI (composite) = 10,000/√(FPG ⋅ FPI) ⋅ (MMG ⋅ MMI), where FPG is fasting plasma glucose, FPI is fasting plasma insulin, MMG is mean MMTT glucose, and MMI is mean MMTT insulin (20). D: Plasma insulin (μIU/L) at 2 h after meal ingestion.
Inflammatory biomarkers
There was a significant reduction in hs-CRP at all dose levels of LY relative to placebo. This reduction appeared to occur rapidly, with maximal reduction by the first postdose measurement (week 4), and the change from baseline was significantly greater relative to placebo (P ≤ 0.05) at all dose levels and measured time points through week 24, with the exception of week 8 (Fig. 1B). The magnitude of the response was similar across all dose levels and was sustained at the end of the follow-up period. The adjusted mean hs-CRP change of −5.0 mg/L at week 12 represents a reduction of approximately 77% from the mean baseline of 6.5 mg/L for all LY patients combined.
Treatment with LY resulted in an apparent dose-related reduction from baseline in IL-6 that was significant for the 180-mg group at weeks 4 (P = 0.01) and 12 (P = 0.012) relative to placebo (Fig. 1C). PAI-1 levels were also reduced by LY (Fig. 1D), with a trend toward a dose-related relationship; however, the difference versus placebo was significant only at week 4 for all doses combined (P = 0.04). In addition, adiponectin (data not shown) trended upward versus placebo, but this trend did not reach statistical significance. For IL-1ra, TNF-α, leptin, fibrinogen, apoAI, and apoCIII, there were no obvious differences of interest (data not shown). Relative to placebo, IL-1β increased from baseline (data not shown), likely a reflection of reduced clearance caused by binding to the study drug (note that the IL-1β assay for LY interference has not been evaluated).
Other analyses
Positive LY-induced antidrug antibody responses were observed in 26 of the 79 LY-treated patients evaluated, 12 of whom had only the lowest detectable titer of 2. Of the patients positive for antidrug antibody, five had associated distinct changes in LY serum concentrations (four at 0.6 mg and one at 180 mg; data not shown), suggesting potential interference with drug clearance. There were no adverse clinical sequelae associated with generation of antidrug antibodies in any patient.
Safety results
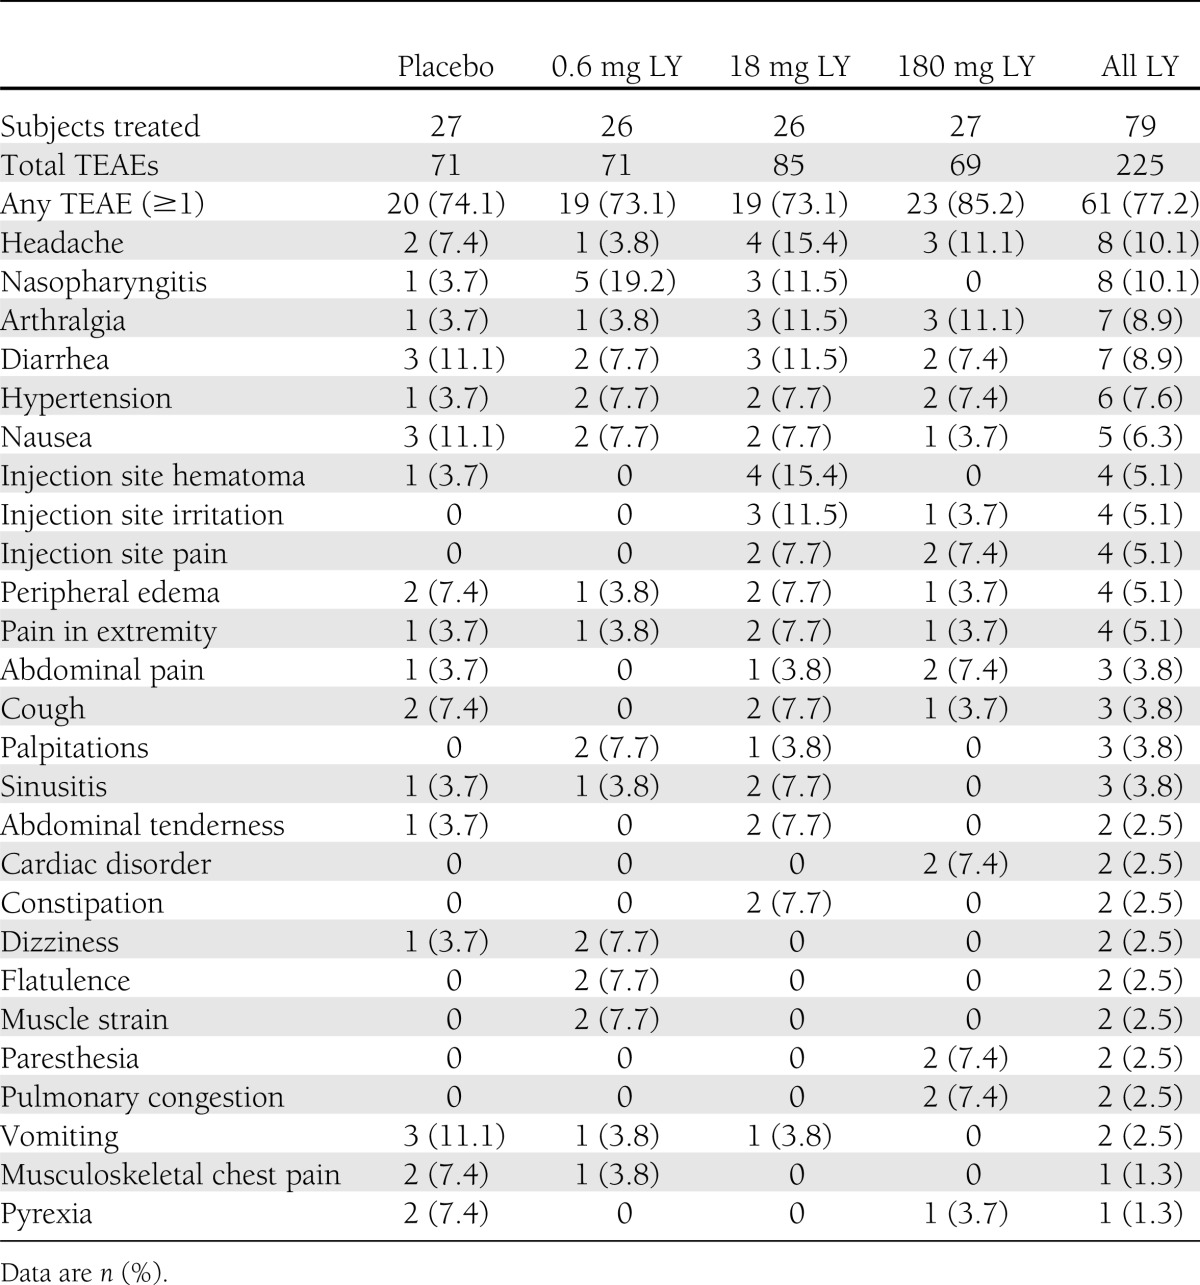
Multidose subcutaneous administration of LY to patients with type 2 diabetes was generally well tolerated at all three doses studied (Table 2). The incidence of treatment-emergent adverse events (TEAEs) was similar between all LY doses combined (77.2%) and the placebo group (74.1%). The most commonly reported TEAEs for all LY doses combined were headache (10.1%), nasopharyngitis (10.1%), arthralgia (8.9%), diarrhea (8.9%), hypertension (7.6%), nausea (6.3%), injection site hematoma (5.1%), injection site irritation (5.1%), injection site pain (5.1%), peripheral edema (5.1%), and pain in extremity (5.1%). The incidence of infections was higher for all LY doses combined (26.6% overall; 9, 6, and 6 subjects at 0.6, 18 and 180 mg, respectively) than in the placebo group (18.5%; 5 subjects). The pattern of infections observed was typical for type 2 diabetic patients, and no unusual infection types or patterns were observed. One serious adverse event (SAE) occurred in one subject at 0.6 mg (migraine) and three SAEs occurred in one subject at 18 mg (chest pain, asthma, and status asthmaticus); none of these events were considered possibly, probably, or definitely related to the study drug. Three patients (11.5%) in the 18-mg group and 2 patients (7.4%) in the 180-mg group discontinued the study because of TEAEs.
Table 2.
TEAEs in the full analysis set through 24 weeks
There were six hypoglycemic events in four subjects: one in one subject at 0.6 mg and five in three subjects at 18 mg. No events were severe, all were documented as either symptomatic (4/6) or asymptomatic (2/6), and three of the four subjects were taking additional antidiabetic medications (metformin plus a sulfonylurea in each case).
There was a slight decrease in values for neutrophils and white blood cell count in the LY groups during the dosing period. No other clinically significant differences between treatment groups were seen for hematology, serum chemistry, urinalysis, vital sign parameters, or 12-lead electrocardiography. The hypoglycemia incidence rate was 0 episodes per month for the placebo group and 0.02 episodes per month for all LY doses combined.
CONCLUSIONS
Several studies have shown elevated circulating levels of acute-phase proteins, cytokines, and chemokines to predict the incidence of type 2 diabetes, suggesting that such mediators play a significant role in the pathology of the disease (21–25). IL-1β may be a key mediator in this context because of its various proinflammatory effects (both direct and through induction of additional proinflammatory mediators from adipose tissue), inhibition of β-cell function, and promotion of β-cell apoptosis (7–9,24). Potential advantages of blocking the biological activity of IL-1β in type 2 diabetes thus include increased insulin production, improved insulin sensitivity, and slowing of disease progression by increasing β-cell burden. This study evaluated whether neutralizing IL-1β activity impacts glycemic control in type 2 diabetes and if so whether such effects are likely to be caused by increased insulin production or improved insulin sensitivity. These results further support the concept that blocking IL-1β activity improves glycemic control in type 2 diabetes, at least in part through improvement in insulin production.
Overall, improvement of glucose control was demonstrated, as reflected by reductions in HbA1c, fasting glucose, and postprandial glucose. The placebo-adjusted reductions in HbA1c ranged between −0.245 and −0.378% in the compliant treatment groups. Weekly dosing with LY for 12 weeks modestly reduced HbA1c, and a positive glycemic effect was still evident 12 weeks after the last administration. Fasting and postprandial glucose values were improved by the end of LY treatment, although this effect had waned by the end of the follow-up period at 24 weeks.
The observed glucose-lowering effect is generally consistent with results from clinical studies evaluating two other IL-1β pathway inhibitors in type 2 diabetic patients: anakinra (IL-1ra) and XOMA 052 (monoclonal antibody to IL-1β) (13,15). Collectively, these results appear to suggest that regardless of the mode of antagonism of the IL-1β pathway, only modest improvement of glycemia is to be expected.
Although the study included multiple dose levels of LY, it was not designed to provide precise dose-response relationships because of limitations of sample size. The dose-response relationship for the different end points measured in this study therefore appeared inconsistent. This inconsistency may be explained by random variability and the small sample size per treatment, and conclusions about the shape of the dose-response relationship will require larger studies.
Although the empirical results from our study do not address the mechanism of the glucose-lowering effect, results from the MMTT seem to favor an effect on insulin secretion rather than insulin sensitivity. This is consistent with the anakinra study (13), which showed improvements in β-cell function, primarily by a reduced proinsulin/insulin ratio in the anakinra-treated groups, and no improvement in insulin sensitivity. Further, a subset of anakinra-treated patients with HbA1c reductions at 13 weeks (anakinra responders) maintained improved β-cell function 39 weeks later, whereas placebo-treated and anakinra nonresponders had further declines in β-cell function (14,26). Moreover, XOMA 052 was shown to improve insulin production at 1 and 3 months after a single dose (15). Taken together, these data suggest that neutralizing the effect of IL-1β results in limited improvement in glycemic control during the course of a few weeks to months, at least in part as a result of improvements in insulin secretion.
Antagonizing IL-1β led to a clear and general anti-inflammatory response, exemplified by the potent and durable effect on hs-CRP. The reduction in hs-CRP appeared to occur rapidly, with apparent maximal reduction by the earliest time point evaluated, consistent with the observations of Larsen et al. (13). Moreover, the magnitude of reduction was similar at all dose levels and sustained through the duration of the follow-up period. Anti-inflammatory pharmacology of LY was also seen in the general reductions of PAI-1 and IL-6. In addition, LY increased adiponectin, which has been associated with improved β-cell function (27) and negatively correlated with inflammation (28).
Because elevated circulating proinflammatory mediators are correlated with type 2 diabetes incidence (21–25), patients with higher levels of inflammation may be more responsive to anti-inflammatory intervention. A post hoc linear regression analysis was conducted to evaluate the relationship between baseline hs-CRP and glucose-lowering response to LY. Changes from baseline in both fasting glucose and HbA1c appeared to correlate weakly with baseline hs-CRP, such that higher starting hs-CRP serum concentration was associated with an improved glycemic response at the end of dosing. Elevated IL-1ra levels are found in nondiabetic individuals who are likely to develop diabetes (29), whereas patients with established overt type 2 diabetes have reduced IL-1ra expression in both β-cells and serum (11). Low baseline IL-1ra serum levels predicted better glycemic and β-cell secretory responses to anakinra treatment (14). Further, an increased frequency of the single nucleotide polymorphism rs4251961 allele C of the IL-1ra gene (IL1RN) and associated lower baseline IL-1ra and higher IL-1β serum concentrations were observed in the anakinra responders relative to the anakinra nonresponders (14).
LY was generally well tolerated, and no SAEs were attributed to the agent during the course of the study. The frequency of TEAEs was similar between LY and placebo groups other than a higher number of infections, all of which were mild to moderate, in the LY groups than in the placebo group. A dose-related mild neutrophil reduction occurred and resolved after discontinuation of LY. Although the study was not designed to look at immune status, the infection and neutrophil observations may be related to the mechanism of action. There were no other clinically significant abnormal laboratory test results of note. This study, however, does not address long-term safety.
A substantial fraction of patients (26 patients; 33%) exhibited antidrug antibody responses. Most were of low titer, however, and the sequelae were generally minor. Only 5 patients (19%) exhibited distinct changes in the pharmacokinetic profiles, and there were no discernible adverse events associated with the development of antidrug antibodies.
Because type 2 diabetes appears to result from a long-standing process that involves inflammation, long-term intervention may be required. A case-cohort study found elevated IL-1ra levels for as long as 13 years before diagnosis and also an accelerated increase in IL-1ra during the last 6 years before diagnosis of type 2 diabetes (29). Increased IL-1ra levels thus may reflect a reaction to counterregulate the immunologic and metabolic disturbances before the onset of type 2 diabetes. One might speculate that greater benefits might be seen over periods of many years or with earlier intervention. The results from short-term studies do not adequately address whether IL-1β blockade can modify diabetes progression through pancreatic β-cell protection and survival. In the current study, some of the initial benefits appeared to decline within a few months after dosing was stopped, suggesting that long-term benefits might require continued treatment.
The potent effect of LY on inflammatory biomarkers raises the possibility of its use as a treatment in other conditions in which inflammation may play a significant pathologic role. For example, cardiovascular disease is associated with a chronic inflammatory state (23,30) and is often a comorbidity of type 2 diabetes. LY decreased hs-CRP, PAI-1, and IL-6, so it may ameliorate cardiovascular events, and long-term studies are required to evaluate this.
In conclusion, weekly subcutaneous administration of LY for 12 weeks to type 2 diabetic patients resulted in modest reductions in HbA1c, blood glucose, and multiple inflammatory biomarkers. Larger, long-term studies are required to determine the potential therapeutic utility of LY for this indication.
Acknowledgments
A.D.G. is a full-time employee of the National Research Council of Italy, Rome, Italy.
This research was supported by Eli Lilly and Company, Indianapolis, Indiana. J.S.-L., E.A.-R., J.P, J.W.M., J.C.S., and W.H.L. are full-time employees of Eli Lilly and Company and are also minor stock owners as part of an employee offering program. J.K.B. is a full-time employee of Cetero Research, San Antonio, Texas. No other potential conflicts of interest relevant to this article were reported.
J.S.-L., E.A.-R., J.P., J.W.M., J.C.S., and W.H.L. contributed to design of the study, analyzed and interpreted data, wrote the manuscript, reviewed and edited the manuscript, and contributed to discussion. A.D.G. had substantial contribution to analysis and interpretation of data and reviewed and edited the manuscript. J.K.B. had substantial contributions to acquisition of data and reviewed and edited the manuscript. A.D.G. and J.K.B. together are guarantors of this work and, as such, had full access to the data and take responsibility for the integrity of the data (J.K.B.) and the accuracy of the data analysis (J.K.B. and A.D.G.).
Parts of this study were presented in abstract form at the 71st Scientific Sessions of the American Diabetes Association, San Diego, California, 24–28 June 2011 and at the 47th European Association for the Study of Diabetes, Lisbon, Portugal, 12–16 September 2011.
The authors thank Philip Ross, MedStrat Communications, for editorial assistance in preparing the manuscript.
APPENDIX
Trial investigators: Dr. Opada Alzohaili, Michigan; Dr. Vanita Aroda, Washington, DC; Dr. Raymond Bell, Alabama; Dr. Jolene Berg, Texas; Dr. Gloria Cha, Texas; Dr. Richard Christensen, Idaho; Dr. Mark Christiansen, California; Dr. Adrian Dobs, Maryland; Dr. Abel Murillo, Florida; Dr. Ronald K. Garcia, Texas; Dr. Sinikka Green, California; Dr. Israel Hartman, Texas; Dr. John A. Hoekstra, Virginia; Dr. Serge A Jabbour, Pennsylvania; Dr. David Larsen, Utah; Dr. Earl Martin, Texas; Dr. Purvi Mehra, Pennsylvania; Dr. Dennis Riff, California; Dr. Lawrence A. Galitz, Florida.
This article contains Supplementary Data online at http://care.diabetesjournals.org/lookup/suppl/doi:10.2337/dc12-1835/-/DC1.
Clinical trial reg. no. NCT00942188, clinicaltrials.gov.
References
- 1.Cerasi E, Luft R. Insulin response to glucose infusion in diabetic and non-diabetic monozygotic twin pairs. Genetic control of insulin response? Acta Endocrinol (Copenh) 1967;55:330–345 [DOI] [PubMed] [Google Scholar]
- 2.DeFronzo RA. Lilly lecture 1987. The triumvirate: β-cell, muscle, liver. A collusion responsible for NIDDM. Diabetes 1988;37:667–687 [DOI] [PubMed] [Google Scholar]
- 3.Butler AE, Janson J, Bonner-Weir S, Ritzel R, Rizza RA, Butler PC. β-Cell deficit and increased β-cell apoptosis in humans with type 2 diabetes. Diabetes 2003;52:102–110 [DOI] [PubMed] [Google Scholar]
- 4.Hellerström C. The life story of the pancreatic B cell. Diabetologia 1984;26:393–400 [DOI] [PubMed] [Google Scholar]
- 5.Donath MY, Halban PA. Decreased beta-cell mass in diabetes: significance, mechanisms and therapeutic implications. Diabetologia 2004;47:581–589 [DOI] [PubMed] [Google Scholar]
- 6.Donath MY, Schumann DM, Faulenbach M, Ellingsgaard H, Perren A, Ehses JA. Islet inflammation in type 2 diabetes: from metabolic stress to therapy. Diabetes Care 2008;31(Suppl. 2):S161–S164 [DOI] [PubMed] [Google Scholar]
- 7.Maedler K, Sergeev P, Ris F, et al. Glucose-induced β cell production of IL-1β contributes to glucotoxicity in human pancreatic islets. J Clin Invest 2002;110:851–860 [DOI] [PMC free article] [PubMed] [Google Scholar]
- 8.Maedler K, Spinas GA, Lehmann R, et al. Glucose induces β-cell apoptosis via upregulation of the Fas receptor in human islets. Diabetes 2001;50:1683–1690 [DOI] [PubMed] [Google Scholar]
- 9.Maedler K, Størling J, Sturis J, et al. Glucose- and interleukin-1β-induced β-cell apoptosis requires Ca2+ influx and extracellular signal-regulated kinase (ERK) 1/2 activation and is prevented by a sulfonylurea receptor 1/inwardly rectifying K+ channel 6.2 (SUR/Kir6.2) selective potassium channel opener in human islets. Diabetes 2004;53:1706–1713 [DOI] [PubMed] [Google Scholar]
- 10.Welsh N, Cnop M, Kharroubi I, et al. Is there a role for locally produced interleukin-1 in the deleterious effects of high glucose or the type 2 diabetes milieu to human pancreatic islets? Diabetes 2005;54:3238–3244 [DOI] [PubMed] [Google Scholar]
- 11.Maedler K, Sergeev P, Ehses JA, et al. Leptin modulates β cell expression of IL-1 receptor antagonist and release of IL-1β in human islets. Proc Natl Acad Sci U S A 2004;101:8138–8143 [DOI] [PMC free article] [PubMed] [Google Scholar]
- 12.Interleukin-1 receptor antagonist and insulin sensitivity [Internet], 2010. Available from http://clinicaltrials.gov/ct2/show/NCT00928876 Accessed 12 April 2012
- 13.Larsen CM, Faulenbach M, Vaag A, et al. Interleukin-1-receptor antagonist in type 2 diabetes mellitus. N Engl J Med 2007;356:1517–1526 [DOI] [PubMed] [Google Scholar]
- 14.Larsen CM, Faulenbach M, Vaag A, Ehses JA, Donath MY, Mandrup-Poulsen T. Sustained effects of interleukin-1 receptor antagonist treatment in type 2 diabetes. Diabetes Care 2009;32:1663–1668 [DOI] [PMC free article] [PubMed] [Google Scholar]
- 15.Donath MY, Weder C, Brunner A, et al. XOMA 052, a potential disease modifying anti-IL-1beta antibody, shows sustained HbA1c reductions 3 months after a single injection with no increases in safety parameters in subjects with type 2 diabetes [abstract online], 2009. Available from http://professional.diabetes.org/Abstracts_Display.aspx?TYP=1&CID=74494 Accessed 13 April 2012
- 16.Kineret (anakinra) prescribing information [Internet], c2001–2003. Thousand Oaks, CA, Amgen. Available from: http://www.accessdata.fda.gov/drugsatfda_docs/label/2003/anakamg062703LB.pdf Accessed 12 November 2012
- 17.American Diabetes Association Standards of medical care in diabetes—2007. Diabetes Care 2007;30(Suppl. 1):S4–S41 [DOI] [PubMed] [Google Scholar]
- 18.Grundy SM, Cleeman JI, Merz CN, et al. National Heart, Lung, and Blood Institute. American College of Cardiology Foundation. American Heart Association Implications of recent clinical trials for the National Cholesterol Education Program Adult Treatment Panel III guidelines. Circulation 2004;110:227–239 [DOI] [PubMed] [Google Scholar]
- 19.Retnakaran R, Shen S, Hanley AJ, Vuksan V, Hamilton JK, Zinman B. Hyperbolic relationship between insulin secretion and sensitivity on oral glucose tolerance test. Obesity (Silver Spring) 2008;16:1901–1907 [DOI] [PubMed] [Google Scholar]
- 20.Matsuda M, DeFronzo RA. Insulin sensitivity indices obtained from oral glucose tolerance testing: comparison with the euglycemic insulin clamp. Diabetes Care 1999;22:1462–1470 [DOI] [PubMed] [Google Scholar]
- 21.Kolb H, Mandrup-Poulsen T. An immune origin of type 2 diabetes? Diabetologia 2005;48:1038–1050 [DOI] [PubMed] [Google Scholar]
- 22.Herder C, Baumert J, Thorand B, et al. Chemokines as risk factors for type 2 diabetes: results from the MONICA/KORA Augsburg study, 1984–2002. Diabetologia 2006;49:921–929 [DOI] [PubMed] [Google Scholar]
- 23.Hotamisligil GS. Inflammation and metabolic disorders. Nature 2006;444:860–867 [DOI] [PubMed] [Google Scholar]
- 24.Shoelson SE, Lee J, Goldfine AB. Inflammation and insulin resistance. J Clin Invest 2006;116:1793–1801 [DOI] [PMC free article] [PubMed] [Google Scholar]
- 25.Schenk S, Saberi M, Olefsky JM. Insulin sensitivity: modulation by nutrients and inflammation. J Clin Invest 2008;118:2992–3002 [DOI] [PMC free article] [PubMed] [Google Scholar]
- 26.van Asseldonk EJ, Stienstra R, Koenen TB, Joosten LA, Netea MG, Tack CJ. Treatment with Anakinra improves disposition index but not insulin sensitivity in nondiabetic subjects with the metabolic syndrome: a randomized, double-blind, placebo-controlled study. J Clin Endocrinol Metab 2011;96:2119–2126 [DOI] [PubMed] [Google Scholar]
- 27.Lee YH, Magkos F, Mantzoros CS, Kang ES. Effects of leptin and adiponectin on pancreatic β-cell function. Metabolism 2011;60:1664–1672 [DOI] [PubMed] [Google Scholar]
- 28.Gustafson B. Adipose tissue, inflammation and atherosclerosis. J Atheroscler Thromb 2010;17:332–341 [DOI] [PubMed] [Google Scholar]
- 29.Carstensen M, Herder C, Kivimäki M, et al. Accelerated increase in serum interleukin-1 receptor antagonist starts 6 years before diagnosis of type 2 diabetes: Whitehall II prospective cohort study. Diabetes 2010;59:1222–1227 [DOI] [PMC free article] [PubMed] [Google Scholar]
- 30.Rana JS, Nieuwdorp M, Jukema JW, Kastelein JJ. Cardiovascular metabolic syndrome - an interplay of, obesity, inflammation, diabetes and coronary heart disease. Diabetes Obes Metab 2007;9:218–232 [DOI] [PubMed] [Google Scholar]