

Abstract
OBJECTIVE
The aim was to investigate the relationships between skin autofluorescence (AF) and the impact of past glycemic control and microvascular complications in Japanese patients with type 1 diabetes.
RESEARCH DESIGN AND METHODS
Two hundred forty-one patients and 110 controls were enrolled. Advanced glycation end product accumulation was measured with AF reader. Three monthly HbA1c levels during the past 20 years were determined from medical records, and the HbA1c area under the curve (AUC) was calculated. We performed multivariate regression analyses to examine the associations between the severity of diabetes complications and various variables.
RESULTS
Skin AF values increased with increasing the severity of retinopathy (P < 10−11, linear regression analysis) and nephropathy (P < 10−5 for chronic kidney disease stage; P < 10−5 for albuminuria-based stage). HbA1c AUC values over the past 15 years were significantly correlated with skin AF values (past 5 years: R = 0.35, P < 0.0001; past 10 years: R = 0.36, P < 0.0001; past 15 years: R = 0.55, P < 0.0001; past 20 years: R = 0.22, P = 0.13). HbA1c AUC values over the past 3, 5, 10, and 15 years were significantly associated with the severity of both nephropathy and retinopathy. Multivariate analyses in which HbA1c AUC value was removed from the independent variables indicated that only skin AF was independently associated with nephropathy, whereas age at registration, age at onset of diabetes, and skin AF were independently associated with retinopathy.
CONCLUSIONS
Skin AF reflects past long-term glycemic control and may serve as a surrogate marker for the development of microvascular complications in place of HbA1c AUC value.
Advanced glycation end products (AGEs) are generated via nonenzymatic reactions of ketone or aldehyde groups of sugars with free amino groups of proteins, lipids, or nucleic acids, and these reactions are referred to as Maillard reactions (1). The accumulation of AGEs on tissue proteins has been implicated in the aging of proteins and progression of chronic age-related diseases (2). The measurement of AGE accumulation in skin biopsy specimens, as determined via AGE assays, was found to correlate with serum AGEs (3). Monnier et al. (4) reported that the average age-adjusted fluorescence values in skin biopsy specimens were two-fold greater in patients with type 1 diabetes compared with nondiabetic control subjects, and these values increased with the severity of diabetic retinopathy and nephropathy. To measure the collagen glycation in skin, invasive skin biopsy method is not applicable in routine clinical diabetes care in outpatient clinic. The measurement of plantar fascia thickness via ultrasound is a noninvasive method of measuring tissue glycation and is a significant predictor of the subsequent development of microvascular complications in type 1 diabetes (5). Recently, a noninvasive method using an autofluorescence (AF) reader for the measurement of skin AGE accumulation was developed. An AF reader calculates AF by dividing the average light intensity emitted per nanometer over the 420- to 600-nm range by the average light intensity emitted per nanometer over the 300- to 420-nm range. Meerwaldt et al. (3) reported that skin AF offers a simple alternative to invasive measurements of AGE accumulation after pepsin digestion of skin biopsy samples via collagen-linked fluorescence (CLF) (excitation at 370 nm and emission at 440 nm) and pentosidine measurements with high-performance liquid chromatography (excitation at 328 nm and emission at 378 nm), Nε-carboxymethyllysine (CML), and Nε-carboxyethyllysine (CEL) (6). They reported that skin AF correlated with pentosidine, CML, CEL, and CLF measurements obtained from skin biopsy samples (5).
However, the majority of previous studies of the measurement of AGE accumulation include Caucasian patients and, thus, the issue of racial differences is not addressed. Furthermore, previous studies using skin AF in Japanese subjects studied patients with end-stage renal disease (7), rheumatoid arthritis, osteoarthritis (8), and cerebral infarction (9). It was found that skin AF was significantly higher in patients with end-stage renal disease, rheumatoid arthritis, and cerebral infarction than that of healthy controls.
Thus, the aim of the current study was to investigate the relationships between skin AF, glucose metabolism, and diabetic vascular complications using an AF reader in Japanese patients with type 1 diabetes.
RESEARCH DESIGN AND METHODS
Subjects
Two hundred forty-one Japanese patients with type 1 diabetes were randomly selected via review of clinical notes between May 2008 and March 2010. Type 1 diabetes mellitus was defined according to criteria put forth by the Committee of the Japan Diabetes Society on the diagnostic criteria of diabetes mellitus published in 1999 (10). Patients older than 17 years with onset of type 1 diabetes were recruited. All patients were treated with multiple daily insulin injection or continuous insulin subcutaneous infusion under medical supervision in our department. One hundred ten nondiabetic and age-matched control subjects who did not have a self-reported history of diabetes, arteriosclerosis, and renal dysfunction also were recruited. Skin AF was noninvasively measured in 241 diabetic patients and 110 nondiabetic healthy subjects. Patients with psychosis or eating disorders, or both, were excluded from the study. The current study was approved by the Ethics Committee of the Tokyo Women’s Medical University School of Medicine, and written informed consent was obtained from each subject.
Skin AF
Skin AF was assessed on the ventral side of the forearm using a skin AF reader (AGE Reader; DiagnOptics BV, Groningen, the Netherlands). The AF reader is the first and only diagnostic device that noninvasively measures the tissue accumulation of AGEs using the fluorescence of ultraviolet light. Briefly, the AF reader illuminates ∼1 cm2 of skin, which is guarded from surrounding light, with an excitation light source ranging from 300 to 420 nm (peak excitation, 370 nm). AF was calculated by dividing the average light intensity emitted per nanometer over 420 to 600 nm by the average light intensity emitted per nanometer over 300 to 420 nm. Skin AF measurement was performed on the ventral side of the forearm after wiping the skin with an alcohol swab in the sitting position at room temperature. Measurement was performed once per person.
With respect to the reproducibility of the results, the coefficient of diurnal variation of the skin AF measurement was 3.7% when we repeated the skin AF measurement 10 times on the same day for 14 control subjects. Furthermore, the coefficient of daily variance was 4.6% when we repeated the skin AF measurement once per day for 5 days for each of the 9 control subjects. In the previous report, the coefficient of variation based on repeated skin AF measurements on the same day was 2.8% (n = 5) (7). These data from our present study and a previous study by others indicate that each AF value obtained in our study has little error and, therefore, is reliable.
Clinical data
Blood pressure was measured with an automatic sphygmomanometer with the patient in a sitting position in the outpatient care room. Blood glucose (electrode methods, ARKRAY), serum creatinine (Cr), HDL cholesterol, LDL cholesterol, triglycerides (enzymatic methods, HITACHI 7700), urinary albumin excretion rate (albumin:Cr ratio [ACR], mg/g Cr, latex methods, EIKENKAGAKU LX 2200). We found estimated glomerular filtration rate (eGFR; mL/min/1.73 m2) with the following revised equation for eGFR of serum Cr for Japanese subjects: eGFR (mL/min/1.73 m2) = 194 × serum Cr−1.094 × age−0.287 (×0.739); values in the parentheses were applied for females (11). HbA1c levels were measured via high-performance liquid chromatography (HA8111A until December 1991 and HA8120 model from January 1992; ARKRAY). HbA1c levels determined with the HA8111A model were calculated and converted into the data format of the HA8120 model using the following formula: y = 0.980 × −0.381. The value for HbA1c (%) is estimated as an NGSP equivalent value (%) calculated as HbA1c (%) = HbA1c (Japan Diabetes Society) (%) + 0.4%, which considers the relational expression of HbA1c (Japan Diabetes Society) (%) measured by the previous Japanese standard substance and measurement method and HbA1c NGSP (12). The value for HbA1c (International Federation of Clinical Chemistry) (mmol/mol) was calculated as HbA1c (%) = 10.93 × (Japan Diabetes Society % + 0.4) − 23.52. Serum CML and pentosidine were measured via ELISA (Benchmark Microplate Reader, SRL; Benchmark Microplate Reader, Fushimi). The degrees of retinopathy were defined as no, background, and preproliferative or proliferative retinopathy based on direct ophthalmoscopy with dilated pupils 3 months before and after the assessment of biochemical markers. Background retinopathy was defined as the presence of microaneurysm or any hemorrhages, hard exudate, or soft exudates, whereas proliferative retinopathy was defined as retinal neovascularization and vitreous hemorrhage attributable to retinal neovascularization, including the postphotocoagulate state with level 60 or higher as judged by the modified Airlie House System (13). The retinopathy stage was diagnosed by several ophthalmologists specialized in diabetic retinopathy in our institute. In this study, no blinding of the ophthalmologists was performed. For the classification of retinopathy, retinal or fundus photography was observed by well-trained ophthalmologists. Stages of nephropathy were classified by two separate methods. In the first method, chronic kidney disease (CKD) stages 1–5 defined by National Kidney Foundation practice guidelines for CKD (14) were used. In the second method, the nephropathy was classified into five stages using urinary albumin excretion values as follows: 1) normoalbuminuria (ACR <30 mg/g Cr); 2) incipient nephropathy (ACR ≥30 but <300 mg/g Cr); 3) overt nephropathy (ACR ≥300 mg/g Cr); 4) chronic renal failure (serum Cr >2.0 mg/dL); and 5) renal failure on dialysis. Three monthly HbA1c levels during the past 20 years were determined from previous medical records, and the HbA1c area under the curve (AUC) was calculated. HbA1c AUC was calculated for 3, 5, 10, 15, and 20 years from baseline. The points for HbA1c values used per person to calculate HbA1c AUC were 21 for 5 years, 41 for 10 years, 61 for 15 years, and 81 for 20 years.
Statistical analysis
Differences between groups were tested by unpaired Student t test (if normally distributed) for continuous variables. P < 0.05 (two-tailed) indicated statistical significance. The multivariate stepwise linear regression analyses were performed with SPSS version 15.0 or R version 2.15.0 for Windows. Severity of nephropathy or retinopathy was coded by integer values in the regression analysis as described in herein. Non-normal distributed values were log-transformed before inclusion in the analysis.
RESULTS
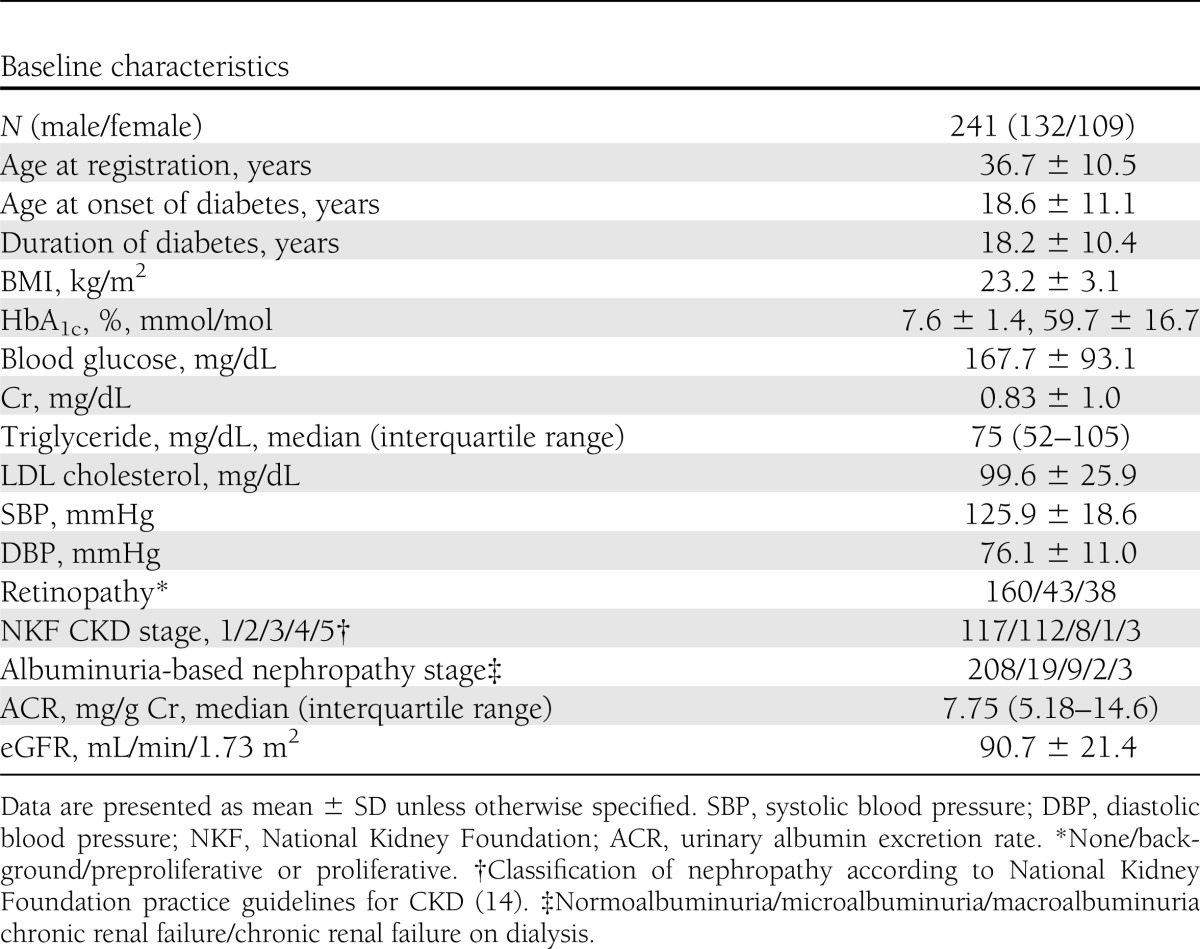
The baseline characteristics of 241 patients with type 1 diabetes are presented in Table 1. The mean age at registration was 36.7 ± 10.5 years, duration of diabetes was 18.2 ± 10.4 years, and BMI was 23.2 ± 3.1 kg/m2. Patients were subdivided into three groups according to their stage of diabetic retinopathy as follows: none (n = 160; coded as 0 in the regression analysis); background (n = 43; coded as 1); and preproliferative or proliferative (n = 38; coded as 2). Additionally, all patients were classified into five groups in two separate methods as described previously. With the first method of classification (National Kidney Foundation practice guidelines), 117, 112, 8, 1, and 3 patients were classified as having CKD stage 1, 2, 3, 4, and 5, respectively (Table 1). However, with the albuminuria-based classification, 208, 19, 9, 2, and 3 patients were classified as having CKD stage 1, 2, 3, 4, and 5, respectively (Table 1). The mean (±SD) age at registration of 110 nondiabetic subjects was 36.0 ± 9.4 years, and that of BMI was 21.9 ± 2.3 kg/m2. There was no difference in age at registration between 241 type 1 diabetic patients and 110 controls, whereas the diabetes group had higher BMI than the control group (P < 0.001).
Table 1.
Baseline characteristics of patients with type 1 diabetes
Clinical parameters correlated with skin AF
There was a positive correlation between age at registration and skin AF in patients with type 1 diabetes and nondiabetic control subjects (R = 0.43, P < 10−12; R = 0.31, P < 0.001). To exclude the influence of aging, we analyzed the difference in skin AF using the age-matched diabetic and control groups. Thus, the patients with current age younger than 41 years (156 patients with type 1 diabetes; 30.5 ± 6.0 years) and 82 age-matched controls (31.6 ± 4.9 years) were compared. There were no differences in age at registration between the 156 type 1 diabetic and 82 control subjects. Skin AF values were significantly higher in patients with type 1 diabetes (2.31 ± 0.50) than those of age-matched controls (1.95 ± 0.32; P < 10−10; Student t test) (Supplementary Fig. 1).
We also investigated whether there is an association between skin AF and various clinical parameters (n = 241). Skin AF values were positively correlated with duration of diabetes (R = 0.50; P < 10−15) in patients with type 1 diabetes. There were positive correlations between skin AF and HbA1c at baseline (R = 0.27; P < 0.0001), BMI (R = 0.15; P < 0.05), Cr (R = 0.23; P < 0.001), systolic blood pressure (R = 0.20; P < 0.01), log(ACR) (R = 0.31; P < 10−5), and log(triglycerides) (R = 0.18; P < 0.05). There was a negative correlation between skin AF and eGFR (R = −0.29; P < 10−5). There was no significant correlation between skin AF and blood glucose, LDL cholesterol, or diastolic blood pressure.
Correlation between skin AF and diabetic microvascular complications
The relationships between skin AF and diabetes microvascular complications at baseline are presented in Fig. 1. In regard to diabetic retinopathy, skin AF increased with increasing severity of retinopathy from no retinopathy (coded as 1 for the regression analysis), to background retinopathy (coded as 2), to preproliferative or proliferative retinopathy (coded as 3) (P < 10−11, linear regression analysis) (Fig. 1A). We also performed a regression analysis in which the severity of retinopathy was interpreted as a categorical variable. The results indicated that the skin AF was associated with the difference between none and background groups (P = 4.5 × 10⁻⁷) and between none and preproliferative or proliferative groups (P = 1.2 × 10⁻⁹).
Figure 1.
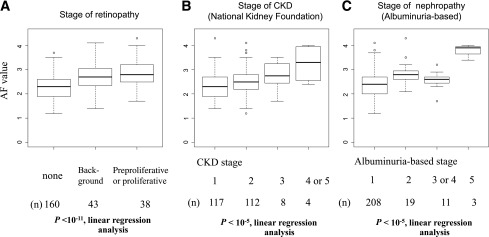
The relationships between skin AF and the stage of retinopathy or nephropathy in type 1 diabetes mellitus. The results were shown by box plots. A line within a box indicates the median, and the upper and lower squares within the box include quartiles of the points. The upper and lower horizontal bars indicate the maximum and minimum values excluding outliers. Outliers are indicated by circles. A: The patients were classified into three stages of retinopathy; i.e., “none,” “background,” and “preproliferative or proliferative.” B: The patients were classified into five classifications of CKD according to National Kidney Foundation practice guidelines (14). Stages 4 and 5 were combined because they had small numbers of the patients. In the regression analysis, stages 1, 2, and 3 were coded as 1, 2, and 3, whereas stages 4 and 5 were combined and coded as 4. C: The patients were classified into five albuminuria-based stages of nephropathy as described in the Methods. Stages 3 and 4 were combined because they had small numbers of patients. In the regression analysis, stages 1, 2, and 5 were coded as 1, 2, and 4, whereas stages 3 and 4 were combined and coded as 3.
As stated, staging of nephropathy was performed by two separate methods, i.e., one by the classification according to National Kidney Foundation practice guidelines for CKD (14), and the other by albuminuria-based method. Figure 1B shows the increase of skin AF values with the increasing stage of CKD, from 1 (coded as 1 for the regression analysis), to 2 (coded as 2), to 3 (coded as 3), to 4 or 5 (coded as 4) (P < 10−5, linear regression analysis). We also performed a regression analysis in which the severity of CKD was interpreted as a categorical variable. The results indicated that the skin AF was associated with the difference between none and stage 2 (P = 0.00095), between none and stage 3 (P = 0.021), and between none and stage 4 or 5 (P = 0.00060). Figure 1C shows the increase of skin AF values with increasing the albuminuria-based stage from 1 (coded as 1 for the regression analysis), to 2 (coded as 2), to 3 or 4 (coded as 3), to 5 (coded as 4) as described (P < 10−5, linear regression analysis). The results of the regression analysis in which the severity of nephropathy stage was incorporated as a categorical variable indicated that the skin AF was associated with the difference between none and microalbuminuria (P = 0.00022), between none and macroalbuminuria or chronic renal failure (P = 0.28), and between none and hemodialysis (P = 8.3 × 10⁻⁶). Furthermore, we examined the relationship between skin AF and diabetic retinopathy in the patients without nephropathy to exclude the impact of nephropathy. For the patients in the CKD stage 1 and CKD stage 2 groups, skin AF increased with increasing stage of retinopathy from no retinopathy (n = 158), to background retinopathy (n = 39), to preproliferative or proliferative retinopathy (n = 31) (P < 10−11, linear regression analysis) (Supplementary Fig. 2).
Past metabolic control and current skin AF
To determine the effects of past glycemic control and its duration in current skin AF, three monthly HbA1c values were determined over the past 20 years. The correlations between skin AF and HbA1c AUC for the past 3, 5, 10, 15, and 20 years from baseline were determined in patients with type 1 diabetes (Fig. 2). In the patients with type 1 diabetes, HbA1c AUC over the past 15 years significantly correlated with skin AF, and the correlation coefficient increased with increasing durations of HbA1c AUC (past 5 years, n = 179: R = 0.35, P < 0.0001; past 10 years, n = 110: R = 0.36, P < 0.0001; and past 15 years, n = 58: R = 0.55, P < 0.0001). However, there was no significant correlation between skin AF and HbA1c AUC for the past 20 years (R = 0.22; P = 0.13; n = 28). Multivariate stepwise regression analysis using duration of diabetes, age at registration, age at onset of diabetes, sex, and BMI in addition to HbA1c AUC for the past 10 years as independent variables revealed that HbA1c AUC for the past 10 years, duration of diabetes, and onset age were independent variables associated with current skin AF value (β = 0.421, P < 10−6; β = 0.470, P < 10−5; β = 0.244, P < 0.01).
Figure 2.
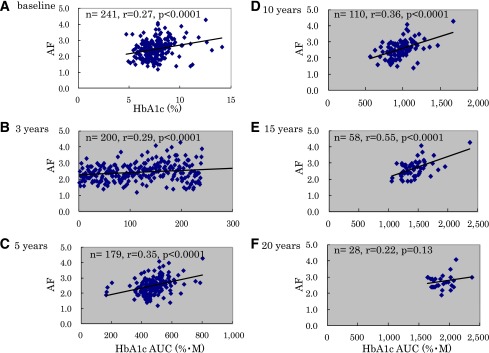
Correlation between skin AF and HbA1c at baseline or past HbA1c level. A: There were weakly positive correlations between skin AF and HbA1c at baseline (R = 0.27; P < 0.0001). B–F: The relationships between skin AF and past HbA1c levels. To determine the effects of past glycemic control and its duration on current skin AF, the correlation between HbA1c AUC values and skin AF were determined over the past 20 years. HbA1c AUC from baseline to 15 years ago was significantly correlated with skin AF (B) over the past 3 years (n = 200): R = 0.29, P < 0.0001; (C) over the past 5 years (n = 179): R = 0.35, P < 0.0001; (D) over the past 10 years (n = 110): R = 0.36, P < 0.0001; (E) over the past 15 years (n = 58): R = 0.55, P < 0.0001; and (F) over the past 20 years (n = 28): R = 0.22, P = 0.13. (A high-quality color representation of this figure is available in the online issue.)
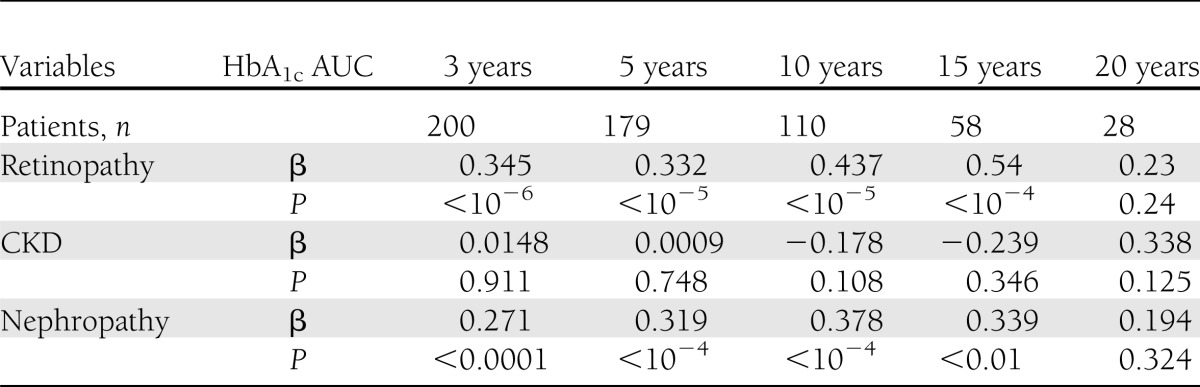
Next, we performed a univariate linear regression analysis to examine the associations between the severity of either nephropathy or retinopathy and HbA1c AUC over the past 3–20 years (Table 2 and Supplementary Figs. 3–5). As in Supplementary Fig. 3, HbA1c AUC values over 3, 5, 10, and 15 years were significantly associated with the stage of retinopathy (P < 10−6 to 10−4, linear regression analysis), whereas the association was not significant between the stage of retinopathy and HbA1c AUC value over 20 years (P = 0.24). Next, as in Supplementary Fig. 4, HbA1c AUC values over 3, 5, 10, 15, or 20 years were not significantly associated with the stage of CKD according to National Kidney Foundation practice guidelines (14) (P < 0.108–0.911, linear regression analysis). On the contrary, HbA1c AUC values over 3, 5, 10, and 15 years were significantly associated with the albumin-based stage of nephropathy (Supplementary Fig. 5) (P < 0.0001–0.01, linear regression analysis), whereas the association was not significant between the albumin-based stage of nephropathy and HbA1c AUC value over 20 years (P = 0.324). These results suggest that the albuminuria-based stage of nephropathy is a more sensitive indicator of diabetes-associated nephropathy than the stage of CKD according to the classification by National Kidney Foundation practice guidelines (14), at least in our data set.
Table 2.
Results of univariate regression analysis using the severity of retinopathy or nephropathy as a dependent variable and HbA1c AUC over the past 3–20 years as an independent variable
We performed a multivariate stepwise linear regression analysis using the albuminuria-based stage of nephropathy as a dependent variable, and age at registration, age at onset of diabetes, duration of diabetes, sex, BMI, and skin AF as well as AUC of HbA1c over the past 15 years were used as independent variables. We used the AUC data over the past 15 years rather than the other periods because this was the longest period in which the clear associations with the diabetes complications were observed. The results indicated that AUC of HbA1c over the past 15 years (β = 0.454; P < 0.01) and sex (β = −0.282; P < 0.05; male > female) were significantly associated with the albuminuria-based stage of nephropathy. Equivalent multivariate linear regression analysis was performed to search for factors independently associated with retinopathy by using the severity of retinopathy as a dependent variable, and age at registration, age at onset of diabetes, duration of diabetes, sex, BMI, and skin AF as well as AUC of HbA1c over the past 15 years were used as independent variables. The results indicated that only AUC of HbA1c over the past 15 years (β = 0.539; P < 10−4) was significantly associated with the severity of retinopathy.
These results clearly indicate that past glycemic control for a long period exerts a strong effect on the occurrence of nephropathy and retinopathy. However, AUC of HbA1c is not usually available in the routine clinical practice. We therefore tested whether skin AF can serve as a surrogate marker instead of AUC of HbA1c for the microvascular complications. We removed AUC of HbA1c over the past 15 years from independent variables in these analyses. Thus, we performed a multivariate stepwise linear regression analysis using the albuminuria-based stage of nephropathy as a dependent variable, and age at registration, age at onset of diabetes, duration of diabetes, sex, BMI, and skin AF were used as independent variables. The results indicated that only skin AF was significantly associated with the albumin-based stage of nephropathy (β = 0.287; P < 10−5). Next, we performed a multivariate stepwise linear regression analysis using the severity of retinopathy as a dependent variable, and age at registration, age at onset of diabetes, duration of diabetes, sex, BMI, and skin AF were used as independent variables. The results indicated that age (β = 0.364; P < 10−5), age at onset of diabetes (β = −0.387; P < 10−6), and skin AF (β = 0.241; P < 0.001) were significantly associated with the severity of retinopathy.
CONCLUSIONS
To the best of our knowledge, the current study was the first to demonstrate that skin AF, as measured via a noninvasive AF reader, was significantly correlated with past long-term glycemic control in patients with type 1 diabetes. It was found that present skin AF was significantly and positively correlated with HbA1c AUC over the past 15 years. However, there was a weaker correlation between skin AF and HbA1c AUC over the past 20 years than that over the past 15 years. One reason for this discrepancy may be that there were a smaller number of diabetic patients who had a history of HbA1c up to 20 years. We could not obtain HbA1c levels during the past 20 years completely, even in the patients with >20 years of diabetes duration when they were transferred from other hospitals to our hospital. The second reason may be that onset age of diabetes has been identified as an important factor for retinopathy onset. Olsen et al. (15) reported prepubertal disease duration contributed to the subsequent development of retinopathy. Mean (±SD) onset age of our subjects who had records of HbA1c for up to 20 years (n = 28) was 15.8 ± 10.4 years, which is during puberty.
The AGEs that can be measured with an AF reader are CLF, CML, CEL, and pentosidine (6). In the Diabetes Control and Complications Trial (DCCT) substudy, Monnier et al. analyzed the effects of long-term glycemic control as determined from measurements of skin AGEs via biopsy on early stage and advanced glycation products. They reported that skin AGEs were reflected by the deposited furosine levels over the course of >1 year, and CML, pentosidine, and pepsin-soluble collagen were reflected by the deposited furosine levels over the past several years (6). Skin AF is an established method of measuring AGEs; however, it is only a noninvasive surrogate marker. In the current study, we did not measure specific skin AGEs, but we believe that the skin AF values reflect the levels of CML, pentosidine, and pepsin-soluble collagen deposited. Thus, skin AF values may be used as an index marker of long-term glycemic control compared with HbA1c. Furthermore, skin AGEs were measured via biopsy in the DCCT subanalysis, and it was found that furosine levels decreased by 30–32%, pentosidine decreased by 9%, and CML decreased by 9–13% in the intensive treatment group compared with the conventional treatment group (16). These findings suggest that a reduction in AGEs is one of the indexes of restrain in diabetes complications (3,16,17). After a mean follow-up duration of 3.3 years, Gerrits et al. (18) reported that integrated HbA1c poorly predicts changes in skin AGEs as measured with skin AF in patients with type 2 diabetes.
Although the current study was retrospective over the past 20 years with younger patients with type 1 diabetes, skin AF values were significantly correlated with HbA1c AUC over the past 15 years. Because we recruited relatively younger patients with type 1 diabetes, it was likely an advantage because it allowed us to examine the correlation between skin AF and integrated HbA1c, excluding the effects of aging and arteriosclerotic factors.
Furthermore, we investigated the effect of the long-term glycemic control on the important microvascular complications of diabetes. In a multivariate linear regression analysis using the albuminuria-based stage of nephropathy as a dependent variable, we showed that HbA1c AUC for the past 15 years and sex were significantly associated with the stage. Although we could not detect the association between the stage of CKD according to National Kidney Foundation practice guidelines (14) and HbA1c AUC, this may reflect the fact that significant reduction of eGFR is the end-stage observation of diabetes-associated nephropathy. Albuminuria is an earlier observation and may be associated more tightly with the past glycemic control, at least in our dataset in which the number of the patients with advanced nephropathy was rather small. Concerning retinopathy, only HbA1c AUC over the past 15 years was significantly associated with the severity of retinopathy. These results clearly indicated that the poor long-term glycemic control is the dominant factor for the development of nephropathy and retinopathy, although male diabetic patients may be more likely to develop nephropathy than females. Because HbA1c AUC values may not be easily available in routine clinical practice, we examined whether skin AF can be a surrogate marker for diabetes complications.
In the multivariate regression analysis from which HbA1c AUC was removed, we showed that only skin AF was the significant variable associated with the albuminuria-based stage of nephropathy. Then, we performed the similar analysis for retinopathy. The results indicated that age at registration, onset age, and skin AF were the significant variables associated with the severity of retinopathy. Thus, retinopathy is independently associated with skin AF and develops more frequently in older patients and in those with younger age at onset. These results suggest that skin AF may serve as a surrogate marker for microvascular complications in type 1 diabetic patients when integrated HbA1c values for long periods are not available.
One limitation of the current study was the smaller number of subjects with macroalbuminuria or overt nephropathy and those requiring hemodialysis. The association between skin AF or past glycemic control and the severity of nephropathy (especially for stage of CKD) may have been clearer if there were a larger number of patients with renal complications. It is difficult to collect successive data in the same patients with type 1 diabetes at one medical facility for >20 years. Despite this, the collected data from one medical facility should be more stable because the same treatment policy and techniques are used to measure HbA1c. Therefore, these results would be more reliable over the long-term.
Furthermore, the data about macrovascular complications were not included. However, the prevalence of macrovascular complications, coronary heart disease, cerebral vascular disease, and arteriosclerosis in Japanese patients with type 1 diabetes are lower than those of Caucasian patients (19,20). A previous study reported that skin AF was strongly associated with cardiac mortality independent of diabetes (21). Additionally, it also was reported that skin AF levels are a predictor of the onset of macrovascular complications in type 2 diabetes, as determined by the United Kingdom Prospective Diabetes Study (UKPDS) risk engine (22). In Japanese patients with type 2 diabetes, one cross-sectional study recently reported that the odds ratio of skin AF levels for macrovascular complications was 7.25 (95% CI, 2.22–23.7), and that skin AF levels are an important risk factor for macrovascular diseases (23).
To date, there are no other reports that examine changes in AGEs accumulation over time, because most previous studies used invasive skin biopsies. Thus, cohort studies that assess changes in glycemic control over time and skin AF values are warranted. In other words, determining whether complications can be prevented may be possible by further assessing how glycemic control over time affects skin AF values or determining whether long-term improvements in glycemic control are protective against diabetic vascular complications. ACE inhibitors, angiotensin I receptor blockers, and endogenous receptors for AGEs are also important because they protect against the development of diabetic microvascular complications. ACE inhibitors and angiotensin I receptor blockers previously were shown to reduce the accumulation of AGEs (24,25). With this noninvasive method, it may be possible to investigate the changes in the accumulation of AGEs induced via ACE inhibitors or angiotensin I receptor blockers and their efficacy in reducing AGEs.
Finally, in the current study, it was found that skin AF, which was measured via an AF reader, significantly correlated with previous long-term HbA1c AUC. A prospective study that examines the associations between the onset and progression of diabetes complications and skin AF levels in Japanese patients with type 1 diabetes is necessary.
Acknowledgments
No potential conflicts of interest relevant to this article was reported.
E.S. and J.M. analyzed research data and wrote the manuscript. Y.I. gave the appropriate suggestions and edited the manuscript. Y.U. reviewed and edited the manuscript. J.M. is the guarantor of this work and, as such, had full access to all the data in the study and takes responsibility for the integrity of the data and the accuracy of the data analysis.
The authors thank Dr. Hiroko Kobayashi and Dr. Mari Osawa (both of the Diabetes Center, Tokyo Women’s Medical University School of Medicine) for their help in patient recruitment. The authors thank Dr. Naoyuki Kamatani (Director, Institute of Data Analysis, StaGen Co. Ltd.) for statistical work and for editing the manuscript.
Footnotes
This article contains Supplementary Data online at http://care.diabetesjournals.org/lookup/suppl/doi:10.2337/dc12-1077/-/DC1.
References
- 1.Brownlee M. Advanced protein glycosylation in diabetes and aging. Annu Rev Med 1995;46:223–234 [DOI] [PubMed] [Google Scholar]
- 2.Schleicher ED, Wagner E, Nerlich AG. Increased accumulation of the glycoxidation product N(ε)-(carboxymethyl)lysine in human tissues in diabetes and aging. J Clin Invest 1997;99:457–468 [DOI] [PMC free article] [PubMed] [Google Scholar]
- 3.Meerwaldt R, Graaff R, Oomen PH, et al. Simple non-invasive assessment of advanced glycation endproduct accumulation. Diabetologia 2004;47:1324–1330 [DOI] [PubMed] [Google Scholar]
- 4.Monnier VM, Vishwanath V, Frank KE, Elmets CA, Dauchot P, Kohn RR. Relation between complications of type I diabetes mellitus and collagen-linked fluorescence. N Engl J Med 1986;314:403–408 [DOI] [PubMed] [Google Scholar]
- 5.Craig ME, Duffin AC, Gallego PH, et al. Plantar fascia thickness, a measure of tissue glycation, predicts the development of complications in adolescents with type 1 diabetes. Diabetes Care 2008;31:1201–1206 [DOI] [PubMed] [Google Scholar]
- 6.Ahmed MU, Brinkmann Frye E, Degenhardt TP, Thorpe SR, Baynes JWN. N-ε-(carboxyethyl)lysine, a product of the chemical modification of proteins by methylglyoxal, increases with age in human lens proteins. Biochem J 1997;324:565–570 [DOI] [PMC free article] [PubMed] [Google Scholar]
- 7.Ueno H, Koyama H, Tanaka S, et al. Skin autofluorescence, a marker for advanced glycation end product accumulation, is associated with arterial stiffness in patients with end-stage renal disease. Metabolism 2008;57:1452–1457 [DOI] [PubMed] [Google Scholar]
- 8.Matsumoto T, Tsurumoto T, Baba H, et al. Measurement of advanced glycation endproducts in skin of patients with rheumatoid arthritis, osteoarthritis, and dialysis-related spondyloarthropathy using non-invasive methods. Rheumatol Int 2007;28:157–160 [DOI] [PubMed] [Google Scholar]
- 9.Ohnuki Y, Nagano R, Takizawa S, Takagi S, Miyata T. Advanced glycation end products in patients with cerebral infarction. Intern Med 2009;48:587–591 [DOI] [PubMed] [Google Scholar]
- 10.Kuzuya T, Nakagawa S, Satoh J, et al. Committee of the Japan Diabetes Society on the diagnostic criteria of diabetes mellitus Report of the Committee on the classification and diagnostic criteria of diabetes mellitus. Diabetes Res Clin Pract 2002;55:65–85 [DOI] [PubMed] [Google Scholar]
- 11.Matsuo S, Imai E, Horio M, et al. Collaborators developing the Japanese equation for estimated GFR Revised equations for estimated GFR from serum creatinine in Japan. Am J Kidney Dis 2009;53:982–992 [DOI] [PubMed] [Google Scholar]
- 12.Seino Y, Nanjo K, Tajima N, et al. Report of the Committee on the Classification and Diagnostic Criteria of Diabetes Mellitus. J Jpn Diabetes Soc 2010;53:450–467 [DOI] [PMC free article] [PubMed] [Google Scholar]
- 13.Diabetic Retinopathy Study Research Group. Report Number 7. A modification of the Airlie House Classification of diabetic retinopathy. Prepared by the Diabetic Retinopathy Study Group. Invest Ophthalmol Vis Sci 1981;21:210–226 [PubMed] [Google Scholar]
- 14.Levey AS, Coresh J, Balk E, et al. National Kidney Foundation National Kidney Foundation practice guidelines for chronic kidney disease: evaluation, classification, and stratification. Ann Intern Med 2003;139:137–147 [DOI] [PubMed] [Google Scholar]
- 15.Olsen BS, Sjølie AK, Hougaard P, et al. Danish Study Group of Diabetes in Childhood The significance of the prepubertal diabetes duration for the development of retinopathy and nephropathy in patients with type 1 diabetes. J Diabetes Complications 2004;18:160–164 [DOI] [PubMed] [Google Scholar]
- 16.Monnier VM, Bautista O, Kenny D, et al. DCCT Skin Collagen Ancillary Study Group Skin collagen glycation, glycoxidation, and crosslinking are lower in subjects with long-term intensive versus conventional therapy of type 1 diabetes: relevance of glycated collagen products versus HbA1c as markers of diabetic complications. DCCT Skin Collagen Ancillary Study Group. Diabetes Control and Complications Trial. Diabetes 1999;48:870–880 [DOI] [PMC free article] [PubMed] [Google Scholar]
- 17.Genuth S, Sun W, Cleary P, et al. DCCT Skin Collagen Ancillary Study Group Glycation and carboxymethyllysine levels in skin collagen predict the risk of future 10-year progression of diabetic retinopathy and nephropathy in the diabetes control and complications trial and epidemiology of diabetes interventions and complications participants with type 1 diabetes. Diabetes 2005;54:3103–3111 [DOI] [PMC free article] [PubMed] [Google Scholar]
- 18.Gerrits EG, Lutgers HL, Kleefstra N, et al. Skin advanced glycation end product accumulation is poorly reflected by glycemic control in type 2 diabetic patients (ZODIAC-9). J Diabetes Sci Tech 2008;2:572–577 [DOI] [PMC free article] [PubMed] [Google Scholar]
- 19.Kuzuya T, Akanuma Y, Akazawa Y, Uehata T. Prevalence of chronic complications in Japanese diabetic patients. Diabetes Res Clin Pract 1994;24(Suppl):S159–S164 [DOI] [PubMed] [Google Scholar]
- 20.Tajima N, Matsushima M. Complications and prognosis of children with IDDM. Diabetes Res Clin Pract 1994;24(Suppl):S165–S170 [DOI] [PubMed] [Google Scholar]
- 21.Meerwaldt R, Lutgers HL, Links TP, et al. Skin autofluorescence is a strong predictor of cardiac mortality in diabetes. Diabetes Care 2007;30:107–112 [DOI] [PubMed] [Google Scholar]
- 22.Lutgers HL, Gerrits EG, Graaff R, et al. Skin autofluorescence provides additional information to the UK Prospective Diabetes Study (UKPDS) risk score for the estimation of cardiovascular prognosis in type 2 diabetes mellitus. Diabetologia 2009;52:789–797 [DOI] [PubMed] [Google Scholar]
- 23.Tanaka K, Tani Y, Asai J, et al. Skin autofluorescence is associated with severity of vascular complications in Japanese patients with Type 2 diabetes. Diabet Med 2012;29:492–500 [DOI] [PubMed] [Google Scholar]
- 24.Forbes JM, Cooper ME, Thallas V, et al. Reduction of the accumulation of advanced glycation end products by ACE inhibition in experimental diabetic nephropathy [corrected in Diabetes 2010;59:1113]. Diabetes 2002;51:3274–3282 [DOI] [PubMed] [Google Scholar]
- 25.Miyata T, van Ypersele de Strihou C, Ueda Y, et al. Angiotensin II receptor antagonists and angiotensin-converting enzyme inhibitors lower in vitro the formation of advanced glycation end products: biochemical mechanisms. J Am Soc Nephrol 2002;13:2478–2487 [DOI] [PubMed] [Google Scholar]