

Abstract
OBJECTIVE
Canagliflozin, a sodium glucose cotransporter (SGLT) 2 inhibitor, is also a low-potency SGLT1 inhibitor. This study tested the hypothesis that intestinal canagliflozin levels postdose are sufficiently high to transiently inhibit intestinal SGLT1, thereby delaying intestinal glucose absorption.
RESEARCH DESIGN AND METHODS
This two-period, crossover study evaluated effects of canagliflozin on intestinal glucose absorption in 20 healthy subjects using a dual-tracer method. Placebo or canagliflozin 300 mg was given 20 min before a 600-kcal mixed-meal tolerance test. Plasma glucose, 3H-glucose, 14C-glucose, and insulin were measured frequently for 6 h to calculate rates of appearance of oral glucose (RaO) in plasma, endogenous glucose production, and glucose disposal.
RESULTS
Compared with placebo, canagliflozin treatment reduced postprandial plasma glucose and insulin excursions (incremental 0- to 2-h area under the curve [AUC0–2h] reductions of 35% and 43%, respectively; P < 0.001 for both), increased 0- to 6-h urinary glucose excretion (UGE0–6h, 18.2 ± 5.6 vs. <0.2 g; P < 0.001), and delayed RaO. Canagliflozin reduced AUC RaO by 31% over 0 to 1 h (geometric means, 264 vs. 381 mg/kg; P < 0.001) and by 20% over 0 to 2 h (576 vs. 723 mg/kg; P = 0.002). Over 2 to 6 h, canagliflozin increased RaO such that total AUC RaO over 0 to 6 h was <6% lower versus placebo (960 vs. 1,018 mg/kg; P = 0.003). A modest (∼10%) reduction in acetaminophen absorption was observed over the first 2 h, but this difference was not sufficient to explain the reduction in RaO. Total glucose disposal over 0 to 6 h was similar across groups.
CONCLUSIONS
Canagliflozin reduces postprandial plasma glucose and insulin by increasing UGE (via renal SGLT2 inhibition) and delaying RaO, likely due to intestinal SGLT1 inhibition.
The sodium glucose cotransporter (SGLT) 2 is the major transporter responsible for reabsorption of glucose filtered through the renal glomerulus (1). SGLT2 is a high-capacity, low-affinity transporter expressed primarily at the luminal membrane of the early segments of the proximal renal tubules (1). SGLT1 is a low-capacity, high-affinity transporter expressed in the distal segment of the proximal tubule (1), in the intestinal mucosa of the small intestine (2), and in other tissues to a lesser extent (3). Although SGLT1 plays a smaller role in renal glucose absorption than SGLT2, SGLT1 is the primary pathway involved in intestinal glucose and galactose absorption (2,4,5).
Pharmacologic inhibition of SGLT2 is a novel approach to lowering plasma glucose in hyperglycemic individuals by blocking renal glucose reabsorption, lowering the renal threshold for glucose (RTG), and thereby markedly increasing urinary glucose excretion (UGE). Canagliflozin, an SGLT2 inhibitor in development for the treatment of patients with type 2 diabetes (6–10), is also a low-potency SGLT1 inhibitor. In vitro, canagliflozin inhibited sodium-dependent 14C-α-methylglucoside uptake in cells expressing human SGLT2 or SGLT1 with half-maximal inhibitory concentrations (IC50) of 4.4 ± 1.2 and 684 ± 159 nmol/L, respectively (8). Because the maximum plasma concentrations of unbound canagliflozin in subjects treated with canagliflozin 300 mg once daily are ∼100 nmol/L (maximum plasma concentrations are ∼10 μmol/L [11] and protein binding is ∼99% [unpublished data]), only minimal systemic inhibition of SGLT1 is expected in subjects treated with canagliflozin 300 mg.
In clinical studies in healthy subjects and subjects with type 2 diabetes, treatment with canagliflozin provided dose-dependent increases in UGE compared with placebo (7,9). In healthy subjects treated with escalating doses of canagliflozin given 10 min before a mixed meal, doses of canagliflozin higher than 200 mg reduced postprandial plasma glucose and insulin concentrations to a greater extent than lower doses of canagliflozin, even when compared with doses that provided similar UGE during the postprandial period (7). These pronounced reductions in postprandial glucose and insulin excursions observed with canagliflozin doses higher than 200 mg were only observed for the first meal after dosing; similar reductions beyond that expected on the basis of increased UGE were not observed after later meals (lunch and dinner) given on the same day (7). On the basis of these observations, it was hypothesized that after dosing and during drug absorption, canagliflozin concentrations within the lumen of the intestinal tract could be sufficiently high to provide transient inhibition of intestinal SGLT1-mediated glucose absorption, thereby lowering postprandial plasma glucose and insulin concentrations.
The current study investigated the effects of a single 300-mg oral dose of canagliflozin on intestinal glucose absorption and metabolism in healthy subjects (ClinicalTrials.gov Identifier: NCT01173549). This study used a dual-tracer method to test the hypothesis that canagliflozin 300 mg slows the rate of systemic appearance of orally administered glucose (RaO) during a mixed-meal tolerance test (MMTT) compared with placebo.
RESEARCH DESIGN AND METHODS
Study population
This study was conducted from 22 November 2010 to 29 September 2011 at a single center in San Diego, California. The study protocol and all amendments were reviewed and approved by the University of California, San Diego Institutional Review Board. This study was conducted in accordance with the ethical principles that have their origin in the Declaration of Helsinki and that are consistent with good clinical practices and applicable regulatory requirements. All subjects provided written informed consent to participate in the study after having been informed about the nature and purpose of the study, participation/termination conditions, and the possible risks and benefits of treatment.
This study enrolled healthy men aged 18–45 years with a BMI of ≥20 and ≤27 kg/m2, stable body weight of ≥50 kg (<5% change during the 3 months before screening), and fasting plasma glucose (FPG) of <6.1 mmol/L. Further eligibility criteria are described at ClinicalTrials.gov (NCT01173549).
Safety analyses
Vital sign measurements, 12-lead electrocardiograms, physical examinations, and clinical laboratory tests were performed at predefined time points throughout the study. Adverse events (AEs) were monitored from the signing of informed consent until completion of the last study-related procedure.
Study design
This was a randomized, double-blind, placebo-controlled, two-period crossover study consisting of a screening phase, a 25-day double-blind treatment phase (including two 1-day treatment periods and a washout period of 7–21 days between periods 1 and 2), and a follow-up phase of up to 10 days after period 2. Subjects were randomized to one of two treatment sequences: canagliflozin 300 mg in period 1, followed by matching placebo in period 2, or vice versa. On days –3 and –2 of each period, subjects were counseled to adhere to a specified diet (∼55% carbohydrate, 30% fat, 15% protein, and total caloric intake of ∼30 kcal/kg body weight). On the morning of day –1 of each study period, subjects were admitted to the clinical research unit in a fasting state for safety analyses, followed by standardized meals.
On the morning of day 1 of each study period, after an overnight fast of at least 8 h, subjects received a primed (25 μCi), continuous intravenous infusion of 3H-glucose (0.25 μCi/min) for approximately 9 h. Three hours after starting the intravenous infusion and 20 min after administration of study drug, subjects received a standard 600-kcal MMTT (55% carbohydrate, 30% fat, 15% protein). The liquid component of the MMTT consisted of an oral solution of 75 g glucose, which was mixed with 75 μCi 14C-glucose, and an acetaminophen solution (960 mg in 30 mL); acetaminophen absorption was used as an indirect measure of gastric emptying (12,13). Subjects returned for a final follow-up visit for safety analyses 7 to 10 days after discharge on day 1 of period 2.
Clinical evaluations
On day 1, subjects emptied their bladder before and after the 3-h 3H-glucose isotope equilibration period (from t = –3 h to t = 0 [the start of the meal]), and urine was collected over the intervals of 0 to 2 h and 2 to 6 h for determination of urinary glucose and creatinine concentrations. Blood samples were collected at t = –20, –10, 0, 15, 30, 40, 50, 60, 75, 90, 105, 120, 150, 180, 210, 240, 270, 300, and 360 min for measurements of plasma glucose (labeled and unlabeled) and insulin. Additional blood samples were drawn at predefined time points for determination of canagliflozin and acetaminophen concentrations and for analysis of other pharmacodynamic markers, including concentrations of glucose-dependent insulinotropic peptide (GIP), glucagon-like peptide-1 (GLP-1), and peptide YY (PYY).
Bioanalytical analyses
Plasma and urine glucose concentrations were measured using a hexokinase enzymatic assay, and plasma insulin concentration was determined using an electrochemiluminescent sandwich immunoassay (Roche Diagnostics, Indianapolis, IN). 3H-glucose and 14C-glucose specific activities were determined using the assays described by Mudaliar et al. (14) and Kreisberg et al. (15), respectively. Recycling of 14C-glucose over the course of the procedure was negligible, with recycled 14C generally below the limit of detection, similar to the observations of others (16,17). Active and total plasma GLP-1 levels were measured using an electrochemiluminescent sandwich immunoassay (Meso Scale Discovery, Gaithersburg, MD). Total plasma GIP was measured using an enzyme-linked immunosorbent assay, and total plasma PYY was measured using a radioimmunoassay (Millipore, Billerica, MA). Plasma acetaminophen concentration was determined using a validated high-performance liquid chromatography (HPLC) method with ultraviolet detection at PRA International, Assen, the Netherlands (calibration range = 0.500–50 μg/mL).
Glucose flux analysis
RaO, the rate of endogenous glucose production (EGP), and the rate of total glucose disposal (Rd) were determined from the measured plasma glucose, 3H-glucose, and 14C-glucose profiles using a circulatory model of glucose kinetics (18–20). The infused 3H-glucose profile was used to determine glucose clearance over time, and the 14C-glucose and plasma glucose profiles were used to determine the relative amounts of ingested and endogenous glucose in the circulation. The resulting rates of appearance of endogenous and oral glucose were determined by fitting the model of glucose kinetics to the oral and endogenous glucose profiles. All calculations were performed using the GLUTRAN toolbox (licensed from Mari and colleagues at the Institute of Biomedical Engineering, National Research Council, Padova, Italy) in Matlab 7.10 software (18).
To separate total Rd into tissue glucose disposal (tissue Rd) and UGE, the rate of UGE at each time point was estimated from the UGE collections over the 0- to 2-h and 2- to 6-h intervals. This was done by calculating RTG over these intervals, as previously described (7,9), and then estimating UGE at each interval using the following equation:
 |
where the glomerular filtration rate (GFR) was estimated using the Modification of Diet in Renal Disease equation and PG is plasma glucose. Tissue Rd was then calculated as total Rd − UGE.
Pharmacodynamic parameters
The total amount of glucose appearance and disappearance over the intervals from 0 to 1 h, 0 to 2 h, 2 to 6 h, and 0 to 6 h was determined by calculating the area under the curve (AUC) of the associated rates of glucose appearance and disappearance time profiles over each time interval. Incremental AUCs (denoted as ΔAUC) for plasma glucose, insulin, and gut peptides were defined as the positive area above the premeal value.
Statistical analysis
For the primary pharmacodynamic parameters of RaO AUC0–1h and RaO AUC0–2h, data were log-transformed for analysis. Mixed-effects models were fitted with the logarithm of the parameter of interest as the dependent variable; sequence, period, and treatment as fixed effects; and subject as a random effect. The null hypothesis that the mean RaO AUCs (on the log-scale) are equal for canagliflozin 300 mg and placebo was tested using a one-sided (left-sided) α level of 5%. Using the estimated least squares (LS) means and intrasubject SD from the mixed-effects model, 90% CIs were constructed for the difference in means on the log scale between canagliflozin 300 mg and placebo. The CI limits for the difference in mean AUCs were exponentiated to yield the 90% CI for the ratio of geometric mean RaO AUCs of canagliflozin to placebo.
All secondary pharmacodynamic variables were summarized with descriptive statistics for each treatment. Mean (95% CIs) differences between canagliflozin 300 mg and placebo were determined for all pharmacodynamic variables. Total Rd was analyzed using a mixed-effects linear model based on log-transformed data. The model included the logarithm of total Rd as the dependent variable; sequence group, period, and treatment as fixed effects; and subject as a random effect.
Acetaminophen pharmacokinetic parameters (Cmax and AUCs) were compared between canagliflozin and placebo groups by constructing a 90% CI for the ratio of geometric means using mixed-effects modeling of the data with the logarithm of the pharmacokinetic parameters as the dependent variable; sequence, period, and treatment as fixed effects; and subject as a random effect. The relationship between RaO AUC and AUC acetaminophen was assessed by linear regression analysis. Comparison of the regression lines for canagliflozin versus placebo was performed using an ANCOVA model in Prism 5.01 software (GraphPad Software, Inc., La Jolla, CA).
For all subjects, based on individual plasma concentration-time profiles, the total and incremental AUCs for glucose, insulin, PYY, GIP, and GLP-1 from 0 to 1 h, 0 to 2 h, and 0 to 6 h (glucose and insulin only) were calculated using the trapezoid rule using WinNonlin 5.2.1 software (Pharsight Corporation, Mountain View, CA). Unless otherwise specified, all results shown are mean ± SD.
RESULTS
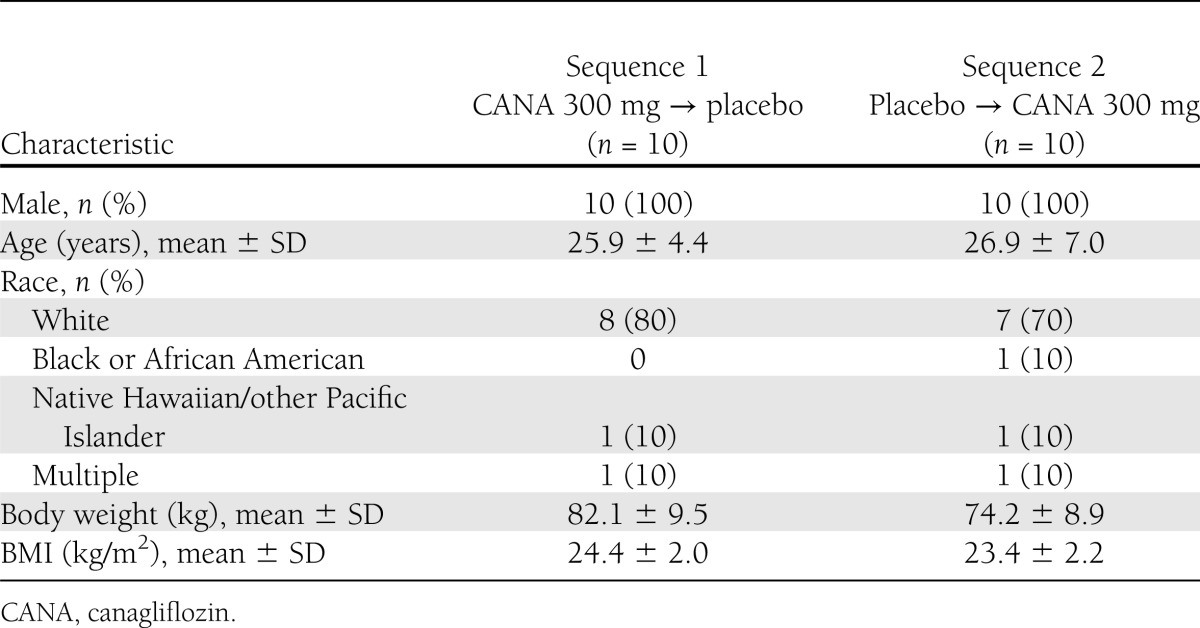
This study enrolled 20 subjects, and 19 completed both treatment periods (1 subject was withdrawn for noncompliance with study prohibitions). Subject baseline and demographic characteristics are summarized in Table 1.
Table 1.
Subject baseline and demographic characteristics
Postprandial plasma glucose and insulin responses
After ingestion of the standardized meal, the postprandial plasma glucose and insulin excursions were reduced with canagliflozin 300 mg compared with placebo (Fig. 1A and B). Mean postprandial plasma glucose ΔAUC values were ∼44%, 35%, and 26% lower during the 0- to 1-h, 0- to 2-h, and 0- to 6-h postmeal intervals, respectively, after administration of canagliflozin 300 mg (arithmetic mean ± SD ΔAUC of 1.88 ± 0.77, 3.67 ± 1.41, and 4.80 ± 1.90 [mmol/L] ⋅ h, respectively) compared with placebo (3.34 ± 1.43, 5.61 ± 2.62, and 6.44 ± 2.57 [mmol/L] ⋅ h, respectively). Similarly, postprandial plasma insulin ΔAUC values were ∼43%, 43%, and 33% lower during the 0- to 1-h, 0- to 2-h, and 0- to 6-h postmeal intervals, respectively, for canagliflozin (arithmetic mean ± SD ΔAUC of 271 ± 232, 514 ± 273, and 738 ± 335 [pmol/L] ⋅ h, respectively) compared with placebo (474 ± 263, 906 ± 521, and 1,104 ± 624 [pmol/L] ⋅ h, respectively).
Figure 1.

Mean ± SEM concentration-time profiles from predose to 6 h after the standard meal for plasma glucose (A), insulin (B), oral 14C-glucose tracer (C), and infused 3H-glucose tracer (D); rate of oral glucose appearance (E); and glucose absorption as a function of time after the standard meal (F). CANA, canagliflozin.
The oral 14C-glucose tracer concentration was reduced with canagliflozin compared with placebo over the first 2 h after the MMTT (Fig. 1C). The infused 3H-glucose tracer concentration was similar between treatments for the first 3 h after the MMTT; between 3 and 6 h after the MMTT, the plasma concentration of 3H-glucose was lower with canagliflozin treatment than with placebo (Fig. 1D).
RaO in plasma
Canagliflozin treatment blunted and delayed the postprandial increase in RaO compared with placebo (Fig. 1E). Treatment with canagliflozin reduced the amount of oral glucose absorption (AUC RaO) compared with placebo by 31% over the 0- to 1-h interval (ratio of LS geometric means [90% CI] of 0.69 [0.60–0.80]; P < 0.001) and by 20% over the 0- to 2-h interval (0.80 [0.71–0.89]; P < 0.01; Fig. 1F). However, this decrease in AUC RaO over the first 2 h with canagliflozin was nearly matched by a 34% increase in AUC RaO in the 2- to 6-h interval for canagliflozin compared with placebo (1.34 [1.19–1.51]), such that the AUC RaO over 0 to 6 h was only ∼6% lower for canagliflozin compared with placebo (0.94 [0.91–0.98]; P = 0.003; Fig. 1F). Administration of canagliflozin also reduced the maximum RaO by approximately 24% compared with placebo (LS geometric means of 7.16 and 9.38 mg/kg/min, respectively).
UGE and RTG
Canagliflozin treatment increased UGE (Fig. 2A). Mean UGE after treatment with canagliflozin was 5.9 and 12.2 g during the 0- to 2-h and 2- to 6-h intervals, respectively, compared with less than 0.15 g in each interval with placebo. In canagliflozin-treated subjects, mean RTG was 4.1 ± 1.8 mmol/L over the 0- to 2-h interval and 2.4 ± 0.8 mmol/L over the 2- to 6-h interval. RTG values could not be determined in placebo-treated subjects because most had only minimal (<200 mg) UGE, which is consistent with expectations based on the plasma glucose profiles shown in Fig. 1 and with the commonly reported RTG values of ∼10.0 to 11.1 mmol/L in untreated, healthy subjects (21,22).
Figure 2.

Effects of canagliflozin (CANA) treatment on UGE rate (A), EGP rate (B), total Rd (C), and tissue Rd (D) over 6 h after the standard meal and on total glucose turnover from 0 to 2 h (E) and 0 to 6 h (F) postmeal. The calculated mean total amount of oral glucose absorption over 0 to 6 h was 79 g with placebo and 75 g with canagliflozin. The mean value in the placebo group is slightly higher than the 75-g oral glucose load that was ingested, giving a calculated bioavailability of glucose that was slightly >100%. This slight overestimation may be due partly to recycling of the 14C glucose tracer through the Cori cycle that could not be accounted for due to limitations of assay sensitivity not allowing accurate detection of the recycled tracer amounts (see research design and methods). Values shown are mean ± SEM in A–D and mean in E and F.
Rates of EGP and Rd
Before the MMTT, the rate of EGP was ∼2 mg/kg/min in both treatment groups, consistent with values reported in other studies in healthy subjects (23,24). EGP was rapidly suppressed after the MMTT, with similar suppression of EGP observed with canagliflozin or placebo treatments (Fig. 2B). From 3 to 6 h postmeal (when plasma glucose concentrations were generally back to premeal values), the rate of EGP was modestly higher with canagliflozin than with placebo (Fig. 2B), and the calculated total amount of EGP over 2 to 6 h was ∼20% higher with canagliflozin than placebo (geometric mean ratio = 1.20, P = 0.005).
Although canagliflozin treatment dramatically increased UGE compared with placebo (Fig. 2A), total and tissue Rd were both lower with canagliflozin treatment than with placebo for ∼2 h after the MMTT (Fig. 2C and D), with AUC0–1h and AUC0–2h for total Rd reduced by ∼18% and 19% with canagliflozin compared with placebo (P = 0.026 and P = 0.009, respectively). Thus, despite the increase in UGE with canagliflozin treatment, the reduction in postprandial plasma glucose and insulin over the first 2 h is not explained by increased glucose disposal because Rd over that time interval is lower with canagliflozin than with placebo. Total Rd increased by ∼25% over the 2- to 6-h interval with canagliflozin compared with placebo (P < 0.001) so that the total amount of glucose disposal over the 6-h period (total Rd AUC0–6h) was essentially identical with canagliflozin and placebo (P = 0.78).
Total glucose turnover
The total amounts of glucose appearance and disappearance over the 0- to 2-h and 2- to 6-h intervals are shown in Fig. 2. Over the 0- to 2-h interval, treatment with canagliflozin reduced mean RaO AUC (i.e., the amount of oral glucose absorbed) by 11 g, which was almost twice as large as the increase in UGE during this interval (6 g; Fig. 2E). This suggests that most of the observed reductions in plasma glucose and insulin excursions with canagliflozin treatment are due to decreased intestinal glucose absorption over the first 2 h after the meal. However, the total amounts of glucose appearance and disappearance over the 0- to 6-h interval were essentially identical between treatments (Fig. 2F).
Gastric emptying and postprandial plasma GIP, PYY, and GLP-1 responses
Mean plasma acetaminophen concentrations were ∼10% lower over the first 2 h after the meal with canagliflozin compared with placebo (LS geometric mean AUC0–2h of 9.21 and 10.29 μg ⋅ h/mL, respectively, giving a LS geometric mean ratio of 0.90 (90% CI 0.84–0.95; P = 0.004; Supplementary Fig. 1A). However, this reduction in the gastric emptying rate is insufficient to explain the decrease in RaO observed with canagliflozin compared with placebo, because the relationship between acetaminophen absorption and glucose absorption was altered by canagliflozin treatment (Supplementary Fig.1B). Over both the 0- to 1-h and 0- to 2-h intervals, the relationship between RaO and acetaminophen absorption was shifted downward with canagliflozin treatment, demonstrating that the reduction in RaO could not be explained solely by reductions in gastric emptying.
Changes in gut peptide concentration during the 0- to 2-h postprandial period were consistent with delayed intestinal glucose absorption (Fig. 3). Incremental postprandial GIP was reduced by ∼50% with canagliflozin compared with placebo (arithmetic mean ± SD ΔAUC0–2h of 30.1 ± 11.1 and 63.5 ± 20.2 pmol ⋅ h/L, respectively). The incremental postprandial PYY concentration was ∼60% higher from 0 to 2 h with canagliflozin than with placebo (21.9 ± 13.5 and 13.6 ± 10.8, respectively), and total GLP-1 was ∼35% higher with canagliflozin than with placebo (13.7 ± 6.88 and 10.1 ± 5.38, respectively).
Figure 3.

Mean ± SEM plasma concentration-time profiles of GIP (A), PYY (B), total GLP-1 (C), and active GLP-1 (D). CANA, canagliflozin.
Safety
Canagliflozin was well tolerated, with no discontinuations due to AEs. No subjects reported symptoms suggestive of glucose malabsorption or gastrointestinal adverse effects.
CONCLUSIONS
Results of this study show that in healthy subjects, a single 300-mg dose of canagliflozin administered before a meal reduced postprandial plasma glucose excursions by two mechanisms: increased UGE due to renal SGLT2 inhibition and delayed absorption of ingested glucose. The delay in oral glucose absorption is likely due to local and transient intestinal SGLT1 inhibition resulting from high intestinal canagliflozin concentrations within the intestinal lumen during the period of drug absorption.
Although canagliflozin reduced intestinal glucose absorption by ∼31% over the first hour and by ∼20% over the first 2 h after a meal, this initial reduction was almost entirely compensated for by an increase in glucose absorption from 2 to 6 h after the meal. As a result, there was only a small difference (<6%) in the total appearance of orally ingested glucose in plasma over the full 6-h period after the meal between canagliflozin and placebo treatments. These findings demonstrate that canagliflozin treatment is not associated with any meaningful glucose malabsorption, and consistent with this, no symptoms of malabsorption were reported in this study. No increase in glucose malabsorption (assessed using a hydrogen breath test) was observed in subjects with type 2 diabetes treated with canagliflozin 300 mg twice daily for 4 weeks (9). This is in contrast to serious malabsorption symptoms observed in individuals with inactivating genetic mutations in SGLT1 (3). This lack of glucose malabsorption in subjects treated with canagliflozin is likely due to the rapid absorption of canagliflozin, such that intestinal canagliflozin concentrations are only transiently sufficiently high to inhibit SGLT1.
The changes in gut peptide secretion observed with canagliflozin treatment are generally consistent with expectations based on intestinal SGLT1 inhibition leading to delayed glucose absorption. GIP-secreting K cells are primarily found in the proximal small intestine, and the observed reduction in plasma GIP concentrations with canagliflozin treatment is consistent with recent data showing that SGLT1-mediated glucose uptake is pivotal for GIP secretion (5). Similarly, the increase in plasma PYY and total GLP-1 observed after t = 30 min suggests increased glucose absorption in the more distal intestine where the GLP-1–secreting L cells are primarily found. However, it remains uncertain why similarly rapid increases in GLP-1 and PYY were observed in the first 30 min in both treatment groups. The early increments in GLP-1 and PYY (occurring before ingested nutrients have reached the more distal intestine) have been commonly reported in other studies (25), and the source of this early GLP-1 and PYY secretion remains uncertain, with possibilities including 1) a neural signal from the proximal small intestine that reaches L cells in the more distal intestine (26), 2) release from the small number of L cells in the proximal small intestine (27), and/or 3) release by a subset of enteroendocrine cells that cosecrete GIP and GLP-1 (28). Because SGLT1 is also reported to be essential for GLP-1 secretion (5) and no reduction in early GLP-1 secretion was observed with canagliflozin, it is not clear that the early increment in GLP-1 secretion can be explained by GLP-1 secretion from cells in the proximal small intestine. The observed reduction in serum insulin is likely due to decreased plasma glucose, because the relationship between plasma glucose and the insulin secretion rate was unchanged by canagliflozin treatment (data not shown).
Although a slight delay in gastric emptying (estimated by plasma acetaminophen concentrations) was observed with canagliflozin treatment compared with placebo, the reductions in RaO observed with canagliflozin are greater than can be accounted for by the modest delay in gastric emptying. The observed effects of canagliflozin on RaO are consistent with the hypothesis that canagliflozin 300 mg transiently inhibits intestinal SGLT1-mediated glucose absorption, with perhaps a small contribution of delayed gastric emptying, possibly related to the increased GLP-1 levels.
Endogenous glucose production was suppressed to a similar extent with both treatments after the meal, but EGP was higher with canagliflozin than with placebo over the 3- to 6-h period after the meal (Fig. 2). The elevated EGP is likely a compensatory response that enables normal plasma glucose concentrations to be maintained in the presence of sustained UGE, but the mechanism(s) leading to the increased EGP is not known.
Although this study demonstrated that a single 300-mg dose of canagliflozin delays intestinal glucose absorption in healthy subjects, there are some important limitations. Because only one dose strength of canagliflozin was tested, the dose-response relationship for the effect of canagliflozin on intestinal glucose absorption cannot be established from this study. Results from an earlier study suggested that doses >200 mg of canagliflozin were required to see pronounced reductions in postprandial glucose excursions (7), but it is not known whether greater delays in intestinal glucose absorption could be achieved with higher doses of canagliflozin or whether malabsorption would be observed with higher doses. In addition, because this mechanistic study only characterized the response to a single dose in healthy subjects, further studies will be required to characterize the effects of sustained canagliflozin treatment on intestinal glucose absorption in subjects with type 2 diabetes.
In conclusion, canagliflozin 300 mg reduces postprandial plasma glucose and insulin concentration in healthy subjects by two distinct mechanisms: 1) increasing UGE due to renal SGLT2 inhibition and 2) delaying RaO, which is likely due to transient intestinal SGLT1 inhibition.
Acknowledgments
This study was supported by Janssen Research & Development, LLC. Editorial support for the writing of this manuscript was provided by Cherie Koch, PhD, of MedErgy, and was funded by Janssen Global Services, LLC. Canagliflozin is being developed by Janssen Research & Development, LLC, in collaboration with Mitsubishi Tanabe Pharma Corporation.
R.R.H. has received grants or research support from the National Institutes of Health, National Institute of Diabetes and Digestive and Kidney Diseases, DVA, Amylin Pharmaceuticals, Inc., AstraZeneca Pharmaceuticals LP, Bristol-Myers Squibb Company, Johnson & Johnson, Lilly Pharmaceuticals, Novartis Pharmaceuticals Corporation, and Sanofi; served as a consultant for Amgen, Inc., Boehringer Ingelheim Pharmaceuticals, Inc., Isis Pharmaceuticals, Inc., Novo Nordisk Pharmaceuticals, Inc., Roche Pharmaceuticals, Sanofi, and Vivus; and served on advisory boards for Amgen, Inc., Amylin Pharmaceuticals, Inc., Boehringer Ingelheim Pharmaceuticals, Inc., Eli Lilly and Company, Gilead, Intarcia Therapeutics, Inc., Merck & Co., Novo Nordisk Pharmaceuticals, Inc., Roche Pharmaceuticals, Sanofi, and Versartis, Inc. D.P., S.S., A.G., N.V., K.F., and P.R. are full-time employees of Janssen Research & Development, LLC. S.M. has received research support from Bristol-Myers Squibb Company, AstraZeneca Pharmaceuticals LP, Daiichi-Sankyo, Inc., and Novo Nordisk Pharmaceuticals, Inc.; served as a consultant for Bristol-Myers Squibb Company, AstraZeneca Pharmaceuticals LP, and Daiichi-Sankyo, Inc.; and served as a speaker for Boehringer Ingelheim Pharmaceuticals, Inc. No other potential conflicts of interest relevant to this article were reported.
D.P., S.M., T.P.C., and R.R.H. contributed to the design and conduct of the study and to the acquisition, analysis, and interpretation of data and reviewed and approved the manuscript. A.G. contributed to the design of the study and to the analysis and interpretation of data and reviewed and approved the manuscript. S.S., N.V., K.F., and P.R. contributed to the design and conduct of the study and to the analysis and interpretation of data and reviewed and approved the manuscript. D.P. is the guarantor of this work and, as such, had full access to all the data in the study and takes responsibility for the integrity of the data and the accuracy of the data analysis.
Parts of this study were presented in abstract form at the 72nd Scientific Sessions of the American Diabetes Association, Philadelphia, PA, 8–12 June 2012, and at the 48th Annual Meeting of the European Association for the Study of Diabetes, Berlin, Germany, 1–5 October 2012.
Footnotes
Clinical trial reg. no. NCT01173549, clinicaltrials.gov.
This article contains Supplementary Data online at http://care.diabetesjournals.org/lookup/suppl/doi:10.2337/dc12-2391/-/DC1.
References
- 1.Lee YJ, Lee YJ, Han HJ. Regulatory mechanisms of Na(+)/glucose cotransporters in renal proximal tubule cells. Kidney Int Suppl 2007;Aug:S27–S35 [DOI] [PubMed] [Google Scholar]
- 2.Drozdowski LA, Thomson AB. Intestinal sugar transport. World J Gastroenterol 2006;12:1657–1670 [DOI] [PMC free article] [PubMed] [Google Scholar]
- 3.Wright EM, Loo DD, Hirayama BA. Biology of human sodium glucose transporters. Physiol Rev 2011;91:733–794 [DOI] [PubMed] [Google Scholar]
- 4.Abdul-Ghani MA, Norton L, Defronzo RA. Role of sodium-glucose cotransporter 2 (SGLT 2) inhibitors in the treatment of type 2 diabetes. Endocr Rev 2011;32:515–531 [DOI] [PubMed] [Google Scholar]
- 5.Gorboulev V, Schürmann A, Vallon V, et al. Na(+)-D-glucose cotransporter SGLT1 is pivotal for intestinal glucose absorption and glucose-dependent incretin secretion. Diabetes 2012;61:187–196 [DOI] [PMC free article] [PubMed] [Google Scholar]
- 6.Nomura S, Sakamaki S, Hongu M, et al. Discovery of canagliflozin, a novel C-glucoside with thiophene ring, as sodium-dependent glucose cotransporter 2 inhibitor for the treatment of type 2 diabetes mellitus. J Med Chem 2010;53:6355–6360 [DOI] [PubMed] [Google Scholar]
- 7.Sha S, Devineni D, Ghosh A, et al. Canagliflozin, a novel inhibitor of sodium glucose co-transporter 2, dose dependently reduces calculated renal threshold for glucose excretion and increases urinary glucose excretion in healthy subjects. Diabetes Obes Metab 2011;13:669–672 [DOI] [PubMed] [Google Scholar]
- 8.Liang Y, Arakawa K, Ueta K, et al. Effect of canagliflozin on renal threshold for glucose, glycemia, and body weight in normal and diabetic animal models. PLoS ONE 2012;7:e30555. [DOI] [PMC free article] [PubMed] [Google Scholar]
- 9.Devineni D, Morrow L, Hompesch M, et al. Canagliflozin improves glycaemic control over 28 days in subjects with type 2 diabetes not optimally controlled on insulin. Diabetes Obes Metab 2012;14:539–545 [DOI] [PubMed] [Google Scholar]
- 10.Rosenstock J, Aggarwal N, Polidori D, et al. Canagliflozin DIA 2001 Study Group Dose-ranging effects of canagliflozin, a sodium-glucose cotransporter 2 inhibitor, as add-on to metformin in subjects with type 2 diabetes. Diabetes Care 2012;35:1232–1238 [DOI] [PMC free article] [PubMed] [Google Scholar]
- 11.Devineni D, Curtin CR, Polidori D, Murphy J, Rusch S, Rothenberg PL. Canagliflozin (sodium glucose co-transporter 2 [SGLT2] inhibitor): pharmacokinetics (PK) and pharmacodynamics (PD) in subjects with type 2 diabetes mellitus (T2DM) (Abstract) Clin Pharmacol Ther 2012;91:S98. [DOI] [PubMed] [Google Scholar]
- 12.Nimmo WS, Heading RC, Wilson J, Tothill P, Prescott LF. Inhibition of gastric emptying and drug absorption by narcotic analgesics. Br J Clin Pharmacol 1975;2:509–513 [DOI] [PMC free article] [PubMed] [Google Scholar]
- 13.Medhus AW, Lofthus CM, Bredesen J, Husebye E. Gastric emptying: the validity of the paracetamol absorption test adjusted for individual pharmacokinetics. Neurogastroenterol Motil 2001;13:179–185 [DOI] [PubMed] [Google Scholar]
- 14.Mudaliar S, Mohideen P, Deutsch R, et al. Intravenous glargine and regular insulin have similar effects on endogenous glucose output and peripheral activation/deactivation kinetic profiles. Diabetes Care 2002;25:1597–1602 [DOI] [PubMed] [Google Scholar]
- 15.Kreisberg RA, Siegal AM, Owen WC. Alanine and gluconeogenesis in man: effect of ethanol. J Clin Endocrinol Metab 1972;34:876–883 [DOI] [PubMed] [Google Scholar]
- 16.Ferrannini E, Bjorkman O, Reichard GA, Jr, et al. The disposal of an oral glucose load in healthy subjects. A quantitative study. Diabetes 1985;34:580–588 [DOI] [PubMed] [Google Scholar]
- 17.Kelley D, Mitrakou A, Marsh H, et al. Skeletal muscle glycolysis, oxidation, and storage of an oral glucose load. J Clin Invest 1988;81:1563–1571 [DOI] [PMC free article] [PubMed] [Google Scholar]
- 18.Mari A, Stojanovska L, Proietto J, Thorburn AW. A circulatory model for calculating non-steady-state glucose fluxes. Validation and comparison with compartmental models. Comput Methods Programs Biomed 2003;71:269–281 [DOI] [PubMed] [Google Scholar]
- 19.Bandsma RH, Spoelstra MN, Mari A, et al. Impaired glucose absorption in children with severe malnutrition. J Pediatr 2011;158:282–287, e1 [DOI] [PubMed] [Google Scholar]
- 20.Bonuccelli S, Muscelli E, Gastaldelli A, et al. Improved tolerance to sequential glucose loading (Staub-Traugott effect): size and mechanisms. Am J Physiol Endocrinol Metab 2009;297:E532–E537 [DOI] [PubMed] [Google Scholar]
- 21.Nair S, Wilding JP. Sodium glucose cotransporter 2 inhibitors as a new treatment for diabetes mellitus. J Clin Endocrinol Metab 2010;95:34–42 [DOI] [PubMed] [Google Scholar]
- 22.Rave K, Nosek L, Posner J, Heise T, Roggen K, van Hoogdalem EJ. Renal glucose excretion as a function of blood glucose concentration in subjects with type 2 diabetes—results of a hyperglycaemic glucose clamp study. Nephrol Dial Transplant 2006;21:2166–2171 [DOI] [PubMed] [Google Scholar]
- 23.DeFronzo RA, Ferrannini E, Simonson DC. Fasting hyperglycemia in non-insulin-dependent diabetes mellitus: contributions of excessive hepatic glucose production and impaired tissue glucose uptake. Metabolism 1989;38:387–395 [DOI] [PubMed] [Google Scholar]
- 24.DeFronzo RA. Lilly lecture 1987. The triumvirate: beta-cell, muscle, liver. A collusion responsible for NIDDM. Diabetes 1988;37:667–687 [DOI] [PubMed] [Google Scholar]
- 25.De Silva A, Bloom SR. Gut hormones and appetite control: a focus on PYY and GLP-1 as therapeutic targets in obesity. Gut Liver 2012;6:10–20 [DOI] [PMC free article] [PubMed] [Google Scholar]
- 26.Lim GE, Brubaker PL. Glucagon-like peptide 1 secretion by the L-cell the view from within. Diabetes 2006;55:S70–S77 [Google Scholar]
- 27.Nauck MA, Siemsglüss J, Orskov C, Holst JJ. Release of glucagon-like peptide 1 (GLP-1 [7-36 amide]), gastric inhibitory polypeptide (GIP) and insulin in response to oral glucose after upper and lower intestinal resections. Z Gastroenterol 1996;34:159–166 [PubMed] [Google Scholar]
- 28.Mortensen K, Christensen LL, Holst JJ, Orskov C. GLP-1 and GIP are colocalized in a subset of endocrine cells in the small intestine. Regul Pept 2003;114:189–196 [DOI] [PubMed] [Google Scholar]