

Abstract
OBJECTIVE
This study addressed the long-term effect of various diets, particularly low-carbohydrate high-protein, on renal function on participants with or without type 2 diabetes.
RESEARCH DESIGN AND METHODS
In the 2-year Dietary Intervention Randomized Controlled Trial (DIRECT), 318 participants (age, 51 years; 86% men; BMI, 31 kg/m2; mean estimated glomerular filtration rate [eGFR], 70.5 mL/min/1.73 m2; mean urine microalbumin-to-creatinine ratio, 12:12) with serum creatinine <176 μmol/L (eGFR ≥30 mL/min/1.73 m2) were randomized to low-fat, Mediterranean, or low-carbohydrate diets. The 2-year compliance was 85%, and the proportion of protein intake significantly increased to 22% of energy only in the low-carbohydrate diet (P < 0.05 vs. low-fat and Mediterranean). We examined changes in urinary microalbumin and eGFR, estimated by Modification of Diet in Renal Disease and Chronic Kidney Disease Epidemiology Collaboration formulas.
RESULTS
Significant (P < 0.05 within groups) improvements in eGFR were achieved in low-carbohydrate (+5.3% [95% CI 2.1–8.5]), Mediterranean (+5.2% [3.0–7.4]), and low-fat diets (+4.0% [0.9–7.1]) with similar magnitude (P > 0.05) across diet groups. The increased eGFR was at least as prominent in participants with (+6.7%) or without (+4.5%) type 2 diabetes or those with lower baseline renal function of eGFR <60 mL/min/1.73 m2 (+7.1%) versus eGFR ≥60 mL/min/1.73 m2 (+3.7%). In a multivariable model adjusted for age, sex, diet group, type 2 diabetes, use of ACE inhibitors, 2-year weight loss, and change in protein intake (confounders and univariate predictors), only a decrease in fasting insulin (β = −0.211; P = 0.004) and systolic blood pressure (β = −0.25; P < 0.001) were independently associated with increased eGFR. The urine microalbumin-to-creatinine ratio improved similarly across the diets, particularly among participants with baseline sex-adjusted microalbuminuria, with a mean change of −24.8 (P < 0.05).
CONCLUSIONS
A low-carbohydrate diet is as safe as Mediterranean or low-fat diets in preserving/improving renal function among moderately obese participants with or without type 2 diabetes, with baseline serum creatinine <176 μmol/L. Potential improvement is likely to be mediated by weight loss–induced improvements in insulin sensitivity and blood pressure.
In recent years, growing evidence has linked obesity with progression of kidney disease (1,2) as assessed by deteriorating glomerular filtration rate (GFR) or microalbuminuria. Microalbuminuria has been identified as an early marker of chronic kidney disease (CKD) and as a predictor of progression to end-stage kidney disease (3). Moreover, CKD manifesting with microalbuminuria is an independent risk factor for morbidity and mortality from cardiovascular diseases, diabetes, and hypertension (4,5).
There is a graded association between the severity of obesity and the magnitude of microalbuminuria (6,7). Surgical weight loss can normalize glomerular hyperfiltration and the albumin excretion rate in severely obese patients (8), and dietary weight loss trials show benefits on albuminuria, proteinuria, and the decline in the estimated GFR (eGFR) in patients with pre-existing CKD. A review and meta-analysis of 13 studies, including 2 randomized trials, reported that nonsurgical weight loss interventions reduce proteinuria and blood pressure and seem to prevent further decline in renal function (9,10). However, most of the studies were relatively small and duration of follow-up short (typically not exceeding 12 months). Different dietary strategies to promote weight loss have not directly been compared in a randomized, long-term study. This is especially pertinent to low-carbohydrate high-protein diets that are debated for potentially adversely affecting kidney function, especially among patients with diabetes (11,12). A recent study among obese individuals showed that a low-carbohydrate high-protein weight loss diet was not associated with harmful effects on GFR and albuminuria compared with a low-fat diet (13).
We therefore investigated the long-term effect of low-fat, Mediterranean, and low-carbohydrate dietary intervention strategies on renal function among overweight or obese people with or without type 2 diabetes and pre-existing mild to moderate renal dysfunction in the Dietary Intervention Randomized Controlled Trial (DIRECT) (14).
RESEARCH DESIGN AND METHODS
The 2-year DIRECT
The DIRECT, previously described in detail (14), was conducted between July 2005 and June 2007 in Dimona, Israel, in a workplace at a research center with an on-site medical clinic. The trial assessed long-term weight loss and various health parameters among 322 participants randomized to one of three diets: low-fat, restricted-calorie; Mediterranean, restricted-calorie; or low-carbohydrate, non–restricted-calorie.
Eligible participants were men and women aged 40–65 years with a BMI ≥27 kg/m2. Individuals with type 2 diabetes or coronary heart disease were eligible regardless of age or BMI. Excluded were pregnant or lactating women and participants with a serum creatinine ≥176 µmol/L (≥2 mg/dL), liver dysfunction (twofold or higher of the upper limit of normal in alanine aminotransferase or aspartate aminotransferase), intestinal problems that would prevent adherence to any of the test diets, or active cancer. Participants were randomized by strata of sex, age (older or younger than the median), BMI (below or above the median), history of coronary heart disease (yes/no), type 2 diabetes (yes/no), and current use of statins (none, <1 year, ≥1 year).
The overall rate of adherence to the DIRECT was 95.4% at 1 year and 84.6% at 2 years, with a total weight loss of −4.0 kg ± 5.6 after 2 years. After 2 years, only the low-carbohydrate group significantly increased the protein proportion intake (22% of energy vs. 19% in the low-fat and Mediterranean diets, P < 0.05), fat, and dietary cholesterol, significantly decreased the amount of carbohydrates, and had the highest percentage of participants with detectable urinary ketones (P < 0.05 for all).
The participants received no financial compensation or gifts. The study was approved and monitored by the Human Subjects Committee of Soroka Medical Centre and Ben-Gurion University. The study was registered at the ClinicalTrials.gov site (http://clinicaltrials.gov), No. NCT00160108.
Blood, urine, and clinical measurements
Blood biomarkers were analyzed in Leipzig University Laboratories, Leipzig, Germany. A blood sample was drawn by venipuncture at 8:00 a.m., after a 12-h fast, at baseline, and at 6 and 24 months and stored at −80°C. Spot urinary creatinine (CREP2, Roche, Germany) and albumin (ALBT2, Tinaquant, Roche, Germany) were measured with enzymatic assays using the automated Roche/Hitachi Cobas System (Roche, Germany). Plasma insulin, serum high-sensitive C-reactive protein, total, HDL-, and LDL-cholesterol, triglycerides, leptin, and total high-molecular-weight adiponectin, apolipoprotein A1 (apoA1), and apoB100 were measured as described previously (13,15). Body weight was measured to the nearest 0.1 kg every month without shoes. Height was measured to the nearest millimeter with the use of a wall-mounted stadiometer at baseline for BMI determination. Blood pressure was measured every 3 months with the use of the DatascopAcutor 4 automated system after 5 min of rest.
Statistical analysis
We limited our eGFR analysis to 318 participants because of missing eGFR data in 4 subjects. We calculated eGFR, according to the Modification of Diet in Renal Disease (MDRD) equation (16,17): [175 × (serum creatinine)−1.154 × (age)−0.203 × (0.742 if female)] and according to the Chronic Kidney Disease Epidemiology Collaboration (CKD-EPI) equation (18) [141 × min(serum creatinine/κ, 1)α × max(serum creatinine/κ, 1)−1.209 × 0.993Age × 1.018 (if female)], where κ is 0.7 for females and 0.9 for males, α is −0.329 for females and −0.411 for males, min indicates the minimum of serum creatinine/κ or 1, and max indicates the maximum of serum creatinine /κ or 1. We dichotomized the study population according to baseline eGFR levels (above or below 60 mL/min/1.73 m2, eGFR range at baseline 30–151 mL/min/1.73 m2). Univariate correlation analysis was used to evaluate the associations between changes in eGFR and changes in blood biomarkers and clinical measurements after 2 years. The paired t test was used to evaluate changes in eGFR throughout the intervention.
We further cross-classified our population by randomized diet group and CKD stage and further by diabetes status and performed a similar analysis, as described above. We performed a multivariable regression analysis to identify predictors of change in eGFR, including in the model age, sex, diet group, diabetes status, and use of ACE inhibitors and the univariate significant predictors of changes in insulin and blood pressure. We calculated the urine albumin-to-creatinine ratio to assess changes in microalbuminuria after 2 years of dietary intervention because the protein-to-creatinine ratio in a random urine specimen provides evidence of the presence of significant proteinuria (19). We defined microalbuminuria as a urine albumin-to-creatinine ratio >25 for women or >17 for men (20,21) and also evaluated this ratio as a continuous variable. We performed univariate analysis to evaluate the associations between changes in the albumin-to-creatinine ratio and changes in blood biomarkers, clinical measurements, and dietary assignment among those with or without microalbuminuria at baseline.
A multivariable model, adjusted for age, sex, diet group, diabetes status, use of ACE inhibitors, 2-year weight loss, decrease in fasting insulin level, blood pressure, and 2-year change in saturated fat was performed to evaluate the independent diet-induced changes in microalbuminuria. Data analysis is presented for the MDRD and CKD-EPI equations.
SPSS 19 software was used for all statistical analyses. P < 0.05 denoted statistical significance. Values reported are means ± SDs, unless otherwise stated. Multiple linear regression results are reported with the parameter estimate and P value for each variable.
RESULTS
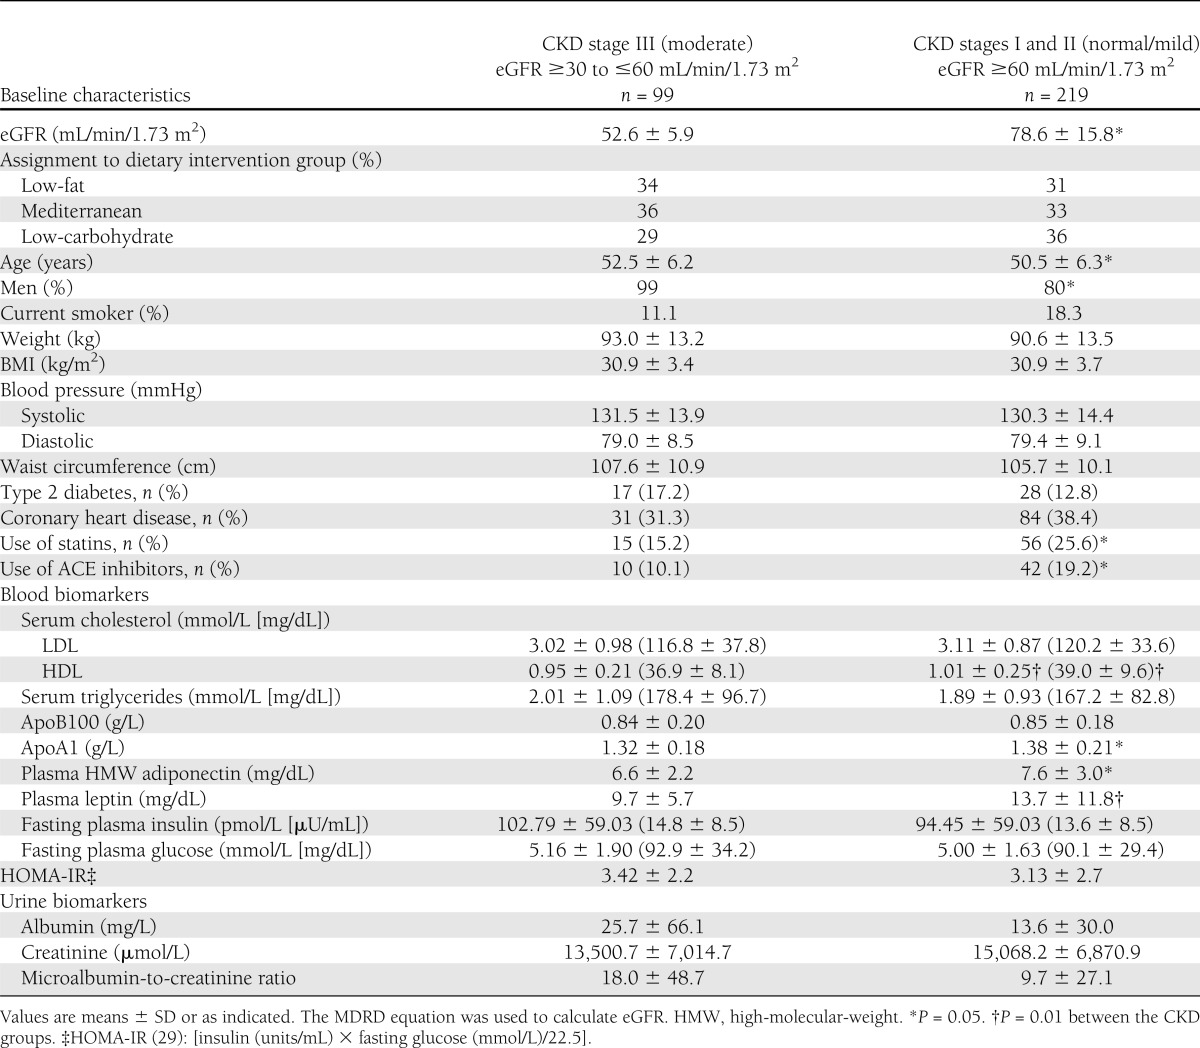
The DIRECT participants at baseline (age, 51 years; 86% men; BMI, 31 kg/m2; mean eGFR, 70.5 mL/min/1.73 m2; mean urine microalbumin-to-creatinine ratio, 12.12) had similar distribution of serum creatinine and urine biomarkers, as well as demographic and clinical characteristics across the three assigned diet groups (Supplementary Table 1). At baseline (Table 1), 31% of the participants had eGFR of 30 to ≤60 mL/min/1.73 m2, defined as CKD stage III (moderate), and were distributed similarly across the three diets. Compared with the participants with CKD stage I/II, those with CKD stage III were older, had a higher proportion of men, had lower levels of adiponectin, apoA1, and leptin, and were less likely to use ACE inhibitors and statins (P < 0.05 between groups for all).
Table 1.
Baseline characteristics of the DIRECT study population according to baseline CKD stage
Two-year changes of eGFR
Dietary intervention resulted in a significant increase in eGFR, regardless of the dietary strategy: the low-carbohydrate diet (ΔeGFR +5.3% [95% CI 2.1–8.5]) was as effective as the Mediterranean (ΔeGFR +5.2% [3.0–7.4] or low-fat diets (ΔeGFR +4.0% [0.9–7.1], P < 0.05 for all compared with baseline), with similar magnitude (P > 0.05) of effect across the diet groups (Fig. 1A). Dietary intervention resulted in a significant increase in eGFR, regardless of the dietary strategy: the low-carbohydrate diet (ΔeGFR +1.6%; P = 0.004) was as effective as the Mediterranean (ΔeGFR +1.8%; P < 0.001) or low-fat diets (ΔeGFR +0.4%; P = 0.09), with similar magnitude (P > 0.05) of effect across the diet groups; importantly, this apparent improvement in renal function was not blunted in subgroups with pre-existing conditions, indicating renal dysfunction or high risk for deterioration of renal function.
Figure 1.

A: Two-year changes of eGFR within baseline stages for CKD stage III (black line, eGFR ≤60 mL/min/1.73 m2, moderate to severe) and CKD stages I/II (dashed line, eGFR >60 mL/min/1.73 m2; mild to normal). *P < 0.05 for improvement within groups after 2 years of intervention. B: Two-year changes in eGFR across dietary intervention groups receiving low-fat diet (black line), Mediterranean diet (gray line) and low-carbohydrate diet (dashed line). *P < 0.05 for improvement within groups after 2 years of intervention. Two-year changes of eGFR across dietary intervention groups and CKD stage for eGFR >60 mL/min/1.73 m2 (CKD stage I/II) (C), and eGFR <60 mL/min/1.73 m2 (CKD stage III) (D) for patients receiving a low-fat diet (black line), Mediterranean diet (gray line), and a low-carbohydrate diet (dashed line). *P < 0.05 for improvement within groups after 2 years of ntervention. E: Two-year changes of eGFR across diabetes status for those with (black line) and without (dashed line) type 2 diabetes. *P < 0.05 for improvement within groups after 2 years of intervention.
Pre-existing moderate CKD.
Two years of dietary intervention were associated with an increase in eGFR among participants with moderate CKD stage III (ΔeGFR +7.1 ± 3.66% [95% CI 3.4–10.9], P < 0.05 compared with baseline). This effect was at least as prominent as in those with CKD I/II (ΔeGFR +3.7 ± 2.61% [2.1–5.4], P < 0.05 compared with baseline and P = 0.055 between groups; Fig. 1B). When further cross-classified by diet and CKD stage (Fig. 1C and D), participants with CKD stage III on the low-carbohydrate diet increased eGFR significantly by 10% (P = 0.012 compared with baseline), those on the Mediterranean diet by 6% (P = 0.002 compared with baseline), and those on the low-fat diet by a nonsignificant 5.4% (P = 0.190).
Two years of dietary intervention were associated with an increase in eGFR among persons with moderate CKD stage III (ΔeGFR +2.6%, P = 0.001 compared with baseline). This effect was at least as prominent as in those with CKD I/II (ΔGFR +1.1%, P < 0.001 compared with baseline and P = 0.33 between groups). When further cross-classified by diet and CKD stage, participants with CKD stage III on the low-carbohydrate diet increased eGFR significantly by +2.9% (P = 0.18 compared with baseline), those on the Mediterranean diet by +2.1% (P = 0.05 compared with baseline), and those on the low-fat diet by a nonsignificant +2.9% (P = 0.01).
Pre-existing type 2 diabetes.
Patients with type 2 diabetes (n = 45), who reduced 3.5 ± 5.7 kg after 2 years of intervention, significantly improved (Fig. 1E) their eGFR by +6.7% (95% CI 3.0–0.4), similar to the +4.5% (2.7–6.3) improvement for participants without diabetes (P < 0.05 for all compared with baseline), regardless of dietary intervention group.
The eGFR significantly improved in patients with type 2 diabetes by +2.2% (P = 0.003), similar to a +1.1% (P < 0.001) improvement in participants without diabetes.
Predictors for 2-year improvement in eGFR
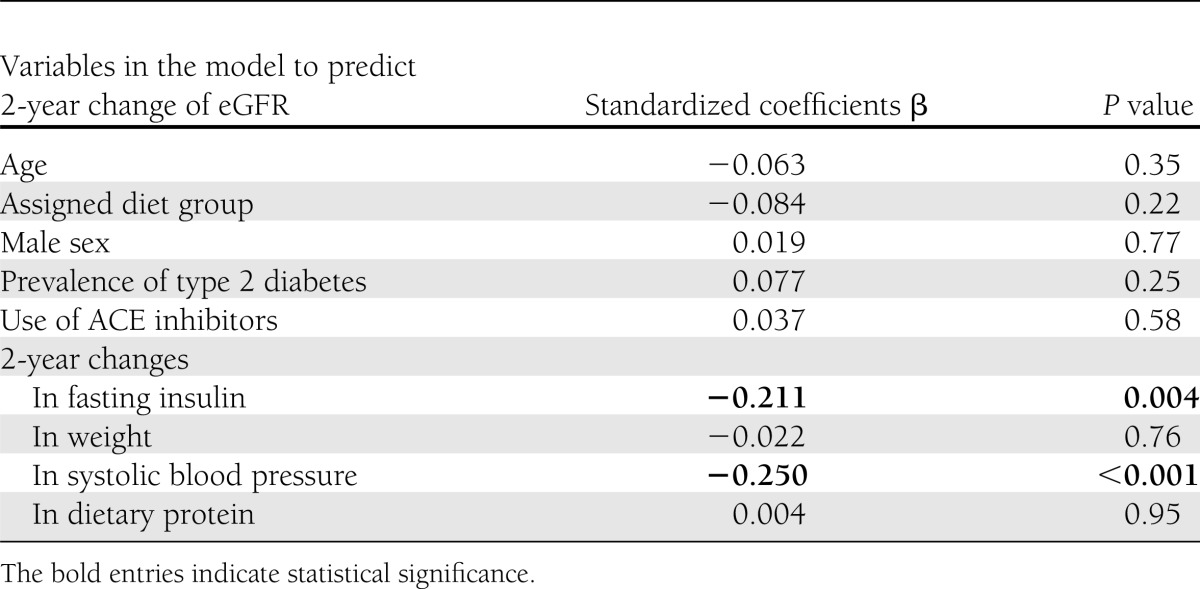
In a univariate correlation analysis, 2-year increase in eGFR was significantly associated with 2-year decrease of body weight, fasting plasma insulin levels, homeostasis model assessment of insulin resistance (HOMA-IR), and systolic and diastolic blood pressure (P < 0.05 for all). No association was found with age, diabetes status, diet group, or 2-year changes in specific macronutrients. A multivariable model (Table 2) adjusted for age, sex, diet group, diabetes status, use of ACE inhibitor medications, 2-year weight loss, and 2-year change in protein intake found only a decrease of fasting plasma insulin (β = −0.211, P = 0.004) and a decrease in systolic blood pressure (β = −0.25, P < 0.001) were associated with increased eGFR. When we used the CKD-EPI equation (18) for estimating the eGFR, we received similar significant results. In a multivariable model adjusted for age, sex, diet group, diabetes status, usage of ACE inhibitor medications, 2-year weight loss and 2-year change in protein intake, only a decrease of fasting plasma insulin (β = −0.186, P = 0.008) and a decrease in systolic blood pressure (β = −0.195, P = 0.006) were associated with increased eGFR when calculated by CKD-EPI equation.
Table 2.
Factors associated with 2-year increase in eGFR from a multivariable regression model
Two-year changes of urine albumin and creatinine
Among the 23 participants who met the criteria for microalbuminuria at baseline, sex-adjusted levels of urinary albumin and creatinine decreased after 2 years (mean −24.8 ± 51.6 mg/L, P < 0.05; Fig. 2). This decrease was −37.9 and significantly borderline only in the low-carbohydrate group (P = 0.079), −0.2 in the Mediterranean group (P = 0.993), and −52.7 in the low-fat diet (P = 0.270). Among the 299 participants without microalbuminuria at baseline, the urinary albumin-to-creatinine ratio did not significantly alter. Overall, only 4 of the 23 remained microalbuminuric after 2 years of intervention (82.6% cure), whereas 7 of 299 participants who did not have baseline microalbuminuria progressed to having microalbuminuria after 2 years (2.3% progression).
Figure 2.

Two-year changes in albumin-to-creatinine ratio across microalbuminuria at baseline. The urine albumin-to-creatinine ratio was ≥17 for men and ≥25 for women. (No microalbuminuria, n = 299; microalbuminuria, n = 23). ■ = baseline, □ = after 2 years of intervention. *P < 0.05 for improvement within groups after 2 years of intervention. †P < 0.05 for improvement between groups after 2 years of intervention.
Predictors for 2-year improvement in urine albumin-to-creatinine ratio
In a univariate correlation analysis, the 2-year decrease in the urinary albumin and creatinine level was significantly associated with the 2-year decrease of fasting insulin levels and HOMA-IR, as well as with higher baseline levels of urine microalbumin (P < 0.05 for all). The 2-year decrease in the urine albumin-to-creatinine ratio directly correlated with the decrease of the saturated fat level (P = 0.054). No association was found with age, diabetes status, diet group, 2-year weight loss, or changes in protein intake. In a multivariable model (data not shown) adjusted for age, sex, diet group, diabetes status, use of ACE inhibitor medications, 2-year weight loss, decrease in fasting insulin, blood pressure, and the 2-year change in saturated fat, only higher baseline levels of urinary microalbumin (β = −0.793, P < 0.001) remained the independent predictor for successful diet-induced improvement in microalbuminuria.
CONCLUSIONS
In this study, we describe the renal outcome in a relatively large, long-term randomized controlled trial in which low-carbohydrate, Mediterranean, and low-fat diets were used to induce weight loss in obese and overweight subjects with or without type 2 diabetes and serum creatinine of ≤176 µmol/L. The low-carbohydrate diet was at least as effective as the Mediterranean or low-fat diets in improving eGFR, an effect likely mediated in all three diets by the weight loss-induced improvement in blood pressure and in insulin sensitivity. Remarkably, this trend of apparent improvement in renal functions was not attenuated, and indeed tended to be more pronounced, in participants with pre-existing (baseline) conditions indicating diminished renal function or being at high risk for deterioration of renal function; namely, lower baseline eGFR, type 2 diabetes, and microalbuminuria.
Several limitations of our study warrant consideration. Few women were enrolled in the study, thus compromising our ability to identify sex-specific risk factors in the effects of the various diets on kidney function, although there seemed to be similar weight loss-induced improvements in eGFR and microalbuminuria in men and women (data not shown). In addition, although the subgroups of patients with diabetes and advanced renal impairment are of great interest to assess the effects of weight loss diets on kidney function, most of our participants were not diabetic and had relatively conserved kidney function. In particular, only 23 had microalbuminuria at baseline. Use of this relatively healthy population could have potentially led to underestimation of the beneficial effect of weight loss on kidney function in the most vulnerable groups. Nevertheless, a significant improvement in eGFR could still be observed in addition to robust regression of microalbuminuria, thus underscoring the importance of weight loss on slowing the progression, and perhaps even regressing, CKD at early stages of the disease in patients with and without diabetes.
Furthermore, another consideration is that all estimating equations for GFR, including the MDRD Study equation, were suggested to be less accurate in patients with obesity. In fact, it has been argued that GFR estimates in obese people should be indexed to body surface area (22). Moreover, MDRD may be less accurate than CKD-EPI in the normal and slightly increased range of serum creatinine concentrations (<133 mol/L [1.5 mg/dL]), which is the relevant range for detecting CKD (<60 mL/min/1.73 m2) (23). Therefore, we analyzed and presented the data also with the CKD-EPI equation, which resulted in similarly significant findings.
Use of the calculated eGFR and spot urine microalbuminuria (rather than a 24-h urine collection) is a limitation. Furthermore, we used single spot urine at each time point, although the Kidney Disease: Improving Global Outcomes (KDIGO) recommends confirmation of albuminuria in two of three spot urine collections because of intraindividual day-to-day variation.
Changes in muscle mass can affect creatinine levels, thus affecting eGFR and/or the albumin-to-creatinine urine ratio, so changes in fat-free mass may potentially confound results that suggest improved renal function, though probably in opposite directions. After 2 years, however, nearly all participants had stabilized weight or tended to exhibit slight weight regain, which is not consistent with muscle breakdown.
The strengths of the study include the one-phase design, in which all participants started simultaneously, the relatively long duration of the study, the large size, the equal intensity of the intervention while achieving three significantly distinct diet patterns, the high adherence rate, and the repeated comprehensive measurements of creatinine, eGFR, and microalbumin and creatinine throughout the follow-up period. The latter allows us to determine that patients with type 2 diabetes exhibit a continuous improvement in eGFR (from baseline to 6 months and from 6 to 24 months) despite a significant degree of weight regain in the latter phase of the study, which may represent effects of the dietary intervention on kidney function independent of body weight.
Low-protein diets have been proposed to patients with CKD for more than 50 years. However, the effects of these diets in preventing severe kidney failure and the need for maintenance dialysis have not been resolved. A recent Cochrane review (24) showed reducing protein intake in patients with CKD reduces the occurrence of renal death by 32% compared with higher or unrestricted protein intake. To avoid 1 renal death, 2–56 patients need to be treated with a low-protein diet during 1 year. The optimal level of protein intake could not be confirmed from these studies, however. Extrapolating the effects of macronutrients, and especially protein, on the deterioration of kidney function from studies in patients with CKD to obese people is not obvious. Most of the participants included in those studies have already had advanced kidney disease, and the effects cannot be generalized to those with early subclinical loss of renal function. Our findings are consistent with results from a recently published small randomized trial of 68 participants with a shorter follow-up period of 1 year and with another recently published randomized trial with relatively low adherence demonstrating that a very low-carbohydrate diet did not adversely affect renal function compared with a high-carbohydrate diet in healthy obese individuals (13,25). Other studies were also consistent with lack of renal adverse effects during weight loss with relatively high protein–containing diets (26,27).
For patients with diabetes, the wariness regarding use of high-protein diets is even greater, because dietary protein restriction was shown to slow the progression of nephropathy in patients with type 1 diabetes (28) and the risk of end-stage renal disease (29,30). Similar observations were confirmed in a meta-analysis of five studies including 108 patients in which dietary protein restriction resulted in a slower progression of diabetic nephropathy (31). In type 2 diabetes, a low protein diet has also been suggested to improve renal function among patients with macroalbuminuria, although no benefit could be documented among patients with normal renal function or with microalbuminuria (32).
Several studies have provided evidence that the source of the dietary protein may be more important for renal function than the absolute amount of protein consumed. For example, replacing red meat with chicken in the usual diet reduced urinary albumin excretion by 46% in patients with type 2 diabetes with microalbuminuria (33) or macroalbuminuria (34). Moreover, a diet including a high amount of fish protein, consumption of which was encouraged in our interventional trial, provided protection from the development of diabetic nephropathy (31,35). Some of the differences observed between the various sources of dietary proteins have been attributed to different proportions of saturated versus polyunsaturated fat in meat, chicken, and fish. A higher content of polyunsaturated fatty acids was reported to have beneficial effects on endothelial function (36) that could reduce albuminuria and renal injury.
Moreover, weight loss per se may improve kidney function indirectly by its effects on blood pressure, glycemia, and lipid profile, which may outweigh the potential deleterious effects of specific dietary macro- or micronutrients. Therefore, the beneficial effects of Mediterranean and low-carbohydrate diets on insulin sensitivity and lipid profile, respectively (13), and the lack of inferiority in improving kidney function and regression of microalbuminuria compared with the low-fat diet, suggest that these diets could be an alternative dietary approach for overweight and obese people with mild renal dysfunction and/or type 2 diabetes.
We found a strong association between a decrease in systolic blood pressure and fasting insulin level with improvement in eGFR and regression of microalbuminuria. Elevated blood pressure is a well-characterized risk factor for kidney damage and microalbuminuria (37), as well as hyperinsulinemia, which is strongly correlated with the development of microalbuminuria early in the course of metabolic syndrome and diabetes, independent of glucose levels (38,39). In an experimental model in mice lacking the gene for the melanocortin-4 receptor, the relative contribution of hyperinsulinemia and hypertension to the development of renal dysfunction could be differentiated. These mice were hyperinsulinemic but normotensive (40), yet developed glomerular hyperfiltration and albuminuria. When hypertension was induced, their GFR and albuminuria further increased significantly. These data support the concept of an additive or even synergistic effect of obesity, hyperinsulinemia, and elevated blood pressure on glomerular hemodynamics.
In conclusion, we found that dietary interventions to reduce weight cause progressive improvement in eGFR and marked regression of microalbuminuria regardless of the dietary approach. In patients with a pre-existing moderate renal dysfunction and microalbuminuria, or in patients with type 2 diabetes, a low-carbohydrate high-protein diet is not inferior to other dietary approaches in improving kidney function.
Acknowledgments
This work was supported by grants from The Israeli Ministry of Health, Chief Scientist Office (Project No. 300000-4850) and The Dr. Robert C. and Veronica Atkins Research Foundation. This foundation was not involved in any stage of the design and conduct of the study; collection, management, analysis, and interpretation of the data; as well as preparation, review, or approval of the manuscript, and had no access to the study results before publication.
No potential conflicts of interest relevant to this article were reported.
A.T. contributed to conception and design, acquisition of data, analysis and interpretation of data, drafting of the manuscript, critical revision of the manuscript for important intellectual content, and obtaining funding. R.G. contributed to conception and design, acquisition of data, analysis and interpretation of data, statistical analysis, drafting of the manuscript, and critical revision of the manuscript for important intellectual content. I.H.-B. and Y.H. contributed to conception and design, analysis and interpretation of data, and critical revision of the manuscript for important intellectual content. D.S., A.R., and M.J.S. contributed to conception and design, analysis and interpretation of data, critical revision of the manuscript for important intellectual content, and obtaining funding. J.K. contributed to analysis and interpretation of data and critical revision of the manuscript for important intellectual content. G.M.F., M.B., M.S., and J.T. contributed to conception and design, acquisition of data, analysis and interpretation of data, and critical revision of the manuscript for important intellectual content. I.S. contributed to conception and design, acquisition of data, analysis and interpretation of data, statistical analysis, drafting of the manuscript, critical revision of the manuscript for important intellectual content, and obtaining funding. I.S. is the guarantor of this work and, as such, had full access to all the data in the study and takes responsibility for the integrity of the data and the accuracy of the data analysis.
The authors thank the DIRECT participants for their significant contribution.
Footnotes
Clinical trial reg. no. NCT00160108, clinicaltrials.gov.
This article contains Supplementary Data online at http://care.diabetesjournals.org/lookup/suppl/doi:10.2337/dc12-1846/-/DC1.
References
- 1.Eckel RH, Barouch WW, Ershow AG. Report of the National Heart, Lung, and Blood Institute-National Institute of Diabetes and Digestive and Kidney Diseases Working Group on the pathophysiology of obesity-associated cardiovascular disease. Circulation 2002;105:2923–2928 [DOI] [PubMed] [Google Scholar]
- 2.Wahba IM, Mak RH. Obesity and obesity-initiated metabolic syndrome: mechanistic links to chronic kidney disease. Clin J Am Soc Nephrol 2007;2:550–562 [DOI] [PubMed] [Google Scholar]
- 3.Keane WF, Eknoyan G. Proteinuria, albuminuria, risk, assessment, detection, elimination (PARADE): a position paper of the National Kidney Foundation. Am J Kidney Dis 1999;33:1004–1010 [DOI] [PubMed] [Google Scholar]
- 4.Asselbergs FW, Diercks GF, Hillege HL, et al. Prevention of Renal and Vascular Endstage Disease Intervention Trial (PREVEND IT) Investigators Effects of fosinopril and pravastatin on cardiovascular events in subjects with microalbuminuria. Circulation 2004;110:2809–2816 [DOI] [PubMed] [Google Scholar]
- 5.Leoncini G, Sacchi G, Viazzi F, et al. Microalbuminuria identifies overall cardiovascular risk in essential hypertension: an artificial neural network-based approach. J Hypertens 2002;20:1315–1321 [DOI] [PubMed] [Google Scholar]
- 6.Praga M, Morales E. Obesity, proteinuria and progression of renal failure. Curr Opin Nephrol Hypertens 2006;15:481–486 [DOI] [PubMed] [Google Scholar]
- 7.Chagnac A, Weinstein T, Herman M, Hirsh J, Gafter U, Ori Y. The effects of weight loss on renal function in patients with severe obesity. J Am Soc Nephrol 2003;14:1480–1486 [DOI] [PubMed] [Google Scholar]
- 8.Navaneethan SD, Yehnert H. Bariatric surgery and progression of chronic kidney disease. Surg Obes Relat Dis 2009;5:662–665 [DOI] [PubMed] [Google Scholar]
- 9.Navaneethan SD, Yehnert H, Moustarah F, Schreiber MJ, Schauer PR, Beddhu S. Weight loss interventions in chronic kidney disease: a systematic review and meta-analysis. Clin J Am Soc Nephrol 2009;4:1565–1574 [DOI] [PMC free article] [PubMed] [Google Scholar]
- 10.Afshinnia F, Wilt TJ, Duval S, Esmaeili A, Ibrahim HN. Weight loss and proteinuria: systematic review of clinical trials and comparative cohorts. Nephrol Dial Transplant 2010;25:1173–1183 [DOI] [PubMed] [Google Scholar]
- 11.Reddy ST, Wang CY, Sakhaee K, Brinkley L, Pak CY. Effect of low-carbohydrate high-protein diets on acid-base balance, stone-forming propensity, and calcium metabolism. Am J Kidney Dis 2002;40:265–274 [DOI] [PubMed] [Google Scholar]
- 12.Jameel N, Pugh JA, Mitchell BD, Stern MP. Dietary protein intake is not correlated with clinical proteinuria in NIDDM. Diabetes Care 1992;15:178–183 [DOI] [PubMed] [Google Scholar]
- 13.Friedman AN, Ogden LG, Foster GD, et al. Comparative effects of low-carbohydrate high-protein versus low-fat diets on the kidney. Clin J Am Soc Nephrol 2012;7:1103–1111 [DOI] [PMC free article] [PubMed] [Google Scholar]
- 14.Shai I, Schwarzfuchs D, Henkin Y, et al. Dietary Intervention Randomized Controlled Trial (DIRECT) Group Weight loss with a low-carbohydrate, Mediterranean, or low-fat diet. N Engl J Med 2008;359:229–241 [DOI] [PubMed] [Google Scholar]
- 15.Shai I, Spence JD, Schwarzfuchs D, et al. DIRECT Group Dietary intervention to reverse carotid atherosclerosis. Circulation 2010;121:1200–1208 [DOI] [PubMed] [Google Scholar]
- 16.Levey AS, Coresh J, Balk E, et al. National Kidney Foundation National Kidney Foundation practice guidelines for chronic kidney disease: evaluation, classification, and stratification. Ann Intern Med 2003;139:137–147 [DOI] [PubMed]
- 17.National Kidney Foundation K/DOQI clinical practice guidelines for chronic kidney disease: evaluation, classification, and stratification. Am J Kidney Dis 2002;39(Suppl. 1):S1–S266 [PubMed] [Google Scholar]
- 18.Levey AS, Stevens LA, Schmid CH, et al.; CKD-EPI (Chronic Kidney Disease Epidemiology Collaboration). A new equation to estimate glomerular filtration rate. Ann Intern Med 2009;150:604–612 [DOI] [PMC free article] [PubMed]
- 19.Price CP, Newall RG, Boyd JC. Use of protein:creatinine ratio measurements on random urine samples for prediction of significant proteinuria: a systematic review. Clin Chem 2005;51:1577–1586 [DOI] [PubMed] [Google Scholar]
- 20.Bakker AJ. Detection of microalbuminuria. Receiver operating characteristic curve analysis favors albumin-to-creatinine ratio over albumin concentration. Diabetes Care 1999;22:307–313 [DOI] [PubMed] [Google Scholar]
- 21.Justesen TI, Petersen JL, Ekbom P, Damm P, Mathiesen ER. Albumin-to-creatinine ratio in random urine samples might replace 24-h urine collections in screening for micro- and macroalbuminuria in pregnant woman with type 1 diabetes. Diabetes Care 2006;29:924–925 [DOI] [PubMed] [Google Scholar]
- 22.Delanaye P, Krzesinski JM. Indexing of renal function parameters by body surface area: intelligence or folly? Nephron Clin Pract 2011;119:c289–c292 [DOI] [PubMed] [Google Scholar]
- 23.Myers GL, Miller WG, Coresh J, et al. National Kidney Disease Education Program Laboratory Working Group Recommendations for improving serum creatinine measurement: a report from the Laboratory Working Group of the National Kidney Disease Education Program. Clin Chem 2006;52:5–18 [DOI] [PubMed] [Google Scholar]
- 24.Fouque D, Laville M. Low protein diets for chronic kidney disease in non diabetic adults. Cochrane Database Syst Rev 2009:CD001892. [DOI] [PubMed] [Google Scholar]
- 25.Brinkworth GD, Buckley JD, Noakes M, Clifton PM. Renal function following long-term weight loss in individuals with abdominal obesity on a very-low-carbohydrate diet vs high-carbohydrate diet. J Am Diet Assoc 2010;110:633–638 [DOI] [PubMed] [Google Scholar]
- 26.Skov AR, Toubro S, Bülow J, Krabbe K, Parving HH, Astrup A. Changes in renal function during weight loss induced by high vs low-protein low-fat diets in overweight subjects. Int J Obes Relat Metab Disord 1999;23:1170–1177 [DOI] [PubMed] [Google Scholar]
- 27.Li Z, Treyzon L, Chen S, Yan E, Thames G, Carpenter CL. Protein-enriched meal replacements do not adversely affect liver, kidney or bone density: an outpatient randomized controlled trial. Nutr J 2010;9:72 [DOI] [PMC free article] [PubMed]
- 28.Gross JL, de Azevedo MJ, Silveiro SP, Canani LH, Caramori ML, Zelmanovitz T. Diabetic nephropathy: diagnosis, prevention, and treatment. Diabetes Care 2005;28:164–176 [DOI] [PubMed] [Google Scholar]
- 29.Hansen HP, Tauber-Lassen E, Jensen BR, Parving HH. Effect of dietary protein restriction on prognosis in patients with diabetic nephropathy. Kidney Int 2002;62:220–228 [DOI] [PubMed] [Google Scholar]
- 30.Hansen HP, Christensen PK, Tauber-Lassen E, Klausen A, Jensen BR, Parving HH. Low-protein diet and kidney function in insulin-dependent diabetic patients with diabetic nephropathy. Kidney Int 1999;55:621–628 [DOI] [PubMed] [Google Scholar]
- 31.Pedrini MT, Levey AS, Lau J, Chalmers TC, Wang PH. The effect of dietary protein restriction on the progression of diabetic and nondiabetic renal diseases: a meta-analysis. Ann Intern Med 1996;124:627–632 [DOI] [PubMed] [Google Scholar]
- 32.Velázquez López L, Sil Acosta MJ, Goycochea Robles MV, Torres Tamayo M, Castañeda Limones R. Effect of protein restriction diet on renal function and metabolic control in patients with type 2 diabetes: a randomized clinical trial. Nutr Hosp 2008;23:141–147 [PubMed] [Google Scholar]
- 33.Gross JL, Zelmanovitz T, Moulin CC, et al. Effect of a chicken-based diet on renal function and lipid profile in patients with type 2 diabetes: a randomized crossover trial. Diabetes Care 2002;25:645–651 [DOI] [PubMed] [Google Scholar]
- 34.de Mello VD, Zelmanovitz T, Perassolo MS, Azevedo MJ, Gross JL. Withdrawal of red meat from the usual diet reduces albuminuria and improves serum fatty acid profile in type 2 diabetes patients with macroalbuminuria. Am J Clin Nutr 2006;83:1032–1038 [DOI] [PubMed] [Google Scholar]
- 35.Möllsten AV, Dahlquist GG, Stattin EL, Rudberg S. Higher intakes of fish protein are related to a lower risk of microalbuminuria in young Swedish type 1 diabetic patients. Diabetes Care 2001;24:805–810 [DOI] [PubMed] [Google Scholar]
- 36.Ros E, Núñez I, Pérez-Heras A, et al. A walnut diet improves endothelial function in hypercholesterolemic subjects: a randomized crossover trial. Circulation 2004;109:1609–1614 [DOI] [PubMed] [Google Scholar]
- 37.Cerasola G, Cottone S, Mulè G. The progressive pathway of microalbuminuria: from early marker of renal damage to strong cardiovascular risk predictor. J Hypertens 2010;28:2357–2369 [DOI] [PubMed] [Google Scholar]
- 38.Jauregui A, Mintz DH, Mundel P, Fornoni A. Role of altered insulin signaling pathways in the pathogenesis of podocyte malfunction and microalbuminuria. Curr Opin Nephrol Hypertens 2009;18:539–545 [DOI] [PMC free article] [PubMed] [Google Scholar]
- 39.de Boer IH, Sibley SD, Kestenbaum B, et al. Diabetes Control and Complications Trial/Epidemiology of Diabetes Interventions and Complications Study Research Group Central obesity, incident microalbuminuria, and change in creatinine clearance in the epidemiology of diabetes interventions and complications study. J Am Soc Nephrol 2007;18:235–243 [DOI] [PMC free article] [PubMed] [Google Scholar]
- 40.do Carmo JM, Tallam LS, Roberts JV, et al. Impact of obesity on renal structure and function in the presence and absence of hypertension: evidence from melanocortin-4 receptor-deficient mice. Am J Physiol Regul Integr Comp Physiol 2009;297:R803–R812 [DOI] [PMC free article] [PubMed] [Google Scholar]