

Abstract
We investigate isothermal diffusion and growth of micron-scale liquid domains within membranes of free-floating giant unilamellar vesicles with diameters between 80 and 250 μm. Domains appear after a rapid temperature quench, when the membrane is cooled through a miscibility phase transition such that coexisting liquid phases form. In membranes quenched far from a miscibility critical point, circular domains nucleate and then progress within seconds to late stage coarsening in which domains grow via two mechanisms 1), collision and coalescence of liquid domains, and 2), Ostwald ripening. Both mechanisms are expected to yield the same growth exponent, α = 1/3, where domain radius grows as timeα. We measure α = 0.28 ± 0.05, in excellent agreement. In membranes close to a miscibility critical point, the two liquid phases in the membrane are bicontinuous. A quench near the critical composition results in rapid changes in morphology of elongated domains. In this case, we measure α = 0.50 ± 0.16, consistent with theory and simulation.
Introduction
Lipid membranes embedded in water present rich dynamics. Here, we measure the rate at which liquid domains within a taut membrane coarsen after a quench to constant temperature, and we compare our results with both established and recent predictions (1–7). Tackling this problem is simpler to state than to execute; it involves experimental challenges of achieving fast, discrete temperature quenches within giant unilamellar vesicles (GUVs), and theoretical challenges of understanding 2-dimensional (2D) diffusion and critical phenomena.
It is convenient to start by considering the classic problem of a single, solid inclusion diffusing within an infinite, flat, uniform membrane with viscosity η2D. The membrane is bounded on both sides by bulk fluid of viscosity η3D. How does the inclusion’s diffusion coefficient, D, vary with its radius, r? In the limit of a small inclusion and/or high η2D, Eq. 1 below applies (8). In the opposite limit, Eq. 2 (or Eq. 3) applies (9–11). In between, numerical (9) or approximate (12) solutions apply.
Quantitative criteria for which of the three equations applies emerge from comparisons of radius with a single parameter, the hydrodynamic length Lh. Here, Lh = η2D/η3D, where η2D is in units of Pa s m (equivalent to 103 surface poise) and η3D in units of Pa s. When the inclusion is a single small solid disk for which r ≪ Lh, its diffusion coefficient is expected to be
| (1) |
where T is temperature, kB is Boltzmann’s constant, and γ = 0.5572 (8). In the opposite limit, where r ≫ Lh, the contribution of the membrane viscosity is negligible (9), and
| (2) |
A small correction (<10%) is made to Eq. 2 by assuming that the single inclusion is fluid, with the same membrane viscosity as the planar membrane through which it travels (10,11). That correction yields:
| (3) |
Deep physical questions about membrane dynamics can be posed if we allow the membrane to demix into two coexisting liquid phases such that domains enriched in one lipid type diffuse within a background membrane enriched in a different type (13–19). Differential partitioning of a dye-labeled lipid between the phases renders the domains straightforward to image on the surface of a GUV (Fig. 1). The two phases have been historically termed liquid-ordered (Lo) and liquid-disordered (Ld). The simplest membranes that produce macroscopic liquid domains in vesicles are composed of ternary mixtures: a lipid with a high melting temperature, a lipid with a low melting temperature, and cholesterol (20). The ratio of lipids and the temperature determine the area fraction, ϕ, of each phase.
Figure 1.
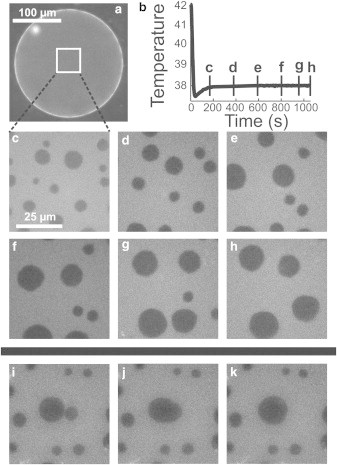
(a) Fluorescence micrograph of a free-floating GUV with diameter of ∼200 μm and composition 25:45:30 of DiPhyPC:DPPC:chol. The focus plane is at the vesicle equator. (b) Typical vesicle temperature quench, showing time points of panels c–h. (c–h) Fluorescence micrographs focused at the top surface of the GUV within the square in panel a. Circular domains diffuse and coarsen. (i–k) Two domains merge over three consecutive frames recorded at 2 frames/sec.
When the area fraction of one phase is small (e.g., ϕ ≈ 0.3), a quench into the 2-phase region nucleates many small circular domains. During the early stage of domain growth, the distribution of domain radii evolves with respect to an average radius (21). During the late stage, which we study here, domains grow within a membrane of small ϕ via two mechanisms, both of which are called coarsening. In the first mechanism, domains undergo Brownian motion, collide with each other, and coalesce (Fig. 1). The second coarsening mechanism is Ostwald ripening or evaporation-condensation, in which individual lipids evaporate from the boundary of small domains and condense onto larger domains (1).
Domain radius grows with time as r ∝ tα (4). To gain an intuition for what the value of α should be, consider the simple case of a uniform population of many small domains seeded uniformly on a membrane. When domains are small, the distance between domains is also small. As domains diffuse across the membrane, collide with other domains, and coalesce, the average distance between domains increases. This observation is quantitatively stated as domain radius r(t) is proportional to the distance between domains l(t). Diffusion coefficients, which are in units of length2/time, provide a straightforward way to find α. The time required for a domain to travel a distance l(t) via Brownian motion is (l(t))2 ∝ Drt. Because r(t) ∝ l(t), the diffusion equation can be recast as (r(t))2 ∝ Drt. Equations 1, 2, and 3 show which variables should be substituted for Dr. Domains with radius of r ≪ Lh (Eq. 1) grow such that −[r(t)2/ln r(t)] ∝ t, and hence α = 1/2 if logarithmic corrections are neglected. Similarly, domains with r ≫ Lh (Eq. 2 or 3) grow such that r(t)3 ∝ t, and hence α = 1/3 (4,7,22). These same exponents can be derived from continuum stochastic hydrodynamic simulations of domains that grow via coalescence (7). A growth exponent of α = 1/3 is also predicted when domains grow by evaporation-condensation (1).
A different scenario arises when the two membrane phases are bicontinuous and their area fractions are roughly equal, such that membrane composition passes near a line of miscibility critical points during the quench. Below the critical temperature, domain boundaries fluctuate with characteristic correlation length ξ (23–25). Interplay between ξ and hydrodynamic length Lh determines the rate at which domains coarsen. During quenching, two regimes are clearly distinguishable. In the first regime, soon after a quench, domain dimensions change primarily because elongated domains become more circular. This process is driven by line tension, the energy/length along the domain boundary. An analogy is that the domain is bounded by a stretched rubber band. Intuition for what the value of the growth exponent α should be in this case comes from assumptions that a single value of α applies and that domains are so large that r ≫ Lh. The goal is to find a relationship between length and time that gives length ∝ tα. As in Eqs. 2 and 3, when domains are large, the viscosity of the three-dimensional (3D) bulk solution dominates the domain’s diffusion, and hence its growth. Combining line tension (in units of N), 3D viscosity (in units of Ns/m2), and time (in units of s), the only way to arrive at a length (in units of m) is by [(line tension × time)/η3D]1/2. In other words, length ∝ t1/2, so α = 1/2. Within the scenario of elongated domains becoming more circular, a growth exponent α ≈ 1/2 has been seen in dissipative particle dynamics simulations (4,5). Theory and simulations have explored how growth exponents at ϕ ≈ 1/2 depend on experimental parameters, including ξ, Lh, and domain size. Universal scaling is not achieved; instead, apparent exponents are valid over limited ranges of parameters. For example, in simulations that treat membrane lipid composition and hydrodynamic flow to be coupled to flow in the surrounding solvent, an apparent growth exponent of α ≈ 1/2 is seen at intermediate values of viscosity and Lh (e.g., Peclét number = 1 and Lh = 10) (6). Similarly, when membranes and bulk fluid are modeled in a creeping flow approximation or studied via continuum stochastic hydrodynamic simulations, growth exponents of α ≈ 1/3, 1/2, or 1 are seen, depending on attributes of the membrane and bulk fluid (7).
Here, we measure diffusion coefficients, D(r), and growth exponents, α, of liquid domains within taut membranes of GUVs to test predictions of simulations and theory. Our vesicles have diameters of 80–250 μm, are embedded in bulk aqueous fluid, and undergo fast temperature quenches to a final, roughly constant temperature at which coarsening rates are measured. Vesicles are formed of ternary lipid mixtures of diphytanoylphosphatidylcholine (DiPhyPC), dipalmitoylphosphatidylcholine (DPPC), and cholesterol (chol) to minimize photooxidation of lipids and because independent measurements of membrane viscosity have been conducted for this system (26). We set the average area fraction of one phase to be either low (ϕ ≤ 0.3) or closer to that of the other phase (0.3 ≤ ϕ ≤ 0.7). We find results in good agreement with current theory both for domains that grow primarily by coalescence (for ϕ ≤ 0.3, and for late times of 0.3 ≤ ϕ ≤ 0.7) and for elongated domains (for early times of 0.3 ≤ ϕ ≤ 0.7). Our experiments differ from previous work in that we focus on a regime in which coalescence of domains dominates (14) and in our avoidance of small vesicles, inconstant temperature, substrate interactions, and/or photooxidation (15–17,19). Our measurements of diffusion coefficients yield 2D membrane viscosities of 3 × 10⁻⁹ Pa s m, in excellent agreement with literature values.
Methods
Vesicle materials and preparation
We produced spherical GUVs by electroformation as previously described (24). All phospholipids were from Avanti Polar Lipids, Alabaster, AL and all vesicles incorporated 0.8% fluorescent dye Texas red dipalmitoylphosphatidyl-ethanolamine (TR-DPPE, Life Technologies, Carlsbad, CA). When membranes were purposefully photooxidized, vesicles were formed from molar ratios of 37% cholesterol (chol, Sigma, St. Louis MO), 35% dioleoylphosphatidylcholine (DOPC), and 28% DPPC. All other vesicles were formed from mixtures of chol with DiPhyPC and DPPC, in ratios as in Table 1, with estimated uncertainty in composition <±2%. When two liquid phases are present in the membrane, the Lo phase is rich in DPPC and chol, and the Ld phase is rich in DiPhyPC and dye (27). Vesicles were formed in either low or high viscosity bulk solutions. Samples that are labeled as samples in water were formed in 100 μM sucrose in water and diluted ∼40-fold in water immediately before observation. Samples that are labeled as samples in Dextran were formed in 4–5% (by weight) dextran in 1 mM sucrose in water and diluted in 4—5% dextran. The slightly higher osmotic pressure in the vesicle interior eliminated excess membrane area and bulging of domains. Our results are not affected by any shift in miscibility transition temperature Tmix caused by membrane tension, where a 1 mN/m increase in tension decreases Tmix by a few °C (28,29). Vesicles are free-floating in solution between two coverslips. Their depth in solution is not known, but no vesicle membrane is closer than 10 μm or farther than 100 μm from a coverslip surface.
Table 1.
Summary of Growth Exponent Data
| Average area fraction (ϕ) | Lipid mol % composition (DiPhyPC: DPPC:chol) | Postquench temperature ∗∗ | Total number of quenches | Number of vesicles | Bulk solution | Early vs. late quench | Growth exponent for this subset (α)∗ | Overall growth exponent (α)∗ | Predicted growth exponent (α) |
|---|---|---|---|---|---|---|---|---|---|
| ϕ < 0.30 | 25:45:30 | 38.3 ± 1.4°C | 12 | 5 | water | NA | 0.29 ± 0.05 | 0.28 ± 0.05 | 1/3 |
| 40:30:30 | 43.4 ± 0.9°C | 5 | 3 | ||||||
| ϕ < 0.30 | 25:45:30 | 38.1 ± 3.1°C | 8 | 6 | dextran | NA | 0.27 ± 0.06 | ||
| 40:30:30 | 42.04°C | 1 | 1 | ||||||
| 0.30 < ϕ < 0.70 | 25:20:55 to 30:20:50 | 29.2 ± 0.09°C | 6 | 5 | water | late | NA | 0.31 ± 0.05 | 1/3 |
| 17.3 ± 2.5°C | 4 | 2 | dextran | ||||||
| 0.30 < ϕ < 0.70 | 30:20:50 | 28.2 ± 0.8°C | 2 | 2 | water | early | NA | 0.50 ± 0.16 | 1/2 |
| 19.4 ± 2.1°C | 6 | 3 | dextran |
Values with an asterisk ∗ include standard deviations of all measured growth exponents. Measurement uncertainties for each individual exponent are an order of magnitude smaller than standard deviations. Values with a double-asterisk ∗∗ include standard deviations of postquench temperatures for all experimental runs, which are roughly an order of magnitude greater than variations in postquench temperature (0.02°C) throughout each movie. NA denotes not applicable. The predicted growth exponent for 0.3 <ϕ < 0.7 at early times can take a range of values, including 1/2. Average area fraction is over the viewing area rather than over the entire vesicle.
Temperature quenches
Temperature was controlled as described previously (24) and recorded via custom LabVIEW software (National Instruments, Austin TX). Temperature quenches were shallow Tinitial – Tfinal <5°C, where Tfinal is the equilibrated temperature after hundreds of seconds (Table 1). All values for Tfinal lie within the 2-phase Ld-Lo coexistence region; none lie within the 3-phase Ld-Lo solid region (27). A typical temperature record for ϕ ≤ 0.3 is shown in Fig. 1 b, with a fast quench followed by a long period of nearly constant temperature. Data analysis was performed only within the latter period, after each vesicle’s temperature reached a value within 0.5°C of Tfinal. It is important to measure coarsening rates while maintaining a constant difference between miscibility transition temperature, Tmix, and sample temperature to ensure that no new domains nucleate during experiments (Fig. 2 and Fig. S1 in the Supporting Material). Likewise, it is important to minimize light exposure and/or unsaturation in lipid acyl tails because lipid photooxidation continuously alters Tmix, and thereby continuously alters the difference between Tmix and the sample temperature, even if the sample temperature is constant. Empirically, we find that photooxidation of membranes containing only saturated phospholipids lowers Tmix, albeit very slowly (24) and that photooxidation of membranes containing unsaturated lipids raises Tmix.
Figure 2.
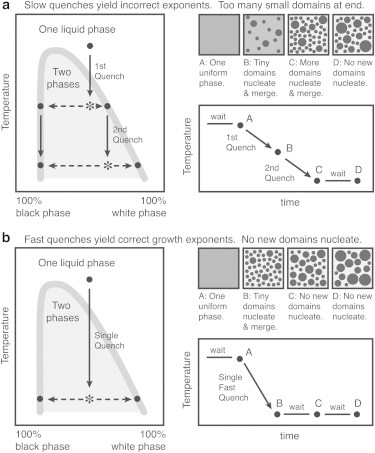
Correct coarsening exponents result from measurements at a constant temperature, after a single, fast temperature quench such that no new domains nucleate at later times.
Movies and preanalysis
We recorded movies of vesicles with diameters ∼80–250 μm (Fig. 1 a, Table S1). For all transitions initiated by a temperature quench, we minimized light exposure by employing neutral-density filters and a SmartShutter (Sutter Instrument, Novato CA) controlled through NIS-Elements (Nikon, Melville, NY). Videos were collected at 2 frames/s. Each frame was exposed for ∼150 ms, with the shutter open 10 ms before and after each exposure. To further minimize light exposure during long (>5 min) videos, data were collected in bursts of ∼30 s, separated by ∼1 min dark periods.
For transitions initiated by lipid photooxidation, microscope focus was achieved under the low-light conditions above. The experiment began when neutral density filters (ND4 and ND8) were removed and the shutter was disabled. Subsequent images were collected at 9.2 ms per frame.
Within our depth of field of <5 μm, a spherical cap of the vesicle is in focus, surrounded by a bright ring out of focus. We wrote MATLAB code (The MathWorks, Natick, MA) to identify centers of vesicles whose bright ring remained in the imaged area throughout each video. Centers of other vesicles were identified by visual inspection. Vesicles are free-floating. To correct for vesicle drift in the x-y plane, video frames were stacked on vesicle centers, and then cropped to yield images as in Fig. 1, c–h. Edges of square viewing areas ranged from ∼18–60 μm. To correct for vesicle drift in z, microscope focus was periodically adjusted. Images were thresholded such that Ld phase appears white and Lo appears black as described in Cicuta, except that grayscale threshold values were chosen through MATLAB’s Otsu function. All figure images are without contrast enhancement.
Deletion of rolling vesicles
Movement of domains across a centered field of view is due to a combination of domain diffusion within the vesicle membrane and rotation of the entire vesicle within bulk solution. Fig. 3, a shows trajectories of domains within rotating versus nonrotating vesicles. All vesicles with nonrandom motion of the center of mass of domains (i.e., rotation) were deleted from our sample set to avoid artifactually high diffusion coefficients. Remaining vesicles may drift without rotation, with the background fluid.
Figure 3.
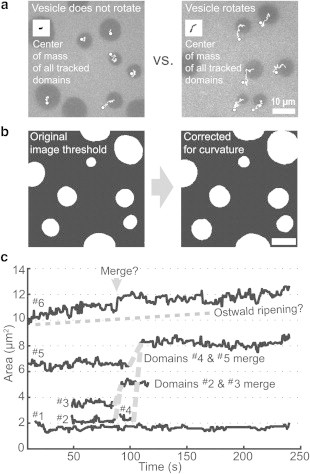
(a) Domain trajectories are used to delete rotating vesicles. First frames of movies are shown for two different vesicles. Trajectories start at each domain’s center and end after 30.5 s (61 frames), marked by a circle. Domains at frame edges are not tracked. Each inset shows the center of mass over time of all tracked domains. Vesicle rotation does not significantly influence the data set at the left so that set is retained, whereas the data set on the right is deleted. (b) Original (left) and corrected (right) cropped, thresholded images of domains on a vesicle surface. The correction accounts for distortion that occurs when caps on a 3D sphere are recorded within a flat, 2D image (30). (c) Area versus time for a typical group of domains illustrates that coarsening is dominated by collision and coalescence, not by evaporation-condensation. Domain #2 and #3 diffuse into view at t ≈ 50 s and merge by t ≈ 90 s. Domain #4 appears at t ≈ 90s and then merges with domain #5. Domains ≤ 1 μm2 elude our tracking program and may merge with visible domains (e.g., Domain #6 at t ≈ 75 s).
Geometric correction
Corrections were applied to project 2D images onto 3D vesicle shells using MATLAB code by Sarah Veatch (30). We measured vesicle radii from micrographs of each vesicle’s equator. Given our large vesicles and small viewing windows, corrections are small (Fig. 3 b and Fig. S2).
Diffusion coefficients and membrane viscosities
Diffusion coefficients were found using original MATLAB code described elsewhere (13) with the exception that runs were 10 frames long, the minimum diameter of accepted domains was >4 pixels, and the center of mass of all domains was not subtracted. Domains touching frame edges were not tracked. Temperature typically varied by ∼0.02°C during each experiment. Results from several experiments (at slightly different temperatures, Table 1) were averaged to extract membrane viscosities. Viscosities of water at average temperatures in Table 1 were calculated from Eqs. 15 and 16 of (31) using a viscosity of 1.0020 × 10⁻³ Pa s at 20°C.
Growth coefficients (α)
The area fraction of Lo phase, ϕ, is constant over the entire vesicle. In our experiments, ϕ is straightforward to measure for the membrane region in view, but not over the entire vesicle. Within each movie, area fraction changes as domains diffuse into and out of view. Problems arise in measuring unnormalized average domain radii through time: radii of domains whose centers lie outside the area of view cannot be measured accurately, and excluding those domains undercounts large domains. Instead, we measure normalized domain size, R, the total area of all black pixels divided by the total perimeter of all domains. The growth exponent, α, is the slope of a log-log plot of R versus time, where R ∝ timeα. We performed statistical tests to confirm that data require no weighting: slopes of residuals were on the order of 10−4, whereas individual uncertainties in fits of slopes were ∼10−3, and standard deviations of fits were ∼10−2.
Line tension
Vesicles were made from 30 mol % DiPhyPC, 20% DPPC, and 50% chol. They were diluted in water and imaged at 22.5°C. Movies were collected at 5 frames/s. Sequential images of merging liquid domains were filtered and thresholded within ImageJ (public domain http://rsbweb.nih.gov/ij/) and then fit to simulated domain relaxation via original MATLAB code by Jacob Wintersmith (32). The simulation assumes a single compact domain within an infinite flat membrane embedded in an infinite 3D fluid, and that η2D is negligible. The characteristic time for a domain to relax from a noncircular to a circular shape is t∗ = 2η3D (domain area)/(line tension), where η3D is viscosity of the bulk fluid, with a value of (0.9509±.005) × 10−3 Pa s. The factor of 2 accounts for liquid on both sides of the membrane.
Results
D(r) and η2D for ϕ < 0.3
Dashed lines in Fig. 4 a show that for membranes with average area fractions of ϕ < 0.3, diffusion coefficients of micron-scale Lo domains within an Ld background are qualitatively fit by D ∝ r −1 as in Eq. 2 and Eq. 3, which apply when r ≫ Lh. However, diffusion coefficients are roughly a factor of 2 slower than predicted by either Eq. 2 or Eq. 3. To quantitatively fit the coefficients, it is necessary to use equations valid between the limiting cases of r ≫ Lh and r ≪ Lh as in the approximation in (12). We evaluate the fit (solid lines in Fig. 4 a) by comparing the value of the membrane viscosity that emerges from the fit with literature values. For η3D = 0.652 × 10⁻³ Pa s at 40.3°C (31), the approximation yields η2D = (3.3 ± 1.1) × 10−9 Pa s m, with a 95% confidence interval (CI) from η2D = 1.0 × 10⁻⁹ Pa s m to 5.6 × 10⁻⁹ Pa s m. This value is in good agreement with 2D viscosities of membranes composed of the same three lipids used here, albeit at different ratios. In previous work, temperatures and compositions were tuned to place vesicles near membrane miscibility critical points. Analysis of structure factors of membrane critical composition fluctuations yielded η2D = (5.5 ± 1.5) × 10−9 Pa s m (26), and analysis of shape fluctuations of domain boundaries yielded (4 ± 1) × 10−9 Pa s m (33). The good agreement suggests that the approximation in (12), which was formulated for diffusion of a single inclusion within a uniform, flat membrane, adequately describes diffusion of a domain within a curved GUV membrane containing multiple domains, at least within experimental uncertainty. In Fig. 4 a, we make three minor improvements on measurements by Cicuta et al. (13)), namely, we confine our results to vesicles with diameters >80 μm, we correct for curvature, and we exclude vesicle rotation without subtracting the center of mass of domains.
Figure 4.
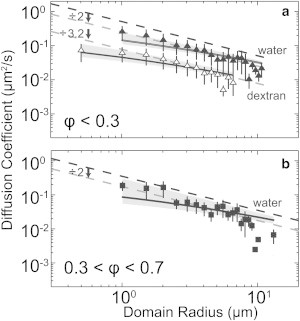
Diffusion coefficients of circular liquid domains are roughly proportional to 1/(domain radius, r). Slopes of dashed lines are −1 to show D ∝ 1/r. Dashed black lines are fits to D(r) = 2 kBT/3π2η3Dr with no free parameters, where T is the average final temperature of all quenches in each set. Translating this line downward by a factor of 2 gives the first dashed gray line. Black curves are fits to an approximation valid between r ≪ Lh and r ≫ Lh (12), and shaded regions are 95% CIs of those fits. Vertical uncertainties are standard deviations. Measurement uncertainty in domain size is at most two pixels, or 0.4 microns. Data are binned every 0.5 μm in radius. (a) Vesicles have average area fraction ϕ < 0.3 and compositions of 25:45:30 or 40:30:30 DiPhyPC:DPPC:chol. Solid versus open triangles represent vesicles diluted into water versus dextran solution. η3D for water at 40.3°C = 0.652 × 10⁻³ Pa s (31). The lower dashed gray line is offset by an additional factor of 3.2. The largest angle subtended by a domain in this set is 20°. (b) Vesicles have 0.3 < ϕ < 0.7 and compositions between 25:20:55 and 30:20:50. Data were collected once domains became roughly circular. T = 26.2°C and η3D = ηwater at 29°C = 0.864 × 10⁻³ Pa s.
Confirmation of the soundness of our approach is that the membrane viscosity we find, η2D = (3.3 ± 1.1) × 10−9 Pa s m, leads to a hydrodynamic length Lh = η2D/η3D of ∼5 μm, which is the same order of magnitude as domain radius, r. As such, we must indeed analyze our data in a way that is applicable between the limiting cases of r ≫ Lh and r ≪ Lh. Employing equations relevant to fluid rather than solid domains would likely increase our value of η2D by ∼10% because Eq. 2 and Eq. 3 differ by ∼10%.
We confirm our results by varying the bulk solution viscosity, specifically by placing vesicles in a dextran solution with a viscosity 3.2 times that of water. We expect diffusion coefficients to decrease by a factor of ∼3.2, which they do (Fig. 4 a). A separate test is to compare η2D for identical membranes made in dextran versus water solutions; they should be equivalent within experimental uncertainty, which they are. To find η2D for membranes in dextran, we set η3D within the approximation in (12) to be 3.2 times the viscosity of water at 38.1°C, i.e., η3D = 3.2 ∗ (0.675 × 10−3 Pa s), and find a best-fit value of η2D = (9.6 ± 3.0) × 10−9 Pa s m, with a 95% CI from η2D = 3.0 × 10⁻⁹ Pa s m to 1.6 × 10⁻⁸ Pa s m. As expected, this interval for η2D overlaps with the interval we found for membranes in water.
Growth exponent α for ϕ < 0.3
When the average area fraction is ϕ < 0.3, membranes contain circular Lo-phase domains that coarsen over hundreds of seconds at constant temperature (Fig. 1). These domains coarsen primarily by collision and coalescence rather than by evaporation-condensation. To illustrate this, Fig. 3 c tracks domains ≥1 μm2 coarsening over 250 s; smaller domains elude our tracking program. A hallmark of evaporation-condensation is that small domains become smaller as large domains become larger. No tracked domains shrink in Fig. 3 c. The growth of only one domain in Fig. 3 c, the largest one, is not fully explained by merges with other tracked domains. It is unclear how much of this growth is due to evaporation-condensation versus merges with untrackable domains.
With time, normalized domain size R increases, where R ∝ timeα and α is the growth exponent. We expect α = 1/3 whether domains grow by evaporation-condensation or by collision and coalescence. This expectation follows from the rough fit of diffusion coefficients in Fig. 4 a to D ∝ 1/r.
Fig. 5 a shows that α = 0.29 ± 0.05, which is indeed within experimental uncertainty of the predicted value of α = 1/3 for area fraction ϕ < 0.3. In these experiments, vesicles were diluted in water and R versus time was recorded at constant temperature after 17 distinct quenches (Table 1). Coarsening was followed for a minimum of 593 s and a maximum of 1349 s. Within uncertainty, the same growth exponent, α = 0.27 ± 0.06, was found when the bulk fluid surrounding the vesicles was dextran solution instead of water.
Figure 5.
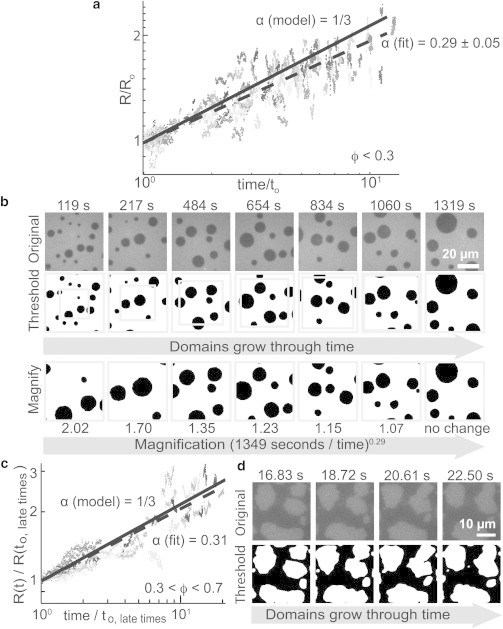
(a) Collapse plot of normalized domain size, R versus time for circular liquid domains in vesicles with average area fraction of Lo phase of ϕ < 0.3. Vesicles were diluted in water. Gray values denote 17 experiments. Data were rescaled by dividing R and time by R0 and t0, respectively, where time – t0 ranged from 593 to 1349 s. Average growth exponent (dashed line) is compared to α = 1/3 (solid line). (b) Top: Domains grow through time on the surface of a 246 μm-diameter vesicle of 25:45:30 DiPhyPC:DPPC:chol with ϕ < 0.3. No correction for vesicle curvature was applied. Middle: Thresholded and curvature-corrected versions of images. Gray boxes show areas magnified in the bottom row. Bottom: Domains appear to not grow through time when rescaled by [(1349 s)/(time – t0)]0.29. (c) Collapse plot as in panel a for vesicles with 0.3 < ϕ < 0.7 at late times. Vesicles were diluted in water and gray values denote 10 experiments. (d) At late times, domains grow primarily via collision and coalescence in vesicles with 0.3 < ϕ < 0.7. Images are shown for a 81 μm-diameter vesicle of 30:20:50 DiPhyPC:DPPC:chol with a correction for vesicle curvature.
Visual confirmation that α ≈ 1/3 for vesicles with area fraction ϕ < 0.3 is shown for a single vesicle in Fig. 5 b. When the micrographs are rescaled by a growth exponent α = 0.29, domain sizes appear roughly constant through time. For all experiments, data were collected from only the largest vesicles (>80 μm diameter) to minimize deviations from α = 1/3 arising from purely geometric considerations when domain radii approach the size of vesicle radii and from hydrodynamic coupling of two or more domains via bulk fluid inside the vesicle. We observe no clear correlation between growth exponent α and area fraction ϕ (Fig. S3).
Line tensions, η2D, and growth exponents for 0.3 < ϕ < 0.7
By choosing a membrane composition that results in comparable area fractions of Lo and Ld phases, and by making a shallow quench below the transition temperature, we place our membrane near a miscibility isothermal critical point (also called a plait point) and observe noncircular domains. Experimental signatures of proximity to a critical point of this type include fluctuating domain edges with a correlation length ξ, and low line tension between Lo and Ld phases (24,34). Here, we verify that noncircular domains prepared through a shallow quench exhibit critical behavior: we analyze fluctuations in domain boundaries as in (24) and find line tensions <1 pN (e.g., 0.35 ± 0.08 pN overall, and 0.43 ± 0.05 pN for the specific case of Fig. 6 a at late times). As an order-of-magnitude check, we find a similar value of line tension (0.063 ± 0.07 pN) by a separate method of fitting shapes of merging domains (32). This method is expected to give low apparent line tensions if domains are crowded and/or if membrane viscosity is not negligible, both of which apply here.
Figure 6.
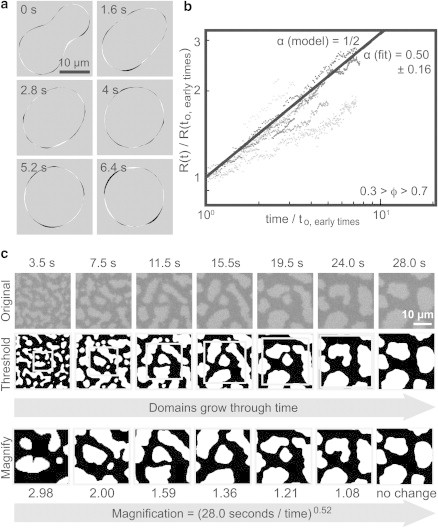
(a) Time series after a merger of two Lo domains within a background membrane of Ld phase in a vesicle composed of 30/20/50 mol % DPPC/DiPhyPC/Chol. Line tension is determined to be 0.063 ± 0.007 pN by comparison with simulations as in (32). Small areas of black and white show close agreement between data and simulations. Black denotes areas in which Lo domains were observed, but not captured by simulations; white denotes the opposite. (b) Collapse plot of normalized domain size, R versus time at early quench times for elongated liquid domains within membranes quenched through a critical composition, with 0.3 < ϕ < 0.7. Gray values denote eight experiments. Average growth exponent (dashed line) lies nearly on top of α = 1/2 (solid line). (c) Top: Domains grow through time on the surface of a 101 μm-diameter vesicle of 30:20:50 DiPhyPC:DPPC:chol with 0.3 < ϕ < 0.7. No correction for vesicle curvature was applied. Middle: Thresholded and curvature corrected versions of images. Gray boxes show areas magnified in the bottom row. Bottom: Domains appear to not grow through time when rescaled by [(28.0 s)/(time – time0)]0.52.
We measured growth rates of domains in membranes of 0.3 < ϕ < 0.7 in two different time regimes 1), early after a quench, when phases appear bicontinuous and domains are elongated, and 2), late after a quench, when domains are more circular, even though their edges still fluctuate. With time, all domains in membranes with 0.3 < ϕ < 0.7 undergo a transition: they are initially elongated and then begin to grow primarily via coalescence (Fig. 6 c and Fig. 5 d). Small domains transition before large domains. Increases in R occur both when domains change shape and when domains coalesce. We define early quench times as occurring when shape changes contribute to increases in R in all domains. Late quench times commence when shape changes cease to contribute to R.
For late quench times, the mechanism of domain growth is exactly as it was for circular domains with ϕ < 0.3, so we expect the growth exponent to be the same, namely α = 1/3. Experimentally, we find good agreement: α = 0.31 ± 0.05 for late quench times for a membrane with 0.3 < ϕ < 0.7 (Fig. 5 c, Table 1). The expectation that α = 1/3 rests on an assumption that domains diffuse with approximately D ∝ 1/r. The data in Fig. 4 b roughly uphold this assumption for the system at hand: late quench times for 0.3 < ϕ < 0.7. The data are fit even better by an approximation valid between the limiting cases of r ≫ Lh and r ≪ Lh (12), which yields a best-fit value of η2D = (7.0 ± 3.3) × 10−9 Pa s m, within a 95% CI from η2D = 1.5 × 10⁻¹¹ Pa s m to 1.4 × 10⁻⁸ Pa s m. This value of η2D is within experimental uncertainty of values measured in membranes of ϕ < 0.3.
All results about fit a coherent picture employing well-established theory in which domains that grow by collision and coalescence on GUVs have diffusion coefficients that vary roughly as D ∝ 1/r, and also growth exponents of α ≈ 1/3. Now we turn to bicontinuous phases observed at early times after a quench of a membrane near a critical composition. Description of this system through theory and simulation has been an active area of research for almost a decade (4–7,22) with no previous experimental verification.
Membranes quenched through a critical point contain elongated domains (Fig. 6 c), which become more circular with time. In this system, normalized domain size, R, grows by three mechanisms, morphological changes of domains from elongated to more circular shapes, collision-coalescence, and evaporation-condensation. Experimentally, we find α = 0.50 ± 0.16 at early quench times for elongated domains (Fig. 6 b). As in Fig. 5 b, domains within a near-critical membrane early after a quench appear self-similar; when micrographs in Fig. 6 c are rescaled by the growth exponent, domain sizes appear constant through time.
Note that because the growth exponent α takes different values at early versus late times after a quench near a critical point, dynamic scaling is not universal for this system as it was for membranes with ϕ < 0.3. Measured exponents are only apparent growth exponents. Scaling breaks down entirely when quenches of membranes produce domains within other domains, both in our experiments (Fig. 7 a) and in simulations (6,7).
Figure 7.
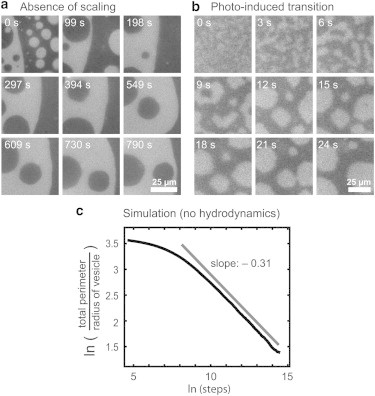
(a) Time sequence of coexisting liquid domains in the membrane of a vesicle with a critical composition. For the entire vesicle (but not for this field of view), areas of dark and bright regions are roughly equal. Images are not self-similar, i.e., no scaling operation can render the images to appear similar, and no growth exponent can be extracted. (b) Coarsening of liquid domains in a membrane in which a miscibility transition was initiated by photooxidation of lipids. (c) Simulated coarsening of ∼200 spherical caps that diffuse with D ∝ 1/r on the surface of a sphere, where r is the arc length from the center to the edge of each cap, and area fraction ϕ = 0.09. When caps collide, they coalesce. An offset line with slope of −0.31 is shown for comparison.
Triggering changes in Tmix via photooxidation
Jumps in miscibility temperatures (Tmix) of fluorescently labeled membranes can be initiated by intense illumination, which changes membrane composition via lipid photooxidation. Here, the miscibility transition occurs isothermally. In Fig. 7 b, domains coarsen after a transition initiated by photooxidation. In our experiments, transitions initiated by high light levels are not superior to ones initiated by a quench in sample temperature because timescales are similar for both. More importantly, once photooxidation is initiated, it is not easily curtailed. Maintaining a constant offset between Tmix and the sample temperature, which is required for quantitative analysis of growth exponents and diffusion coefficients, becomes arduous.
Discussion
Within lipid vesicles, four natural length scales arise, and their interplay determines the rate of domain diffusion and coarsening. First is hydrodynamic length Lh = η2D/η3D. Second is normalized domain size R. Third is correlation length, ξ, for domains in a membrane near a miscibility critical point. Correlation length is inversely proportional to line tension. When correlation lengths are large and line tension is small, boundaries of domains fluctuate, resulting in noncircular domains. Fourth is vesicle diameter.
In the Results section, we found that fitting diffusion coefficients of Lo domains in free-floating vesicles of DiPhyPC/DPPC/chol yields membrane viscosities of (3.3 ± 1.1) × 10−9 Pa s m (in bulk water and with ϕ < 0.3), of (9.6 ± 3.0) × 10−9 Pa s m (in bulk dextran solution and with ϕ < 0.3), and of (7.0 ± 3.3) × 10−9 Pa s m (in bulk water and with 0.3 < ϕ < 0.7). These values are in good agreement with previous values (η2D = (5.5 ± 1.5) × 10−9 Pa s m and (4 ± 1) × 10−9 Pa s m) found by analyzing structure factors of composition fluctuations (26) and by analyzing shape fluctuations of domain boundaries within membranes of the same three lipids at a similar lipid ratio and temperature (33). This agreement implies that reasonably accurate measurements of diffusion coefficients can be made over the range of domain sizes probed here, even though domains can appear crowded (35). It is valid to compare membrane viscosities between vesicles with slightly different lipid ratios because lateral diffusion coefficients of lipids within Ld versus Lo domains in vesicles and planar bilayers differ by a factor of only ∼2–10 (36–38). Moreover, membrane viscosities measured in other systems are the same order of magnitude. In fluid membranes of DOPC/DPPC/chol, η2D ≈ 5 × 10⁻¹⁰ to 3 × 10⁻⁹ Pa s m (from (12) using data from (13)). In fluid membranes of SOPC, η2D = (3 ± 1) × 10−9 Pa s m ((39), also references within). In 1:1 DiPhyPC/DPPC membranes, solid domains diffuse across liquid membranes of η2D = (2.2 ± 0.1) × 10−9 Pa s m (18). Taken together, these results imply that for many vesicle systems, length Lh is ∼1 μm and that deviations from theories that treat domain diffusion as entirely dominated by the effects of momentum dissipation into water (e.g., from r ≫ Lh,) should be expected for even planar systems such as black lipid membranes. Previous work has instead suggested that such deviations are primarily due to confinement of domains on a curved surface and hydrodynamic interactions between domains (35).
We find that domains that coarsen via collision and coalescence have a growth exponent of α ≈ 1/3. This result holds whether the bulk fluid in which vesicles are embedded is water or a more viscous solution containing dextran. It holds whether domains are in membranes with 0.3 < ϕ < 0.7 at late times after a quench or in membranes with ϕ < 0.3. A different exponent, α ≈ 1/2, applies to elongated domains seen early after a quench in membranes with 0.3 < ϕ < 0.7.
A range of experimentally measured growth exponents for circular domains in vesicles have been previously published. Those measurements did not uniformly exclude cases with inconstant temperature, bulged domains, or small vesicles. In 2006, Saeki et al. (15) reported α ≈ 0.15 using vesicles of 35:35:30 DOPC/DPPC/chol with diameter ∼50 μm and noted that some domains curved outward. Domains that bulge out of the spherical shell of a vesicle (i.e., “dimples”) interact through elastic deformation of the surrounding membrane. Bulged domains are kinetically hindered from coarsening (40–43). In 2007, Yanagisawa et al. (16) reported α ≈ 2/3 using vesicles of 40:40:20 DOPC/DPPC/chol with diameters ∼10–150 μm. Their value of α ≈ 2/3 applied to vesicles that did not exhibit “trapped coarsening” of dimples. They speculated that domains attract each other. Work by others (23,24) implies that no net attractive or repulsive interactions exist between unbulged domains because fluctuations in domain boundaries fit normal capillary theory (Tobias Baumgart, personal communication). In 2007, Liang et al. (17) reported α ≈ 1/3 for domains smaller than 1 μm and α ≈ 1 for domains larger than 1 μm within vesicles of 1:1:1 bovine brain sphingomyelin/DOPC/chol with diameter >20 μm. They speculated that α ≈ 1 at long observation times could be explained if domain merges triggered subsequent merges. Their longest observation time was roughly an order of magnitude shorter than the shortest run in Fig. 5 a.
Other researchers have studied coarsening in membranes in which domain coalescence is negligible. For membranes strongly coupled to solid substrates, Jensen et al. (14) found α = 0.31 for coarsening dominated by evaporation-condensation and Tayebi et al. (19) reported a typical value of α = 0.46 for stacks of 100–1000 membranes. For monolayer liquid domains that repel each other, Seul et al. found α = 0.28 (44).
Growth exponents measured here for domains that grow by collision and coalescence within a unilamellar vesicle membrane are in excellent agreement with predictions from theory and simulation, which give α = 1/3 over a broad range of domain sizes (1–4). The same value is expected for membranes in highly viscous fluid (2).
Our results are limited to domains that have not yet grown as large as the vesicle; domains coarsen until membranes eventually contain only one Ld domain and one Lo domain. Deviations from a growth exponent of α = 1/3 are expected when large domains couple via hydrodynamics (35). Even when the bulk solution in contact with the vesicle is neglected, deviations from α = 1/3 arise from geometry and/or poor statistics when domain and vesicle sizes are comparable. To illustrate this point, Fig. 7 c shows results of a simulation in which domains diffuse on a spherical surface with D ∝ 1/r and coarsen purely by coalescence. The surface was seeded with ∼200 spherical caps. Strong deviations from the overall growth exponent α = 0.31 occur at short times during equilibration of domain sizes. Weak deviations occur at long times, when the average domain radius divided by the vesicle radius becomes greater than 10−0.8, or ∼16%. Deviations at long times are due to geometric reasons and/or to poor statistics, because few domains populate the vesicle at long times. The largest domains observed in our movies seldom exceeded this value of 16% (Table S1).
In our experiments, we avoided conditions that can produce anomalously low or high values of α. The growth exponent will be too low 1), if domains bulge out of the membrane; 2), if the difference between the experimental temperature and the membrane miscibility transition temperature (Tmix) decreases through time, either because photooxidation lowers Tmix or because sample temperature increases; 3), if large domains are undercounted in a measurement of average domain radius; 4), if large domains are undercounted because vesicles are too small; or 5), if the viewing area is flat against a substrate such that domains move too slowly (45). In contrast, the growth exponent will be too high 1), if the difference between the experimental temperature and Tmix increases through time, either because photooxidation of unsaturated phospholipids increases Tmix, or because sample temperature decreases; or 2), if flow of the exterior bulk solution brings domains frequently in contact with a substrate that has a preferential interaction with one phase versus the other. All of these experimental challenges have proven straightforward to surmount here using free floating giant unilamellar vesicles of DiPhyPC/DPPC/chol.
In addition to investigating growth exponents for domains that coarsen through collision and coalescence, we measured growth exponents for elongated domains soon after a quench in membranes with 0.3 < ϕ < 0.7. At early times, shape changes contribute to increases in R in all domains and α = 0.50 ± 0.16. Because the growth exponent for domains in a membrane with area fraction 0.3 < ϕ < 0.7 has different values at early and late times after a quench, dynamic scaling is not universal in this system. Recent simulations have identified similar scaling violations. Camley and Brown (7) used continuum stochastic hydrodynamic simulations, which include temperature fluctuations. They concluded that if scaling is ever observed in a system like ours in which the characteristic length scale of a domain, R, is not orders of magnitude smaller than Lh, then the growth exponent α should be 1/2, with the caveat that their simulation does not clearly predict whether scaling should be seen or not. Similarly, Fan et al. (6) modeled spinodal decomposition of a lipid membrane hydrodynamically coupled to viscous solvent. They investigated cases of Lh = 0, Lh = ∞, and Lh = 10ξ, where ξ is correlation length. In our system, the approximation ξ = kBT/(line tension) ≈ 10−2 μm yields Lh = 500ξ, which is closest to the case of Lh = 10ξ. For Lh = 10ξ and Peclét number of Pe = 1, Fan et al. find an apparent scaling regime with α ≈ 1/2. In the same system, Pe = 0.1 results in a different value of the apparent exponent α, and Pe ≥ 10 results in a breakdown of dynamical scaling. In our system, quenches to slightly different temperatures may result in changes in correlation length that are manifested as different apparent scaling exponents, explaining the relatively large experimental uncertainty in our reported value of α = 0.50 ± 0.16. Earlier dissipative particle dynamics simulations (4,5,22) produced α = 1/2 or 1/3 depending on solvent conditions, with the caveat that membrane viscosity may be unphysically low in some dissipative particle dynamics simulations (7).
Conclusion
Membrane dynamics are unusually rewarding to study. As M. Laradji and P. B. Sunil Kumar note, “The dynamics of in-plane demixing of multicomponent vesicles into coexisting phases is richer than its counterpart in bulk systems” (3). Here, we have investigated coarsening dynamics of membrane domains that grow via three possible mechanisms: collision-coalescence, evaporation-condensation, and morphological changes. Domains that grow primarily by collision-coalescence have scaling exponents of α = 0.28 ± 0.05 and α = 0.31 ± 0.05, in line with theory predicting α ≈ 1/3. Elongated domains, which grow via all three mechanisms, have scaling exponents of α = 0.50 ± 0.16, consistent with a predicted apparent scaling regime.
Acknowledgments
We thank Pietro Cicuta for his domain-tracking MATLAB routine, which we customized, and for verifying domain diffusion coefficients. We thank Sarah Veatch for her program to project 2-D images onto 3-D spheres, Adrienne Battle for exploring other ways to assess diffusion, Pokuan Ho and Peter Holmes for assistance with data analysis, and Mikko Haataja, Brian Camley, and Frank Brown for insights into their theory and simulations. Our experiments were inspired by discussions with P. B. Sunil Kumar at a stimulating conference organized by M. Imai and S. Komura. S.L.K. cannot adequately thank Harden McConnell enough for years of friendship and mentorship.
This work was supported by National Science Foundation MCB-0744852, UW Molecular Biophysics Training grant NIH #5 T32 GM08268-21A1, and UW Center for Nanotechnology IGERT #DGE-0504573.
Footnotes
Aurelia R. Honerkamp-Smith’s present address is: Department of Applied Mathematics and Theoretical Physics, University of Cambridge, Cambridge England CB3 0WA.
Gregory Garbès Putzel’s present address is: Department of Biomedical Engineering, Northwestern University, Evanston IL
Supporting Material
References
- 1.Lifshitz I.M., Slyozov V.V. The kinetics of precipitation from supersaturated solid solutions. J. Phys. Chem. Solids. 1961;19:35–50. [Google Scholar]
- 2.Taniguchi T. Shape deformation and phase separation dynamics of two-component vesicles. Phys. Rev. Lett. 1996;76:4444–4447. doi: 10.1103/PhysRevLett.76.4444. [DOI] [PubMed] [Google Scholar]
- 3.Laradji M., Sunil Kumar P.B. Dynamics of domain growth in self-assembled fluid vesicles. Phys. Rev. Lett. 2004;93:198105. doi: 10.1103/PhysRevLett.93.198105. [DOI] [PubMed] [Google Scholar]
- 4.Laradji M., Sunil Kumar P.B. Domain growth, budding, and fission in phase-separating self-assembled fluid bilayers. J. Chem. Phys. 2005;123:224902. doi: 10.1063/1.2102894. [DOI] [PubMed] [Google Scholar]
- 5.Ramachandran S., Laradji M., Sunil Kumar P.B. Lateral organization of lipids in multi-component liposomes. J. Phys. Soc. Jpn. 2009;78:041006. [Google Scholar]
- 6.Fan J., Han T., Haataja M. Hydrodynamic effects on spinodal decomposition kinetics in planar lipid bilayer membranes. J. Chem. Phys. 2010;133:235101. doi: 10.1063/1.3518458. [DOI] [PubMed] [Google Scholar]
- 7.Camley B.A., Brown F.L.H. Dynamic scaling in phase separation kinetics for quasi-two-dimensional membranes. J. Chem. Phys. 2011;135:225106. doi: 10.1063/1.3662131. [DOI] [PubMed] [Google Scholar]
- 8.Saffman P.G., Delbrück M. Brownian motion in biological membranes. Proc. Natl. Acad. Sci. USA. 1975;72:3111–3113. doi: 10.1073/pnas.72.8.3111. [DOI] [PMC free article] [PubMed] [Google Scholar]
- 9.Hughes B.D., Pailthorpe B.A., White L.R. The translational and rotational drag on a cylinder moving in a membrane. J. Fluid Mech. 1981;110:349–372. [Google Scholar]
- 10.De Koker, R. 1996. Domain structures and hydrodynamics in lipid monolayers. PhD thesis. Stanford University, CA.
- 11.Seki K., Ramachandran S., Komura S. Diffusion coefficient of an inclusion in a liquid membrane supported by a solvent of arbitrary thickness. Phys. Rev. E Stat. Nonlin. Soft Matter Phys. 2011;84:021905. doi: 10.1103/PhysRevE.84.021905. [DOI] [PubMed] [Google Scholar]
- 12.Petrov E.P., Schwille P. Translational diffusion in lipid membranes beyond the Saffman-Delbruck approximation. Biophys. J. 2008;94:L41–L43. doi: 10.1529/biophysj.107.126565. [DOI] [PMC free article] [PubMed] [Google Scholar]
- 13.Cicuta P., Keller S.L., Veatch S.L. Diffusion of liquid domains in lipid bilayer membranes. J. Phys. Chem. B. 2007;111:3328–3331. doi: 10.1021/jp0702088. [DOI] [PubMed] [Google Scholar]
- 14.Jensen M.H., Morris E.J., Simonsen A.C. Domain shapes, coarsening, and random patterns in ternary membranes. Langmuir. 2007;23:8135–8141. doi: 10.1021/la700647v. [DOI] [PubMed] [Google Scholar]
- 15.Saeki D., Hamada T., Yoshikawa K. Domain-growth kinetics in a cell-sized liposome. J. Phys. Soc. Jpn. 2006;75:013602. [Google Scholar]
- 16.Yanagisawa M., Imai M., Ohta T. Growth dynamics of domains in ternary fluid vesicles. Biophys. J. 2007;92:115–125. doi: 10.1529/biophysj.106.087494. [DOI] [PMC free article] [PubMed] [Google Scholar]
- 17.Liang X., Li L., Yang Y. Domain growth dynamics in multicomponent vesicles composed of BSM/DOPC/cholesterol. Physica A. 2010;389:3965–3971. [Google Scholar]
- 18.Petrov E.P., Petrosyan R., Schwille P. Translational and rotational diffusion of micrometer-sized solid domains in lipid membranes. Soft Matter. 2012;8:7552–7555. [Google Scholar]
- 19.Tayebi L., Ma Y., Parikh A.N. Long-range interlayer alignment of intralayer domains in stacked lipid bilayers. Nat. Mater. 2012;11:1074–1080. doi: 10.1038/nmat3451. [DOI] [PubMed] [Google Scholar]
- 20.Veatch S.L., Keller S.L. Separation of liquid phases in giant vesicles of ternary mixtures of phospholipids and cholesterol. Biophys. J. 2003;85:3074–3083. doi: 10.1016/S0006-3495(03)74726-2. [DOI] [PMC free article] [PubMed] [Google Scholar]
- 21.Lifshitz E.M., Pitaevskii L.P. Butterworth-Heinemann; Burlington, MA: 2002. Physical Kinetics. [Google Scholar]
- 22.Ramachandran S., Komura S., Gompper G. Effects of an embedding bulk fluid on phase separation dynamics in a thin liquid film. Europhys. Lett. 2010;89:56001. [Google Scholar]
- 23.Esposito C., Tian A., Baumgart T. Flicker spectroscopy of thermal lipid bilayer domain boundary fluctuations. Biophys. J. 2007;93:3169–3181. doi: 10.1529/biophysj.107.111922. [DOI] [PMC free article] [PubMed] [Google Scholar]
- 24.Honerkamp-Smith A.R., Cicuta P., Keller S.L. Line tensions, correlation lengths, and critical exponents in lipid membranes near critical points. Biophys. J. 2008;95:236–246. doi: 10.1529/biophysj.107.128421. [DOI] [PMC free article] [PubMed] [Google Scholar]
- 25.Honerkamp-Smith A.R., Veatch S.L., Keller S.L. An introduction to critical points for biophysicists; observations of compositional heterogeneity in lipid membranes. Biochim. Biophys. Acta. 2009;1788:53–63. doi: 10.1016/j.bbamem.2008.09.010. [DOI] [PMC free article] [PubMed] [Google Scholar]
- 26.Honerkamp-Smith A.R., Machta B.B., Keller S.L. Experimental observations of dynamic critical phenomena in a lipid membrane. Phys. Rev. Lett. 2012;108:265702. doi: 10.1103/PhysRevLett.108.265702. [DOI] [PMC free article] [PubMed] [Google Scholar]
- 27.Veatch S.L., Gawrisch K., Keller S.L. Closed-loop miscibility gap and quantitative tie-lines in ternary membranes containing diphytanoyl PC. Biophys. J. 2006;90:4428–4436. doi: 10.1529/biophysj.105.080283. [DOI] [PMC free article] [PubMed] [Google Scholar]
- 28.Portet T., Gordon S.E., Keller S.L. Increasing membrane tension decreases miscibility temperatures; an experimental demonstration via micropipette aspiration. Biophys. J. 2012;103:L35–L37. doi: 10.1016/j.bpj.2012.08.061. [DOI] [PMC free article] [PubMed] [Google Scholar]
- 29.Uline M.J., Schick M., Szleifer I. Phase behavior of lipid bilayers under tension. Biophys. J. 2012;102:517–522. doi: 10.1016/j.bpj.2011.12.050. [DOI] [PMC free article] [PubMed] [Google Scholar]
- 30.Veatch S.L., Cicuta P., Baird B. Critical fluctuations in plasma membrane vesicles. ACS Chem. Biol. 2008;3:287–293. doi: 10.1021/cb800012x. [DOI] [PubMed] [Google Scholar]
- 31.Kestin J., Sokolov M., Wakeham W.A. Viscosity of liquid water in the range -8°C to 150°C. J. Phys. Chem. Ref. Data. 1978;7:941–948. [Google Scholar]
- 32.Wintersmith J.R., Zou L., Mann E.K. Determination of interphase line tension in Langmuir films. Phys. Rev. E Stat. Nonlin. Soft Matter Phys. 2007;75:061605. doi: 10.1103/PhysRevE.75.061605. [DOI] [PubMed] [Google Scholar]
- 33.Camley B.A., Esposito C., Brown F.L.H. Lipid bilayer domain fluctuations as a probe of membrane viscosity. Biophys. J. 2010;99:L44–L46. doi: 10.1016/j.bpj.2010.07.007. [DOI] [PMC free article] [PubMed] [Google Scholar]
- 34.Tian A., Johnson C., Baumgart T. Line tension at fluid membrane domain boundaries measured by micropipette aspiration. Phys. Rev. Lett. 2007;98:208102. doi: 10.1103/PhysRevLett.98.208102. [DOI] [PubMed] [Google Scholar]
- 35.Aliaskarisohi S., Tierno P., Fischer T.M. On the diffusion of circular domains on a spherical vesicle. J. Fluid Mech. 2010;654:417–451. [Google Scholar]
- 36.Kahya N., Scherfeld D., Schwille P. Differential lipid packing abilities and dynamics in giant unilamellar vesicles composed of short-chain saturated glycerol-phospholipids, sphingomyelin and cholesterol. Chem. Phys. Lipids. 2005;135:169–180. doi: 10.1016/j.chemphyslip.2005.02.013. [DOI] [PubMed] [Google Scholar]
- 37.Lindblom G., Orädd G. Lipid lateral diffusion and membrane heterogeneity. Biochim. Biophys. Acta. 2009;1788:234–244. doi: 10.1016/j.bbamem.2008.08.016. [DOI] [PubMed] [Google Scholar]
- 38.Honigmann A., Walter C., Wagner R. Characterization of horizontal lipid bilayers as a model system to study lipid phase separation. Biophys. J. 2010;98:2886–2894. doi: 10.1016/j.bpj.2010.03.033. [DOI] [PMC free article] [PubMed] [Google Scholar]
- 39.Dimova R., Dietrich C., Pouligny B. Falling ball viscometry of giant unilamellar vesicle membranes: finite-size effects. Eur. Phys. J. B. 1999;12:589–598. [Google Scholar]
- 40.Baumgart T., Hess S.T., Webb W.W. Imaging coexisting fluid domains in biomembrane models coupling curvature and line tension. Nature. 2003;425:821–824. doi: 10.1038/nature02013. [DOI] [PubMed] [Google Scholar]
- 41.Funkhouser C.M., Solis F.J., Thornton K. Coupled composition-deformation phase-field method for multicomponent lipid membranes. Phys. Rev. E Stat. Nonlin. Soft Matter Phys. 2007;76:011912. doi: 10.1103/PhysRevE.76.011912. [DOI] [PubMed] [Google Scholar]
- 42.Ursell T.S., Klug W.S., Phillips R. Morphology and interaction between lipid domains. Proc. Natl. Acad. Sci. USA. 2009;106:13301–13306. doi: 10.1073/pnas.0903825106. [DOI] [PMC free article] [PubMed] [Google Scholar]
- 43.Semrau S., Schmidt T. Membrane heterogeneity - from lipid domains to curvature effects. Soft Matter. 2009;17:3174–3186. [Google Scholar]
- 44.Seul M., Morgan N.Y., Sire C. Domain coarsening in a two-dimensional binary mixture: growth dynamics and spatial correlations. Phys. Rev. Lett. 1994;73:2284–2287. doi: 10.1103/PhysRevLett.73.2284. [DOI] [PubMed] [Google Scholar]
- 45.Stottrup B.L., Veatch S.L., Keller S.L. Nonequilibrium behavior in supported lipid membranes containing cholesterol. Biophys. J. 2004;86:2942–2950. doi: 10.1016/S0006-3495(04)74345-3. [DOI] [PMC free article] [PubMed] [Google Scholar]
Associated Data
This section collects any data citations, data availability statements, or supplementary materials included in this article.