

Abstract
Recent studies have revealed new insights into the endocytosis of vaccinia virus (VACV). However, the mechanism of fusion between viral and cellular membranes remains unknown. We developed a microfluidic device with a cell-trap array for immobilization of individual cells, with which we analyzed the acid-dependent fusion of single virions. VACV particles incorporating enhanced green fluorescent protein (EGFP) and labeled with self-quenching concentrations of R18 membrane dye were used in combination with total internal reflection fluorescence microscopy to measure the kinetics of R18 dequenching and thus single hemifusion events initiated by a fast low-pH trigger. These studies revealed unexpectedly long lag phases between pH change and hemifusion. In addition, we found that EGFP fluorescence in the virus was quenched upon acidification, indicating that protons could access the virus core, possibly through a proton channel. In a fraction of virus particles, EGFP fluorescence was recovered, presumably after fusion-pore formation and exposure of the core to the physiological pH of the host-cell cytosol. Given that virus-encoded cation channels play a crucial role in the life cycle of many viruses and can serve as antiviral drug targets, further investigations into a potential VACV viroporin are justified. Our findings indicate that the microfluidic device described may be highly beneficial to similar studies requiring fast kinetic measurements.
Introduction
The ultimate goal of a virus particle is to deliver the viral genome into new host cells, thus allowing for production of progeny viruses. One of the most challenging barriers in this process is the plasma membrane, which surrounds the host-cell cytosol. In the case of enveloped virus particles, this barrier is crossed by fusion of the virus membrane with a cellular membrane. This process can take place at the plasma membrane itself or at the limiting membrane of an intracellular compartment after endocytosis of virus particles. Triggers that induce the necessary protein rearrangements may involve receptor interactions and changes in the physicochemical properties of the endosome, e.g., the pH (1).
Fusion mediated by simple viral fusion proteins, such as the influenza A virus (IAV) hemagglutinin, the dengue virus E protein, and the vesicular stomatitis virus (VSV) G protein, is well-understood, in part even in atomic detail (2). The more complex fusion machinery of herpes- and poxviruses, in contrast, is less well understood and requires further investigation (3–5).
Elucidating virus fusion is critical for a complete understanding of virus entry and may serve in the development of antiviral agents that interfere with this process, such as the HIV fusion inhibitor enfuvirtide (6). Moreover, virus fusion serves as a model for the multitude of membrane fusion events that take place throughout the cell, in both the secretory pathway and the endocytic system (7,8).
Bulk fusion kinetics have traditionally been obtained by using virus particles (or liposomes) labeled with self-quenching quantities of the lipophilic dye octadecyl rhodamine B chloride (R18) (9). For this, virus particles are bound to cells in suspension and total R18 fluorescence in a cuvette is measured in a fluorometer. Fusion is detected as the increase of R18 fluorescence—a direct consequence of hemifusion and thus dequenching of R18 due to its dilution into cellular membranes. Measuring fusion in bulk, however, cannot resolve single fusion events and may therefore obscure heterogeneities in virus populations or fusion kinetics. Furthermore, fusion at the plasma membrane cannot be directly distinguished from fusion with limiting membranes of endocytic vesicles.
Supported lipid bilayers (SLBs) are compatible with planar microfluidic devices and have therefore been used to visualize and quantify single fusion events of viruses and vesicles (10,11). However, this approach requires artificial membranes that are restricted in lipid composition such that, for instance, only low concentrations of cholesterol are possible (12). Thus, SLBs do not accurately reflect the situation of a complex biological membrane. SLB experiments are, in addition, limited to conditions in which all necessary factors for binding and fusion—mostly proteins and lipids—are known and compatible with the generation of SLBs.
We aimed to pursue single-virus fusion experiments with vaccinia virus (VACV), a complex DNA virus that serves as the model poxvirus and is closely related to variola virus, the causative agent of smallpox (13). We chose the more abundant mature virions (MVs) for our studies, as their single membrane can fuse with different cellular membranes and is amenable to labeling. MVs normally fuse with the limiting membranes of intracellular endocytic organelles after uptake by endocytosis (4,14,15). In the case of VACV strain Western Reserve (WR), fusion is triggered by acidification of endosomes (14). It is important to note that fusion at the plasma membrane can also be artificially triggered by briefly treating MVs bound to the plasma membrane with a low-pH buffer at 37°C (16). Although it is clear that the 11 subunits of the VACV entry fusion complex (EFC) are required for fusion (5), the requirements for the acceptor membrane are poorly understood. In fact, preliminary experiments suggest that VACV MVs do not bind efficiently to a variety of artificial membranes, indicating the need for an experimental system with native biological membranes (Fig. S1 in the Supporting Material).
Total internal reflection fluorescence (TIRF) microscopy allows the visualization of plasma membrane events, such as clathrin-mediated endocytosis of VSV (17), and could in principle be used to visualize fusion at the plasma membrane. Since endocytosed virus particles leave the evanescent field of the TIRF microscope, no extra measures, such as inhibition of endosomal acidification, need be undertaken to distinguish between fusion at the plasma membrane or from endocytic vesicles. However, due to their size, VACV MVs do not diffuse under adherent cells and therefore cannot be analyzed using the conventional TIRF microscopy approaches used for other virus entry studies.
Microfluidic devices are widely used for single-cell studies due to the similar size of their channels and thus the possibility to passively immobilize single cells (18,19). To date, single-cell experiments based on microfluidic technology have yielded important insights, which would be obscured by measurements of the whole population (20–22).
To study single fusion events of VACV MVs, we established a microfluidic device that trapped suspension cells with bound R18-labeled virus particles in hurdle structures (Fig. 1). As the buffer flow gently pressed the cells against the underlying coverslip, virions bound to the plasma membrane were brought into the evanescent field of a TIRF microscope. Fluorescence of R18 in the virus membrane, as well as a fluorescent protein in the virus core, could be detected microscopically during low-pH-induced fusion. The pH was monitored using fluorescein-isothiocyanate-labeled bovine serum albumin (BSA-FITC) immobilized to the coverslip by microcontact printing (23). This allowed us to measure the kinetics of single hemifusion events and to determine lag phases and R18 dequenching rates for individual virus particles. Our studies further reveal that the fluorescence of EGFP fused to a core protein was quenched upon acidification of the extracellular milieu. The recovery of EGFP fluorescence indicated that contact with the host-cell cytosol after fusion-pore formation brought the EGFP back to physiological pH. These findings suggest that the VACV membrane contains a proton channel.
Figure 1.
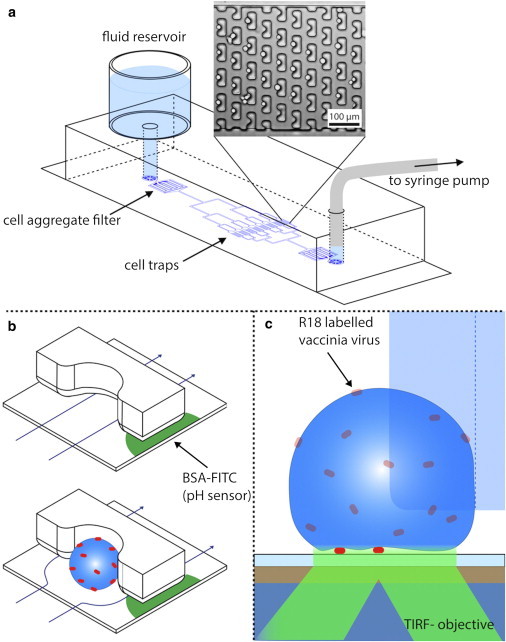
Illustration of the microfluidic device used for cell-virus fusion. (a) Fluids are withdrawn through the channel network from a reservoir with a syringe pump. Posts inside the channel act as filters to retain large agglomerates of cells and debris, whereas single cells are captured in cell traps (see brightfield image). (b) The working principle of cell traps. Without a trapped cell, the fluid can pass under the traps. After a cell has been trapped, the flow is diverted (around the cell), making it unlikely to trap more than one cell. Microcontact-printed BSA-FITC is used to monitor the pH inside the channel directly next to the cell. (c) Side view of the set-up. The cell is slightly pressed onto the glass by the buffer flow. Single virus particles are imaged by two-color TIRF microscopy with an evanescent field of 250 nm.
Materials and Methods
For details of the microfabrication, image acquisition, and data analysis, see the Supporting Material.
Reagents
2-(N-morpholino)ethanesulfonic acid (MES), tris(hydroxymethyl)aminomethane, Triton X-100, BSA, BSA-FITC, and hexamethyldisilazane (HMDS) were obtained from Sigma Aldrich (St. Louis, MO). SU-8 3005, SU-8 2050, AZ1518, and developers for the resists were bought from Microchem (Newton, MA). Poly(dimethylsiloxane) (PDMS) (Sylgard 184) was from Dow Corning (Midland, MI). 1H,1H,2H,2H-Perfluorodecyl-dimethylchlorosilane was obtained from ABCR (Karlsruhe, Germany). R18 and phosphate-buffered saline (PBS) were from Invitrogen (Carlsbad, CA). Hybridoma cells to produce the mouse anti-L1 (monoclonal antibody (MAb) 7D11) (24) were kindly provided by Bernard Moss (National Institutes of Health, Bethesda, MD) with permission of Alan Schmaljohn (University of Maryland, Baltimore, MD). MAbs were purified from hybridoma supernatants by BioGenes (Berlin, Germany).
Cell lines
BSC-40 (African green monkey) were cultivated in DMEM (Life Technologies, Carlsbad, CA) supplemented with 10% heat-inactivated fetal calf serum, GlutaMAX, nonessential amino acids, sodium pyruvate, and penicillin-streptomycin. HeLa S3 suspension cells were grown in RPMI 1640 GlutaMAX medium (Life Technologies) with 10% heat-inactivated fetal calf serum, nonessential amino acids, and penicillin-streptomycin in a spinner bottle.
Viruses
R18-labeled MVs of VACV strains WR EGFP-A4 (25) or WR EL EGFP (15) were produced in BSC-40 cells and purified/labeled as described previously (26). MVs from cytosolic extracts were sedimented through a 36% sucrose cushion (80 min, 43,000 × g, 4°C), resuspended in 10 mM TRIS, pH 9.0, and incubated with R18 at a final concentration of 22.5 μM for 2 h at room temperature. Labeled MVs were sedimented (40 min, 38,000 × g, 4°C) and purified through a 25–40% sucrose gradient (50 min, 12,000 × g, 4°C). Virus from aspirated bands was sedimented one last time (40 min, 38,000 × g, 4°C). MVs were resuspended in 1 mM TRIS, pH 9.0, and stored at −80°C. Self-quenching of R18 in the v membrane was verified by comparing emission spectra of virus suspensions in PBS and 1% Triton X-100/PBS using a Cary Eclipse fluorescence spectrophotometer (Varian, Palo Alto, CA) with excitation wavelength of 560 ± 5 nm and emission wavelengths from 565 to 750 nm ± 5 nm. As negative controls for fusion, labeled MVs were neutralized by incubation with 100 μg/mL 7D11, a mouse monoclonal anti-L1 antibody, for 1 h at 37°C.
Bulk fusion experiments
To monitor fusion in bulk, R18-dequenching during low-pH-induced fusion was measured using a Cary Eclipse fluorescence spectrophotometer (Varian) with an excitation wavelength of 560 ± 5 nm and an emission wavelength of 590 ± 5 nm. To measure R18 and EGFP fluorescence in the same experiments (using the same photomultiplier tube settings), EGFP fluorescence was excited with 488 ± 5 nm and measured at 509 ± 10 nm, whereas R18 was excited with 560 ± 5 nm and measured at 640 ± 5 nm. R18 fluorescence was measured at wavelengths longer than the emission maximum to adjust the signal intensities to the EGFP fluorescence. R18-labeled WR EGFP-A4 MVs were bound to 7 × 10⁵ HeLa S3 cells in the cold (MOI 30). After 1 h, cells were sedimented and resuspended in 100 μL PBS. The cell suspension with bound virions was added to 900 μl prewarmed PBS in a 1.5 ml fluorescence cell (119.004-QS, Hellma, Müllheim, Germany). After 1 min, the pH in the cuvette was lowered by addition of 100 μl MES solution (0.063–1 M), resulting in a pH of 6.5 to 5.0. R18 fluorescence was measured for 10 min, when all R18 was dequenched by the addition of 110 μl 10% Triton X-100. R18 fluorescence was normalized to the signal intensity after Triton X-100 addition.
Single-virus-particle fusion experiment
R18-labeled VACV MVs or IAV particles were bound to 5 × 10⁵ HeLa S3 suspension cells (MOI 5) at 4°C. After 1 h, cells were sedimented and resuspended in 500 μl PBS. The microfluidic device and all solutions were warmed to 37°C in the incubation chamber of the TIRF microscope. This avoided bubbles in the device and ensured that the temperature was correct for the fusion experiment. Fluids were withdrawn through the channels with a neMESYS pump (cetoni, Korbussen, Germany) operating a 2.5 ml Hamilton glass syringe that was connected with Teflon tubing to the chip. Cell suspension (50 μl) was loaded into the chip at a flow rate of 5 μl/min. Cells that were not trapped in the hurdles were washed away with PBS at the same flow rate.
A field of view containing several cells with single virus particles was identified by TIRF microscopy and fusion of bound MVs with the plasma membrane was induced by changing the buffer from PBS (pH 7.4) to 90 mM MES in PBS (pH 5.0). While changing the solution in the reservoir, the flow rate was reduced to the minimal flow sufficient to keep the cells in place (0.1 μl/min). This ensured that the pH drop in the field of view occurred rapidly and with some delay after buffer exchange. Immediately after the beginning of acquisition, the flow rate was increased to 5 μl/min again. The decrease in pH at the cell traps occurred ∼15 s later.
pH-Dependent fluorescence of virus particles
A chip that has not been blocked with BSA was filled with 50 μl vaccinia virus MVs in 1 mM TRIS, pH 9.0 (108 pfu/ml). MVs were allowed to bind to the glass for 1 h at room temperature. Binding was performed at pH 9.0 to prevent aggregation of virus particles. All nonbound particles were washed out with 1 mM TRIS, pH 9, which was then replaced with PBS at pH 7.4. A flow of 20 μl/min or no flow (when the buffer in the reservoir was exchanged) was used in these experiments. Fluorescence of EGFP-A4 in the virus core was subsequently measured during the change of buffer from PBS to 90 mM MES in PBS (pH 5.0), and vice versa.
Results
Bulk fusion experiments
To measure bulk and single-particle fusion of VACV MVs with cellular membranes, we labeled MV membranes with self-quenching quantities of R18. We used VACV strain WR EGFP-A4, which encodes the bona fide core protein A4 (also known as p39, A4L, A5, or A5L) as an EGFP fusion protein (23,24). EGFP-A4 is incorporated into virus cores and allows the visualization of both MVs and released cores after fusion (25). We obtained virus stocks with titers in the order of magnitude of unlabeled MVs, indicating that infectivity was not impaired. To test whether R18 in virus membranes was self-quenched, we measured the fluorescence spectra of virions in the absence and presence of 1% Triton X-100 (Fig. 2 a). At the emission maximum, R18 fluorescence in the presence of detergent was ∼20-fold higher than in its absence, confirming that R18 in the MV membrane was quenched.
Figure 2.

Bulk fusion experiments. (a) Emission spectra of R18-labeled VACV WR EGFP-A4 in PBS in the absence and presence (black and red lines, respectively) of 1% Triton X-100. (b) pH dependence of fusion. R18-labeled WR EGFP-A4 MVs were bound to HeLa S3 cells in the cold and added to warm PBS at t = 0 min. The pH was lowered to the indicated pH by addition of different concentrations of MES buffer at t = 1 min and R18 fluorescence followed over time. virus membranes were solubilized and R18 completely dequenched by the addition of Triton X-100 (1% final) at t = 11 min. (c) Fusion of MVs neutralized with antibody 7D11. Experimental setup is as in b, except that R18-labeled WR EGFP A4 MVs were incubated for 1 h at 37°C in the absence and presence of 100 μg/ml 7D11 before binding.
To date, bulk fusion of R18-labeled VACV MVs has mostly been measured in cells kept at physiological pH, where fusion was presumed to occur after endocytic uptake (25,26). Acid-induced fusion has been investigated indirectly by quantifying polykaryon formation, i.e., cell-cell fusion (16,27). During polykaryon formation, acid-induced fusion of virus particles with the plasma membrane is thought to deposit viral fusion proteins in the plasma membrane, which can subsequently mediate fusion of the infected cell with neighboring cells. In some cases, R18 dequenching or infection at physiological pH was measured after a short low-pH treatment of MVs bound to the plasma membrane (14,26). To measure acid-induced bulk fusion directly, and to determine the optimal pH for VACV MV fusion, we first measured acid-induced bulk fusion of R18-labeled MVs to HeLa S3 suspension cells in a fluorescence spectrophotometer (Fig. 2 b). Of the physiological pH values tested, pH 5.0 resulted in the optimal, i.e., fastest and most complete, fusion and was chosen for further fusion experiments. More than 30% of all virions fused within 10 min after acidification. In the measured time, no or only minor amounts of fusion were detected at pH 7.4.
To test whether R18 dequenching was indeed the consequence of a genuine fusion event, we analyzed fusion of MVs pretreated with the neutralizing anti-L1 antibody 7D11, which has been described as inhibiting virus fusion (25). We found that R18 fluorescence of 7D11-pretreated MVs did not increase over time when treated at pH 5.0 (Fig. 2 c). This indicated that R18 dequenching required fusion and was not caused by the applied low-pH or nonfusogenic dye transfer.
Detection of single-particle fusion
To visualize and record single-virus fusion events, we employed a microfluidic device in which single HeLa S3 cells with bound R18-labeled MVs were trapped (Fig. 1). Fluorescent virions could be followed on the microscope over time and—more important—during fusion with the plasma membrane induced by rapid exchange to a pH 5.0 buffer (within one frame). HeLa S3 suspension cells with bound VACV MVs were loaded into the microfluidic device. The trapped cells were imaged by TIRF microscopy with an evanescent field of ∼250 nm. Hence, only virions directly in contact with the cell membrane and in close proximity to the glass were excited. In a typical experiment, we recorded three to four cells with approximately one to five detectable virions (Fig. 3). Virions were only considered if fluorescence could be clearly detected in both channels (R18 and EGFP) before the pH decrease. Single virus particles and their fluorescence were tracked throughout the experiment using the fluorescence of the virus core protein EGFP-A4, since R18 was redistributed into the plasma membrane during acid-induced fusion.
Figure 3.

Images from a typical microfluidic experiment. R18-labeled WR EGFP-A4 MVs were bound to HeLa S3 cells in the cold. Cells were subsequently trapped in a microfluidic chamber and detected with TIRF microscopy at 37°C. At t = 26 s, PBS was replaced with MES/PBS (pH 5.0). The left column shows a complete field of view (both channels merged). At time zero, single virions could be easily identified due to the colocalization of the R18 and EGFP signals; cells are marked with dashed circles. The other columns represent magnifications of the cell highlighted with the bold circle. The middle column shows the fluorescence of EGFP-A4, and the right column shows the corresponding R18 signal. Arrows mark two typical virus particles undergoing fusion. When the pH was decreased, an immediate decrease of the EGFP fluorescence in the cores, as well as of the pH sensor signal, was observed. After a few seconds (t = 107 s), the signal at the membrane increased significantly due to hemifusion and dye dequenching. At the end of the experiment (t = 339 s), the fluorescence in the core is partly recovered in some of the virions, whereas R18 was distributed throughout the plasma membrane.
Acquisition was started immediately after changing the buffer in the fluid reservoir of the microfluidic device from pH 7.4 to pH 5.0, and it continued for ∼5 min. The pH 5.0 buffer arrived in the field of view ∼15 s after buffer exchange. After the decrease in pH, the fluorescence intensity of the BSA-FITC microspots and the core EGFP-A4 dropped immediately. At the time resolution used (3–4 s), we could not observe any lag time between the changes of fluorescence intensity of the directly accessible BSA-FITC and the membrane-surrounded EGFP-A4 within the virus core. This observation will be discussed in more detail later. After a lag phase, the loss of fluorescence intensity in the green channel was followed by a gradual increase in R18 fluorescence in virus particles. The increase in R18 fluorescence was caused by dilution of the dye into the plasma membrane. Although an increase in R18 fluorescence does not strictly rule out the simultaneous merger of both leaflets of the membrane bilayers, it is generally accepted that virus fusion involves a hemifusion intermediate, which is sufficient for R18 dequenching (28). The fact that the VACV MV membrane protein L1 is required for acid-induced syncytia formation (fusion from within) (29), but not for R18 dequenching in the course of a normal infection (26), supports a two-step model of VACV fusion. We therefore refer to R18 dequenching in the case of VACV as a readout for hemifusion. No R18 dequenching was observed when the trapped cells with bound virions were kept at pH 7.4 (Fig. S3).
Hemifusion and dequenching rate for individual virus particles
To analyze single fusion events, we plotted the R18 fluorescence of individual tracked virions over time (Fig. 4 a). We calculated the fluorescence increase for each single particle and only considered those particles that at least doubled in fluorescence (increase >100%; 33 of 177 tracked particles). We next extracted the lag phases between the pH shift and the onset of R18 dequenching, i.e., hemifusion (Fig. 4 b). This uncovered an unexpected heterogeneity in the lag phases that was not detected in the bulk fusion experiments, in which no clear lag phases were observed. Although hemifusion started in most virions between 8 and 24 s after the pH drop, lag phases ranged from a few seconds up to 77 s after pH shift.
Figure 4.
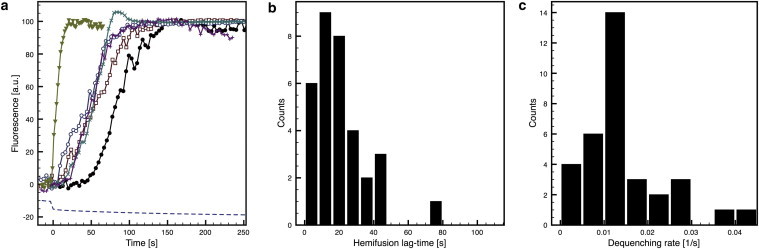
R18 dequenching of single virus particles. (a) Normalized R18 fluorescence traces of single vaccinia virions obtained with the experimental setup described in Fig. 3. The dashed line is the fluorescence of microcontact-printed BSA-FITC and thus corresponds to the pH. The time of the pH drop was set as t = 0 s. (b and c) Lag-time distribution (b) and dequenching rate (c) of all measured virus particles (n = 33).
When acid-induced fusion of R18-labeled IAV X31 with HeLa S3 cells was visualized as a control in our microfluidic setup (Fig. S4), clear lag phases before hemifusion were also observed.
The rate of R18 dequenching during VACV fusion was homogeneous (Fig. 4 c), but much slower than typically observed after fusion of single virus particles with SLBs (10,30). R18 fluorescence increased for ∼1 min during MV fusion before reaching a plateau, and IAV fusion occurred with similar kinetics. The dequenching rate is expected to depend mainly on the diffusion of R18 dye into the cell membrane, and therefore, R18 dequenching likely follows similar kinetics for all virus particles. Dissipation of R18 fluorescence was sporadically observed at later times (>200 s), although R18 fluorescence from fusion events outside the illuminated region obscured the fluorescence of single virions in most cases.
Neither hemifusion lag phases nor the rate of R18 dequenching correlated with the detected R18 fluorescence intensity before fusion (Fig. S5). Lag-phase duration and R18 dequenching rates also did not correlate (Fig. S5), suggesting that the measured properties were not influenced by the amount of R18 incorporated into virus membranes. Due to the stringent conditions used to select fusion events to be analyzed, the percentage of MVs undergoing fusion was not quantified. The applied conditions were, however, identical to those used in bulk fusion experiments.
Acidification of EGFP-containing cores
In all of our experiments, we observed that the EGFP fluorescence inside the core quickly decreased after the pH in the microfluidic device was lowered (Fig. 5 a). This decrease was followed by an increase of R18 fluorescence, i.e., hemifusion. In some instances, EGFP fluorescence recovered (see also Fig. 5, b and c).
Figure 5.

EGFP recovery after fusion-pore opening. (a) Time series of two virions fusing with the plasma membrane, obtained with the experimental setup described in Fig. 3. The EGFP-A4 signal (upper row) quickly decreased after the pH drop at time zero, but began to recover after ∼100 s. The R18 signal (lower row) augmented during hemifusion, reached a maximum at 120 s, and decreased again later, presumably because the dye was diluted into the plasma membrane. Virus particles moved laterally with the cells, suggesting that they were not bound to the surface of the chip. (b) Normalized fluorescence traces (R18, open symbols; EGFP, solid symbols) of the virus particles in a. (c) Representative normalized fluorescence curves of EGFP-A4 fluorescence after pH decrease. Fluorescence recovered in some virions, whereas it remained quenched in others. Dashed lines in both graphs represent the fluorescence of the pH sensor BSA-FITC and indicate when the pH was lowered.
The GFP variant used, EGFP, is pH-sensitive, with an apparent pK′a of 6.15, and the loss in fluorescence intensity at acidic pH is reversible down to a pH of 5.0 (31). The reduced fluorescence intensity of EGFP-A4 after the pH drop can thus be correlated to a reduced pH in the virus core. Nevertheless, the observed EGFP quenching in the core was surprising because the lipid bilayer surrounding the virus core was expected to be highly impermeable to protons.
As R18 fluorescence did not decrease upon the pH drop, and the EGFP fluorescence dropped in every core observed, we could exclude that loss of EGFP fluorescence was due to movement of the virus particle out of the focal plane. We therefore hypothesize that the VACV MV membrane contains proton channels that transmit protons into the virus interior along a concentration gradient.
pH-Dependent EGFP fluorescence of immobilized MVs
To further investigate core acidification, we designed an additional experiment to measure the pH-dependent fluorescence of many virus particles simultaneously. We used the same microfluidic device, but did not block the surfaces with BSA. WR EGFP-A4 MVs were then introduced into the device and incubated at room temperature to allow binding to the glass bottom through electrostatic interactions. Binding and acquisition of many virus particles in one focal plane provided several advantages: no MVs could leave the focal plane due to cell movement, and buffers could be exchanged more rapidly and multiple times without the risk of losing trapped cells. Since no R18 fluorescence was recorded, EGFP fluorescence could be acquired at a higher frame rate (2 s). Fig. S6 shows a typical experiment performed with ∼100 virus particles. As before, BSA-FITC was used as a pH sensor in the microfluidic device. We observed that the pH drop in the channel coincided with a strong decrease in EGFP-A4 fluorescence in MVs. Since this phenomenon was observed in all virus particles, it is highly unlikely that virions are proton-permeable due to defects in the membrane. When the pH in the same microfluidic device was changed back to pH 7.4, EGFP fluorescence increased rapidly. This indicates that the low-pH quenching of EGFP is reversible, and that protons can presumably cross the virus membrane in both directions.
Although virus-encoded proton channels are diverse and no general proton-channel inhibitor exists (32), two unrelated viral ion channels, the IAV proton channel M2, and the hepatitis C virus cation channel p7, are sensitive to amantadine (33,34). When WR EGFP-A4 MVs were pretreated and kept in amantadine or the related compound rimantadine, we observed that the EGFP-A4 fluorescence was still quenched at low pH (Fig. S7), indicating that proton influx into VACV MVs was insensitive to adamantane-based inhibitors.
Recovery of EGFP-A4 fluorescence in single virions after fusion
When EGFP-A4 containing cores were followed over time in single-virus fusion experiments, we repeatedly observed that EGFP fluorescence recovered with some delay after hemifusion. On average, EGFP recovery started after 121 s and reached 36% of the fluorescence intensity before the pH drop (n = 8). Since R18 fluorescence was recorded at the same time and did not exhibit equivalent changes, we can rule out that the increase in EGFP fluorescence occurred due to the movement of virus particles into the focal plane. As acid-quenching of EGFP was shown to be reversible, it is likely that EGFP recovery occurred when the pH within the virus core returned to a physiological level. This is expected to happen when virus cores gain access to the host-cell cytosol after fusion-pore formation. Due to their membrane potential and the energy-dependent transfer of protons against the concentration gradient, cells can presumably sustain a physiological pH despite their acidic surrounding. The cellular cytosol, with a volume that is multiple orders of magnitude larger than that of the virus, may buffer the acidic pH in the virus interior. Thus, recovery of EGFP fluorescence would indicate successful fusion-pore formation. However, since recovery of EGFP-A4 fluorescence was comparatively slow, we cannot rule out that neutralization of the virus core is somewhat delayed. This may be due to the ongoing activity of viral proton channels. Alternatively, the hemifusion intermediate during VACV MV fusion may be exceptionally stable.
Recovery of EGFP-A4 fluorescence after fusion in bulk
Based on our observations in single-particle experiments, EGFP quenching and recovery should also be detectable in bulk fusion experiments. Furthermore, EGFP recovery would only be expected to occur when fusion takes place. To test this, we used R18-labeled WR EGFP-A4 MVs for bulk fusion experiments in a fluorescence spectrophotometer in which both R18 and EGFP fluorescence of bound virions could be detected (Fig. 6). As in single-virus fusion experiments, bulk EGFP-A4 fluorescence intensity immediately dropped when the pH was lowered to 5.0; R18 dequenching, and thus hemifusion formation, directly followed acidification. As seen in the single-virus experiments, EGFP fluorescence recovered with time after hemifusion, reaching ∼20% of its intensity before low-pH treatment. This is in line with our single-virus fusion experiments, in which EGFP fluorescence was recovered in only a fraction of the observed MVs. When MVs were pretreated with the neutralizing antibody 7D11 before binding, EGFP-A4 fluorescence decreased upon low-pH treatment as in the untreated controls; however, neither R18 dequenching nor EGFP recovery could be observed in the sample. This confirms that 7D11 blocks hemifusion, and that EGFP recovery only occurs after hemifusion formation. This suggests that EGFP recovery is most likely a consequence of fusion-pore formation.
Figure 6.
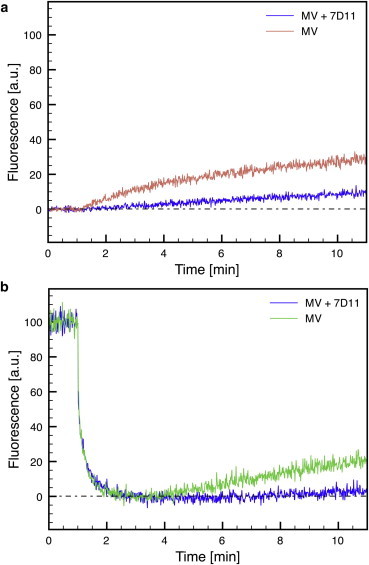
Bulk fusion experiments. R18-labeled WR EGFP-A4 MVs were incubated for 1 h at 37°C in the absence and presence of 100 μg/ml 7D11 and bound to HeLa S3 cells in the cold. The cell-virus suspension was added to warm PBS at t = 0 min and R18 (a) and EGFP (b) fluorescence was measured. The pH was lowered to pH 5.0 by addition of MES buffer at t = 1 min and fluorescence was recorded for 10 min.
Taken together, our data suggest a model in which EGFP fluorescence in the core is quenched by pH 5 buffers because the virus interior is acidified (Fig. 7). EGFP fluorescence recovers over time, presumably after fusion-pore formation and content mixing with the host-cell cytosol.
Figure 7.
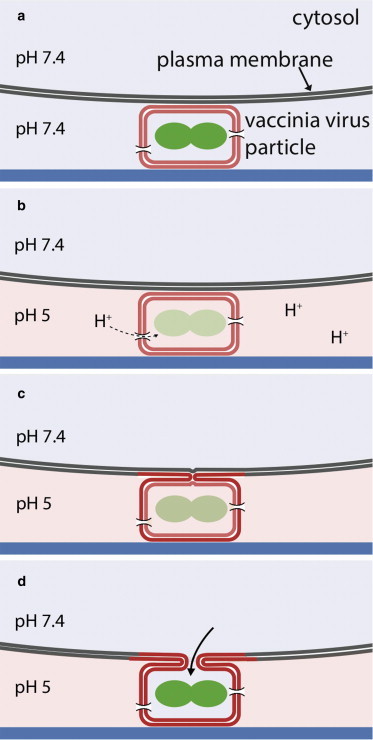
Model of acid-induced fusion of VACV MV with the plasma membrane. (a) VACV MVs are bound to the cell at physiological pH. (b) When the buffer is exchanged to pH 5, protons enter the virus particle, presumably through proton channels, and quench EGFP fluorescence. (c) After a lag time, hemifusion occurs, which is monitored by R18 dequenching. (d) After complete fusion (fusion-pore opening), the interior of the virus is buffered by the cell cytosol, leading to the recovery of EGFP fluorescence.
Discussion
We established an experimental setup to visualize single, acid-induced VACV fusion events at the plasma membrane. This permits the quantification of single-virus fusion kinetics and couples the measurement of hemifusion to microscopic observation of virus or cell components, exemplified in this study by a fluorescent virus core protein.
In contrast to similar setups described previously (10), fusion was analyzed with biological membranes rather than with nonphysiological lipid mixtures. This allows fusion studies under physiological conditions and is particularly helpful for analysis of virus fusion events for which the binding and fusion requirements are unknown. Furthermore, the fusion analyzed was directly coupled to a genuine infection, which we could verify using a virus strain expressing EGFP under the control of a viral promoter (Fig. S8).
In this study, we used VACV MVs as an example of a complex enveloped virus for which the fusion step is poorly characterized. Previously, information on single-virus fusion events was not available. Fusion in general had only been studied in bulk experiments under conditions in which fusion occured asynchronously without distinguishing between fusion in endocytic vesicles and fusion at the plasma membrane (25,26). Although it is possible that different triggers induce MV fusion, it is widely accepted that cell-bound MVs of strain WR can be artificially fused with the plasma membrane by low-pH treatment. Using artificially triggered fusion, it is ensured that all detected virus particles receive the signal for fusion at the same time. Observed heterogeneities in fusion under control or perturbed conditions can therefore directly be attributed to the fusion process itself. Using both bulk and single fusion experiments, we confirmed acid-induced fusion of WR MVs. Single fusion experiments allowed us to extend the information on MV fusion by revealing variable lag time between acidification and hemifusion, R18 dequenching rates, and the timing of fusion-pore formation.
Lag phases between acidification and R18 dequenching have been repeatedly observed in bulk acid-mediated fusion experiments using different viruses, such as IAV, VSV, or Semliki Forest virus (35–37). In many cases, however, lag phases at optimal fusion conditions were short and could only be accurately observed using specifically designed stopped-flow experiments or by slowing hemifusion using nonphysiological temperatures or suboptimal pH. The lag phase was interpreted as the time needed for changes in the quaternary structure and conformation of the fusion proteins to allow for fusion (38).
Our single VACV and IAV fusion experiments revealed that substantial lag times occurred under optimal fusion conditions. Similar lag times had been measured when octadecyl-rhodamine-110-labeled IAV particles were bound to SLBs and acid-induced fusion events of single virions were observed at 23°C (10). Bulk fusion kinetics obscured this heterogeneity and the observed lag phases in such experiments only represented the time it took the first virions to undergo hemifusion. The length and heterogeneity of the lag phases before VACV fusion may reflect the complexity of the fusion process, which may involve up to 11 viral components of the entry/fusion complex (EFC) as well as two proteins that presumably inhibit fusion until they dissociate from the EFC at acidic pH (5,39). Interestingly, when Semliki Forest virus or IAV particles were only brought in contact with SLBs after acidification for ∼1 s, the observed lag phases between acidification and hemifusion were <1 s (30). It is therefore possible that the interaction with attachment factors in the host membrane, and perhaps their dissociation, contributes to lag phases.
Although R18 dequenching occurred rapidly (<1 s) in all single-virus fusion experiments with artificial membranes (10,30,40), R18 dequenching during hemifusion of VACV and IAV with the plasma membrane was slow. Fusion of IAV to red blood cells (41), as well as fusion of IAV, dengue virus, and retrovirus particles with endosomal membranes (42–44), followed kinetics similar to that observed for the plasma-membrane fusion of VACV and IAV described here. Our data suggest that diffusion of R18 into biological membranes differs greatly from diffusion into simple artificial bilayers. Single-virus fusion kinetics with biological membranes therefore reveals valuable information on the kinetics of lipid mixing during physiological fusion events. Interestingly, electron micrographs of WR wild-type MVs fusing with the plasma membrane showed that in many cases, the more electron-dense virus membrane did not readily flatten into the plasma membrane, but rather remained as a distinct entity (26,45). These electron micrographs may exemplify the slower lipid mixing (and thus R18 dequenching) after fusion with biological membranes.
Using the additional information obtained by observing fusion microscopically, we found that virus cores were acidified by the surrounding buffers and neutralized with some delay after hemifusion. Relying on the acid-labile fluorescence of the core protein EGFP-A4, the respective changes in EGFP fluorescence could be confirmed in bulk fusion experiments. Low-pH-mediated quenching of palmitoylated yellow fluorescent protein (YFP) in the interior of avian sarcoma and leukosis virus (ASLV) has also been observed in acid-induced fusion experiments (46). However, a drop of YFP fluorescence was only observed in a fraction of the particles, implicating membrane defects as the most likely explanation. In that study, recovery of YFP fluorescence after fusion of ASLV was also used as a readout for content mixing and fusion-pore formation. In our experiments, EGFP fluorescence dropped in every core, suggesting that the observed proton permeability of the virus membranes is a general property of VACV MVs.
In our study, single fusion experiments acted as a discovery tool that inspired bulk experiments that would not otherwise have been performed. We postulate that proton channels in the MV membrane allow the transport of protons into the viral interior, and that the pH is reelevated after fusion-pore formation (Fig. 7). In this case, EGFP-A4 fluorescence could be used as a marker for both core acidification and content mixing.
The postulated proton channel in the virus membrane would also transmit protons into the virus interior during acidification of MV-containing endocytic vesicles, where acidification may prepare the virus core for activation or uncoating. Interestingly, it was previously observed work that VACV entry involves two pH-dependent steps, and that pretreatment of MVs with low pH enhances infection independent of fusion (47). Further experiments are necessary to confirm the existence and identity of the postulated proton channels in the VACV MV membrane. Since proton channels or viral ion channels cannot be identified based on sequence, identification of the postulated viral proton channel would likely require a candidate approach. This may involve the generation of individual conditional knockout strains of the known MV membrane proteins (∼25) (48) combined with measurement of EGFP-A4 fluorescence after acidification. An alternative would be the heterologous expression of candidate genes in cells combined with methods to directly measure ion fluxes.
Virus-encoded ion channels (viroporins), such as IAV M2, hepatitis C virus p7, HIV-1 Vpu, or poliovirus p2, have been shown to be crucial for viral pathogenicity (32). They modulate ion fluxes in modified cellular organelles or in the virus particles themselves and are involved in diverse steps of the viral life cycle, thus constituting an obvious target for antiviral therapeutics. Poxviruses drastically modulate the host-cell cytosol in multiple ways. It therefore does not seem surprising that poxviruses have evolved proteins to control proton concentrations in the virus and, perhaps, in infected cells. The identification of poxvirus-encoded proton channels would not only contribute to the understanding of the poxvirus life cycle, but may also stimulate the development of drugs inhibiting poxvirus infection.
EGFP-A4 fluorescence as a genetically encoded marker for core pH could in principle be exploited to study the regulation and rates of proton influx in detail. Similar studies with fluorescein-loaded IAV particles allowed the determination of exact proton flux rates and a detailed characterization of IAV M2 in the context of the virus (49).
Using microfluidics and TIRF microscopy in combination with fluorescent virus particles, we visualized several important steps before and during VACV MV fusion: acidification of virus cores, hemifusion, and content mixing. Similar approaches may therefore be helpful to investigate the VACV MV fusion process more thoroughly and, of more importance, to distinguish which perturbations directly affect fusion rather than, e.g., endocytosis. It was shown in a recent study that most of the EFC components and associated proteins are required for hemifusion, whereas the absence of A28, L1, or L5 only affects later steps, such as early gene expression or the localization of cores in the cytosol (26). An experimental setup with a genuine content-mixing marker may help to elucidate the exact role of these proteins. Our system could furthermore help to solve the ongoing controversy regarding the fusion inhibitory dimer A25/A26 in the context of pH-dependent or pH-independent fusion of MVs of VACV strains WR and IHD-J, respectively (39,50).
The experimental setup described in this study can theoretically be applied to study fusion of any enveloped virus for which fusion with the plasma membrane occurs naturally or can be triggered artificially. The microfluidic device could be adapted to more advanced fusion experiments, where, e.g., the pH drop is more rapidly initiated under no-flow conditions using caged protons (40), or where pH gradients are applied. Since the described system allows experiments with living cells, the effect of cellular factors on fusion can also be investigated. For example, it was recently proposed that antiviral proteins of the IFITM family prevent virus hemifusion by reducing the fluidity of cellular membranes (51). However, in this study, syncytia formation was used as the only readout for fusion. The molecular details of this antiviral defense mechanism could be elaborated by directly visualizing hemifusion using microfluidics-based single-virus fusion experiments.
Conclusion
We have set up a platform that allows for microscopy-based observation and quantification of single-virus fusion events at the plasma membrane. As shown for VACV MVs, microscopic analysis of hemifusion can be combined with the detection of other fluorescent signals, e.g., content markers. This approach has already led to the novel finding that VACV MV membranes are proton-permeable, presumably due to a yet unidentified proton channel. In general, the fairly simple and robust microfluidic method established here is useful for a broad range of applications in the field of cell biology and biophysics, where immobilization of single cells and fast solution exchange are required for kinetic and mechanistic investigations. In addition to studies on virus-cell fusion, applications may include vesicle-cell fusion, the penetration of cells with particles or molecules, or endocytosis.
Acknowledgments
We thank Ari Helenius (ETH Zurich) for helpful discussions, and Yohei Yamauchi and Sarah Stauffer (ETH Zurich) for help with influenza A virus labeling. The use of the light microscopy centre (LMC, ETH Zurich) and the clean room facility FIRST (ETH Zurich) is gratefully acknowledged.
This work was funded by the European Research Council (ERC Starting Grant No. 203428, nμLIPIDS awarded to P.S.D., ERC Advanced Investigator Grant No. 232974 awarded to Ari Helenius) and an Swiss National Science Foundation Ambizione grant (PZ00P3_131988) awarded to J.M.
Contributor Information
Jason Mercer, Email: jason.mercer@bc.biol.ethz.ch.
Petra S. Dittrich, Email: dittrich@org.chem.ethz.ch.
Supporting Material
References
- 1.Marsh M., Helenius A. Virus entry: open sesame. Cell. 2006;124:729–740. doi: 10.1016/j.cell.2006.02.007. [DOI] [PMC free article] [PubMed] [Google Scholar]
- 2.Harrison S.C. Viral membrane fusion. Nat. Struct. Mol. Biol. 2008;15:690–698. doi: 10.1038/nsmb.1456. [DOI] [PMC free article] [PubMed] [Google Scholar]
- 3.Campadelli-Fiume G., Menotti L., Gianni T. Viral and cellular contributions to herpes simplex virus entry into the cell. Curr. Opin. Virol. 2012;2:28–36. doi: 10.1016/j.coviro.2011.12.001. [DOI] [PubMed] [Google Scholar]
- 4.Schmidt F.I., Bleck C.K., Mercer J. Poxvirus host cell entry. Curr. Opin. Virol. 2012;2:20–27. doi: 10.1016/j.coviro.2011.11.007. [DOI] [PubMed] [Google Scholar]
- 5.Moss B. Poxvirus cell entry: how many proteins does it take? Viruses. 2012;4:688–707. doi: 10.3390/v4050688. [DOI] [PMC free article] [PubMed] [Google Scholar]
- 6.Wild C.T., Shugars D.C., Matthews T.J. Peptides corresponding to a predictive α-helical domain of human immunodeficiency virus type 1 gp41 are potent inhibitors of virus infection. Proc. Natl. Acad. Sci. USA. 1994;91:9770–9774. doi: 10.1073/pnas.91.21.9770. [DOI] [PMC free article] [PubMed] [Google Scholar]
- 7.Chernomordik L.V., Kozlov M.M. Mechanics of membrane fusion. Nat. Struct. Mol. Biol. 2008;15:675–683. doi: 10.1038/nsmb.1455. [DOI] [PMC free article] [PubMed] [Google Scholar]
- 8.Collins R.N., Holz R.W., Zimmerberg J. The biophysics of membrane fusion. In: Edward Egelman, editor. Volume 5. Elsevier; Amsterdam: 2012. pp. 273–289. (Comprehensive Biophysics). [Google Scholar]
- 9.Blumenthal R., Gallo S.A., Puri A. Fluorescent lipid probes in the study of viral membrane fusion. Chem. Phys. Lipids. 2002;116:39–55. doi: 10.1016/s0009-3084(02)00019-1. [DOI] [PubMed] [Google Scholar]
- 10.Floyd D.L., Ragains J.R., van Oijen A.M. Single-particle kinetics of influenza virus membrane fusion. Proc. Natl. Acad. Sci. USA. 2008;105:15382–15387. doi: 10.1073/pnas.0807771105. [DOI] [PMC free article] [PubMed] [Google Scholar]
- 11.Karatekin E., Di Giovanni J., Rothman J.E. A fast, single-vesicle fusion assay mimics physiological SNARE requirements. Proc. Natl. Acad. Sci. USA. 2010;107:3517–3521. doi: 10.1073/pnas.0914723107. [DOI] [PMC free article] [PubMed] [Google Scholar]
- 12.Sundh M., Svedhem S., Sutherland D.S. Influence of phase separating lipids on supported lipid bilayer formation at SiO2 surfaces. Phys. Chem. Chem. Phys. 2010;12:453–460. doi: 10.1039/b912598a. [DOI] [PubMed] [Google Scholar]
- 13.Damon I.K. Poxviruses. In: Knipe D.M., Howley P.M., editors. Field’s Virology. Lippincott-Raven; Philadelphia: 2007. pp. 2947–2975. [Google Scholar]
- 14.Townsley A.C., Weisberg A.S., Moss B. Vaccinia virus entry into cells via a low-pH-dependent endosomal pathway. J. Virol. 2006;80:8899–8908. doi: 10.1128/JVI.01053-06. [DOI] [PMC free article] [PubMed] [Google Scholar]
- 15.Mercer J., Helenius A. Vaccinia virus uses macropinocytosis and apoptotic mimicry to enter host cells. Science. 2008;320:531–535. doi: 10.1126/science.1155164. [DOI] [PubMed] [Google Scholar]
- 16.Gong S.C., Lai C.F., Esteban M. Vaccinia virus induces cell fusion at acid pH and this activity is mediated by the N-terminus of the 14-kDa virus envelope protein. Virology. 1990;178:81–91. doi: 10.1016/0042-6822(90)90381-z. [DOI] [PubMed] [Google Scholar]
- 17.Johannsdottir H.K., Mancini R., Helenius A. Host cell factors and functions involved in vesicular stomatitis virus entry. J. Virol. 2009;83:440–453. doi: 10.1128/JVI.01864-08. [DOI] [PMC free article] [PubMed] [Google Scholar]
- 18.Di Carlo D., Wu L.Y., Lee L.P. Dynamic single cell culture array. Lab Chip. 2006;6:1445–1449. doi: 10.1039/b605937f. [DOI] [PubMed] [Google Scholar]
- 19.Eyer K., Kuhn P., Dittrich P.S. A microchamber array for single cell isolation and analysis of intracellular biomolecules. Lab Chip. 2012;12:765–772. doi: 10.1039/c2lc20876h. [DOI] [PubMed] [Google Scholar]
- 20.Walling M.A., Shepard J.R. Cellular heterogeneity and live cell arrays. Chem. Soc. Rev. 2011;40:4049–4076. doi: 10.1039/c0cs00212g. [DOI] [PubMed] [Google Scholar]
- 21.Spiller D.G., Wood C.D., White M.R. Measurement of single-cell dynamics. Nature. 2010;465:736–745. doi: 10.1038/nature09232. [DOI] [PubMed] [Google Scholar]
- 22.Stiefel P., Schmidt F.I., Mercer J. Cooperative vaccinia infection demonstrated at the single-cell level using FluidFM. Nano Lett. 2012;12:4219–4227. doi: 10.1021/nl3018109. [DOI] [PubMed] [Google Scholar]
- 23.Cudmore S., Blasco R., Krijnse Locker J. A vaccinia virus core protein, p39, is membrane associated. J. Virol. 1996;70:6909–6921. doi: 10.1128/jvi.70.10.6909-6921.1996. [DOI] [PMC free article] [PubMed] [Google Scholar]
- 24.Carter G.C., Rodger G., Smith G.L. Vaccinia virus cores are transported on microtubules. J. Gen. Virol. 2003;84:2443–2458. doi: 10.1099/vir.0.19271-0. [DOI] [PubMed] [Google Scholar]
- 25.Doms R.W., Blumenthal R., Moss B. Fusion of intra- and extracellular forms of vaccinia virus with the cell membrane. J. Virol. 1990;64:4884–4892. doi: 10.1128/jvi.64.10.4884-4892.1990. [DOI] [PMC free article] [PubMed] [Google Scholar]
- 26.Laliberte J.P., Weisberg A.S., Moss B. The membrane fusion step of vaccinia virus entry is cooperatively mediated by multiple viral proteins and host cell components. PLoS Pathog. 2011;7:e1002446. doi: 10.1371/journal.ppat.1002446. [DOI] [PMC free article] [PubMed] [Google Scholar]
- 27.Mercer J., Knébel S., Helenius A. Vaccinia virus strains use distinct forms of macropinocytosis for host-cell entry. Proc. Natl. Acad. Sci. USA. 2010;107:9346–9351. doi: 10.1073/pnas.1004618107. [DOI] [PMC free article] [PubMed] [Google Scholar]
- 28.Chernomordik L.V., Kozlov M.M. Membrane hemifusion: crossing a chasm in two leaps. Cell. 2005;123:375–382. doi: 10.1016/j.cell.2005.10.015. [DOI] [PubMed] [Google Scholar]
- 29.Bisht H., Weisberg A.S., Moss B. Vaccinia virus l1 protein is required for cell entry and membrane fusion. J. Virol. 2008;82:8687–8694. doi: 10.1128/JVI.00852-08. [DOI] [PMC free article] [PubMed] [Google Scholar]
- 30.Wessels L., Elting M.W., Weninger K. Rapid membrane fusion of individual virus particles with supported lipid bilayers. Biophys. J. 2007;93:526–538. doi: 10.1529/biophysj.106.097485. [DOI] [PMC free article] [PubMed] [Google Scholar]
- 31.Llopis J., McCaffery J.M., Tsien R.Y. Measurement of cytosolic, mitochondrial, and Golgi pH in single living cells with green fluorescent proteins. Proc. Natl. Acad. Sci. USA. 1998;95:6803–6808. doi: 10.1073/pnas.95.12.6803. [DOI] [PMC free article] [PubMed] [Google Scholar]
- 32.Nieva J.L., Madan V., Carrasco L. Viroporins: structure and biological functions. Nat. Rev. Microbiol. 2012;10:563–574. doi: 10.1038/nrmicro2820. [DOI] [PMC free article] [PubMed] [Google Scholar]
- 33.Kendal A.P., Klenk H.D. Amantadine inhibits an early, M2 protein-dependent event in the replication cycle of avian influenza (H7) viruses. Arch. Virol. 1991;119:265–273. doi: 10.1007/BF01310675. [DOI] [PubMed] [Google Scholar]
- 34.Griffin S.D., Beales L.P., Rowlands D.J. The p7 protein of hepatitis C virus forms an ion channel that is blocked by the antiviral drug. Amantadine. FEBS Lett. 2003;535:34–38. doi: 10.1016/s0014-5793(02)03851-6. [DOI] [PubMed] [Google Scholar]
- 35.Stegmann T., White J.M., Helenius A. Intermediates in influenza induced membrane fusion. EMBO J. 1990;9:4231–4241. doi: 10.1002/j.1460-2075.1990.tb07871.x. [DOI] [PMC free article] [PubMed] [Google Scholar]
- 36.Clague M.J., Schoch C., Blumenthal R. Gating kinetics of pH-activated membrane fusion of vesicular stomatitis virus with cells: stopped-flow measurements by dequenching of octadecylrhodamine fluorescence. Biochemistry. 1990;29:1303–1308. doi: 10.1021/bi00457a028. [DOI] [PubMed] [Google Scholar]
- 37.Bron R., Wahlberg J.M., Wilschut J. Membrane fusion of Semliki Forest virus in a model system: correlation between fusion kinetics and structural changes in the envelope glycoprotein. EMBO J. 1993;12:693–701. doi: 10.1002/j.1460-2075.1993.tb05703.x. [DOI] [PMC free article] [PubMed] [Google Scholar]
- 38.Hughson F.M. Structural characterization of viral fusion proteins. Curr. Biol. 1995;5:265–274. doi: 10.1016/s0960-9822(95)00057-1. [DOI] [PubMed] [Google Scholar]
- 39.Chang S.J., Chang Y.X., Chang W. Vaccinia virus A25 and A26 proteins are fusion suppressors for mature virions and determine strain-specific virus entry pathways into HeLa, CHO-K1, and L cells. J. Virol. 2010;84:8422–8432. doi: 10.1128/JVI.00599-10. [DOI] [PMC free article] [PubMed] [Google Scholar]
- 40.Costello D.A., Lee D.W., Daniel S. Influenza virus-membrane fusion triggered by proton uncaging for single particle studies of fusion kinetics. Anal. Chem. 2012;84:8480–8489. doi: 10.1021/ac3006473. [DOI] [PMC free article] [PubMed] [Google Scholar]
- 41.Lowy R.J., Sarkar D.P., Blumenthal R. Observation of single influenza virus-cell fusion and measurement by fluorescence video microscopy. Proc. Natl. Acad. Sci. USA. 1990;87:1850–1854. doi: 10.1073/pnas.87.5.1850. [DOI] [PMC free article] [PubMed] [Google Scholar]
- 42.Lakadamyali M., Rust M.J., Zhuang X. Visualizing infection of individual influenza viruses. Proc. Natl. Acad. Sci. USA. 2003;100:9280–9285. doi: 10.1073/pnas.0832269100. [DOI] [PMC free article] [PubMed] [Google Scholar]
- 43.van der Schaar H.M., Rust M.J., Smit J.M. Characterization of the early events in dengue virus cell entry by biochemical assays and single-virus tracking. J. Virol. 2007;81:12019–12028. doi: 10.1128/JVI.00300-07. [DOI] [PMC free article] [PubMed] [Google Scholar]
- 44.Jha N.K., Latinovic O., Melikyan G.B. Imaging single retrovirus entry through alternative receptor isoforms and intermediates of virus-endosome fusion. PLoS Pathog. 2011;7:e1001260. doi: 10.1371/journal.ppat.1001260. [DOI] [PMC free article] [PubMed] [Google Scholar]
- 45.Schmidt F.I., Bleck C.K.E., Mercer J. Vaccinia virus entry is followed by core activation andn proteasome-mediated release of the immunomodulatory effector VH1 from lateral bodies. Cell Report. 2013 doi: 10.1016/j.celrep.2013.06.028. in press. [DOI] [PubMed] [Google Scholar]
- 46.Melikyan G.B., Barnard R.J., Young J.A. Imaging individual retroviral fusion events: from hemifusion to pore formation and growth. Proc. Natl. Acad. Sci. USA. 2005;102:8728–8733. doi: 10.1073/pnas.0501864102. [DOI] [PMC free article] [PubMed] [Google Scholar]
- 47.Townsley A.C., Moss B. Two distinct low-pH steps promote entry of vaccinia virus. J. Virol. 2007;81:8613–8620. doi: 10.1128/JVI.00606-07. [DOI] [PMC free article] [PubMed] [Google Scholar]
- 48.Moss B. Poxviridae: the viruses and their replication. In: Knipe D.M., Howley P.M., editors. Field’s Virology. Lippincott-Raven; Philadelphia: 2007. pp. 2905–2946. [Google Scholar]
- 49.Ivanovic T., Rozendaal R., Harrison S.C. Kinetics of proton transport into influenza virions by the viral M2 channel. PLoS ONE. 2012;7:e31566. doi: 10.1371/journal.pone.0031566. [DOI] [PMC free article] [PubMed] [Google Scholar]
- 50.Bengali Z., Satheshkumar P.S., Moss B. Orthopoxvirus species and strain differences in cell entry. Virology. 2012;433:506–512. doi: 10.1016/j.virol.2012.08.044. [DOI] [PMC free article] [PubMed] [Google Scholar]
- 51.Li K., Markosyan R.M., Liu S.L. IFITM proteins restrict viral membrane hemifusion. PLoS Pathog. 2013;9:e1003124. doi: 10.1371/journal.ppat.1003124. [DOI] [PMC free article] [PubMed] [Google Scholar]
- 52.Bauer B., Davidson M., Orwar O. Proteomic analysis of plasma membrane vesicles. Angew. Chem. Int. Ed. Engl. 2009;48:1656–1659. doi: 10.1002/anie.200803898. [DOI] [PubMed] [Google Scholar]
Associated Data
This section collects any data citations, data availability statements, or supplementary materials included in this article.