

Abstract
Quantitative mass spectrometry methods offer near-comprehensive proteome coverage; however, these methods still suffer with regards to sample throughput. Multiplex quantitation via isobaric chemical tags (e.g., TMT and iTRAQ) provides an avenue for mass spectrometry based proteome quantitation experiments to move away from simple binary comparisons and towards greater parallelization. Herein, we demonstrate a straightforward method for immediately expanding the throughput of the TMT isobaric reagents from 6-plex to 8-plex. This method is based upon our ability to resolve the isotopic shift that results from substituting a 15N for a 13C. In an accommodation to the preferred fragmentation pathways of ETD, the TMT-127 and -129 reagents were recently modified such that a 13C was exchanged for a 15N. As a result of this substitution, the new TMT reporter ions are 6.32 mDa lighter. Even though the mass difference between these reporter ion isotopologues is incredibly small, modern high-resolution and mass accuracy analyzers can resolve these ions. Based on our ability to resolve and accurately measure the relative intensity of these isobaric reporter ions, we demonstrate that we are able to quantify across 8 samples simultaneously by combining the 13C and 15N containing reporter ions. Considering the structure of the TMT reporter ion, we believe this work serves as a blueprint for expanding the multiplexing capacity of the TMT reagents to at least 10-plex and possibly up to 18-plex.
Introduction
Mass spectrometry based proteomic assays have incredible breadth when it comes to protein identifications. In just a few days, and even hours, these instruments are capable of near-comprehensive identification of all expressed proteins.1 By comparison, the quantitative throughput of these methods is sorely lacking. Quantitative mass spectrometry methods are typically limited to low-throughput binary and ternary comparisons. In large part, this is due to the ubiquity of mass-differential quantitation techniques that entail encoding samples with light and heavy forms of the peptides or proteins via mass-shift tags or metabolic labeling (e.g., SILAC, reductive dimethylation, mTRAQ).2
Though these mass-differential quantitation methods have been adapted to allow for multiple quantitative channels, these gains come at the cost of increased MS1 spectral complexity.3 That is, as the number of quantitation channels increases so does the number of MS1 spectral features. This increase in MS1 spectral complexity results in a decrease in the average S/N ratio per MS1 feature, which results in reduced analyzer dynamic range and extended ion injection times. Also, in the context of standard data-dependent mass spectrometry methods, increasing MS1 spectral complexity negatively impacts instrument duty cycles because there are more non-unique features to interrogate and the resulting MS/MS spectra tend to have lower success rates.4 Through all these mechanisms, increased MS1 spectral complexity tends to limit proteomic coverage breadth and depth.
By contrast, multiplexed quantitation via isobaric chemical tags (e.g., TMT and iTRAQ) provides an avenue for mass spectrometry based proteome quantitation experiments to move towards greater parallelization without increasing analysis complexity.5 Each isobaric reagent contains an identical set of light and heavy isotopes that are uniquely divided between the balancer and reporter regions. As such, each intact reagent has an identical mass, while each reporter region produces a unique low m/z reporter ion. Hence, any increase in quantitative throughput does not increase MS1 spectral complexity. The capacity for isobaric reagent multiplexing is only limited by the number of isotopically encoded reporter ion isoforms. Already, there are commercially available 6- and 8-plex isobaric reagent kits, and an 18-plex method was recently demonstrated by combining mass-differential labeling with isobaric tagging.5b, 5d, 6
Herein, we describe a method for expanding the multiplexing capacity of the TMT 6-plex reagents by exploiting the relative mass difference between the isotopic pair of 15N and 14N, and the pair of 13C and 12C. Recently, the TMT-127 and -129 reagents were modified such that a 13C was exchanged for a 12C and a 14N was exchanged for a 15N. For brevity, we tend to describe this modification as substituting a 13C for a 15N. This substitution was made to accommodate the fragmentation pathways of ETD – i.e., ETD cleaves at a bond adjacent to the CID fragmentation site, which results in the proximal heavy carbon of the original TMT-127 and -129 channels relocating from the reporter ion to the balancer region.7 Following substitution of the 13C for a 15N, all the heavy isotopes were arranged such that both ETD and CID produce all six reporter ions. With the exception of these heavy isotope substitutions no other changes were made to the TMT reporter ions.
As a result of substituting a 15N for a 13C, the new reporter ions are 6.32 mDa lighter than the original forms (Fig. 1, Supplementary Fig. 1). Even though the mass difference between these reporter ion isotopologues is incredibly small, modern high-resolution and mass accuracy analyzers can resolve these ions (e.g., the high-field Orbitrap is capable of > 240k resolving power and sub ppm mass accuracies).8 Based on our ability to independently measure these isobaric reporter ions, we demonstrate that we can accurately quantify eight samples simultaneously by combining the original set of six TMT reagents with the new lighter versions of the TMT-127 and -129 channels, and we hypothesize that this concept could be applied to a 10- and even 18-plex system.
Figure 1.
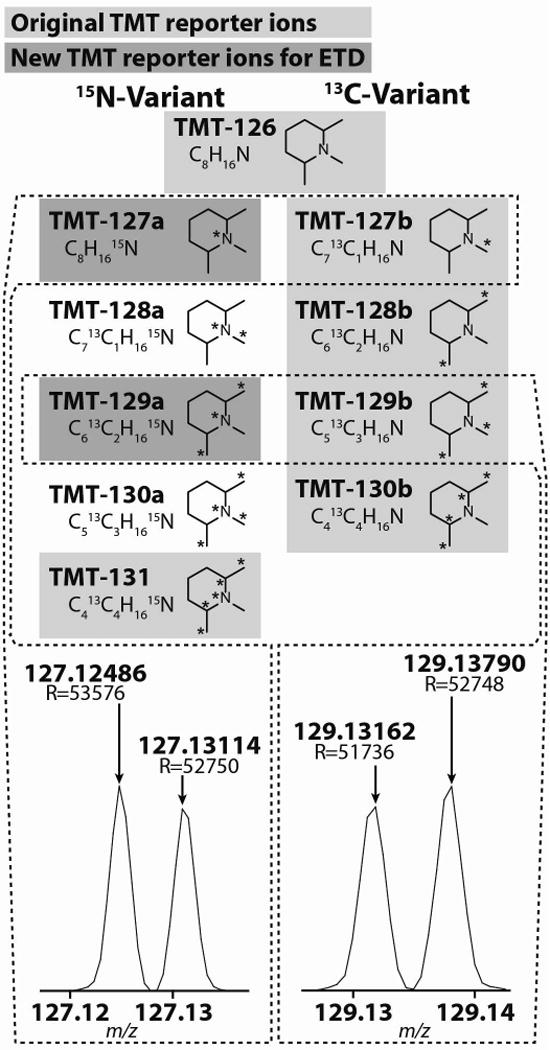
Previously there were only 6 TMT reagents available (highlighted in light grey). Due to complications arising from the preferred fragmentation pathways of ETD, the TMT-127, and -129 reporter ions were recently modified such that a 13C was exchanged for a 15N (dark grey). Though the new and old TMT-127 and -129 reagents only differ by ~6.32 mDa, high resolution mass spectrometers are capable of resolving these neighboring isobaric isotopologues.
Methods
Chemicals
Tandem mass tag (TMT) isobaric reagents were purchased from Thermo Scientific, Rockford, IL. Unless otherwise noted, all other chemicals were purchased from Sigma.
HeLa cell culture, harvest, and lysis
Human HeLa cells were cultured and lysed as previously described.9 Briefly, cells were maintained in Dulbecco’s modified Eagle’s medium supplemented with 10% dialyzed fetal bovine serum. Cells were harvested by scraping after the removal of media. The resulting cell pellet was washed with PBS and lysed with ice-cold lysis buffer. Cell debris was removed by centrifugation.
Protein content was measured using a BCA assay (Thermo Scientific, Rockford, IL), followed by reduction of disulfide bonds with DTT, and alkylation of cysteine residues with iodoacetamide as previously described.10 Protein lysates were separated from impurities by methanol-chloroform precipitation, solubilized in 1 M urea, 50 mM Tris–HCl (pH 8.8), and 75 mM NaCl, and digested overnight with endoproteinase LysC (Wako, Japan) at a 1:100 enzyme:protein ratio. The digest was acidified with formic acid to a pH of ~2–3, and subjected to C18 solid-phase extraction (Sep-Pak, Waters, Milford, MA).
Mouse tissue preparation
Murine brain and spleen tissues were prepared as previously described.1a Briefly, 3-week-old male Swiss-Webster mice were sacrificed after overnight fasting, and their tissues were harvested. Following tissue homogenization and protein extraction, cysteine residues were alkylated as described above. After methanol-chloroform precipitation, 1 mg of protein in the aforementioned urea lysis buffer was incubated with 1/100 enzyme/protein ratio of LysC for one hour and subsequently digested overnight with 1/50 enzyme/protein ratio of sequencing grade trypsin (Promega, Madison, WI). Trypsin digestion was terminated by adding formic acid to a final concentration of 1%. The digest was desalted over a 50 mg C18 solid-phase extraction (SPE) and lyophilized.
HeLa peptide TMT-labeling and mixing
Desalted HeLa peptides from a single LysC digest were equally split into eight aliquots and labeled with 8-plex TMT reagents. Reagents were dissolved in anhydrous acetonitrile and added to peptides dissolved in 200 mM HEPES, pH 8.5 to achieve a final acetonitrile concentration of 30% (v/v). After 1 h incubation at room temperature, the reaction was quenched with hydroxylamine at a final concentration of 0.3% (v/v), followed by acidification with formic acid to pH ~2–3.
Three separate mixtures of TMT-labeled peptides were prepared (Fig. 3a): (1) a 2-plex mixture containing peptides labeled with TMT-127a and -129a and mixed at a 10:1 ratio; (2) a 6-plex mixture containing peptides labeled with TMT-126, -127b, -128, -129b, -130, and -131 and mixed at ratios of 10:1:1:10:1:10, respectively; and (3) mixtures 1 and 2 combined at a ratio of 1:1. The 2-, 6-, and 8-plex mixtures were subjected to C18 desalting using home-made stage tips.11
Figure 3.
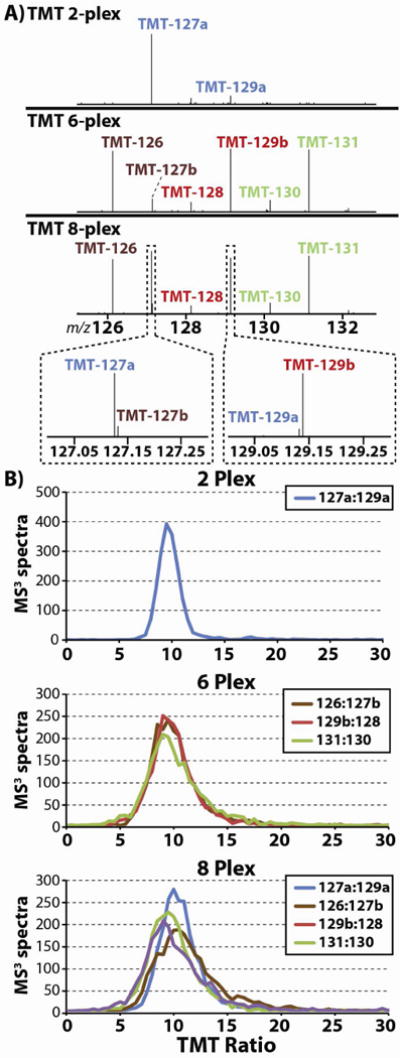
(A) A complex mixture of LysC peptides – derived from unfractionated HeLa lysate – was split eight ways and labeled with the eight available TMT reagents. Three separate samples were prepared from the peptides: (1) a 2-plex mixture containing peptides labeled with TMT-127a and -129a and mixed at a 10:1 ratio; (2) a 6-plex mixture containing peptides labeled with TMT-126, -127b, -128, -129b, -130, and -131 and mixed at ratios of 10:1:1:10:1:10, respectively; and, (3) a sample containing (1) and (2) combined at a ratio of 1:1. (B) The 2-plex, 6-plex, and 8-plex mixtures were analyzed using the MS3 method, and the resulting distributions of TMT ratios are displayed here. We found that as the complexity of the reporter ion population increases from 2- to 8-plex the median ratio is unaffected and consistently centers on 10:1.
Mouse tissue peptide TMT-labeling
Desalted peptides from mouse brain and spleen were split equally into four aliquots each (eight samples total). Similar to above, peptides were dissolved in 200 mM HEPES, pH 8.5 and TMT reagents that had been re-suspended in anhydrous acetonitrile were added to a final concentration of 30% (v/v) acetonitrile. After 1h, the reaction was quenched with 5% hydroxylamine and then acidified with formic acid. Mouse brain peptides were labeled with TMT-126, -127b, -129a, and -130; and mouse spleen peptides were labeled with TMT-127a, -128, -129b, and 131; and mixed at ratios of 1:1:1:1:1:1:1:1. The mixture was desalted using home-made C18 stage tips.11
LC-MS/MS
All of our data was collected using an Orbitrap Elite mass spectrometer (Thermo Fisher Scientific, San Jose, CA) coupled with a Famos autosampler (LC Packings) and an Accela 600 quaternary liquid chromatography (LC) pump (Thermo Fisher Scientific). For each analysis of the HeLa sample, we loaded ~500ng of peptides onto the column. For analysis of the mouse tissue sample we loaded 1 μg. For both samples, peptides were separated on a 100 μm inner diameter microcapillary column packed with ~0.5 cm of Magic C4 resin (5 μm, 100 Å, Michrom Bioresources) followed by ~20 cm of Maccel C18 AQ resin (3 μm, 200 Å, Nest Group). HeLa peptides were separated using a 72 min gradient of 6 to 33% acetonitrile gradient in 0.125% formic acid. Mouse peptides were separated with a gradient of 3 to 33% acetonitrile in 0.125% formic acid for 150 minutes. For both methods the flow rate was ~300 nl/min.
Unless otherwise noted, every analysis utilized an MS3-based TMT centric mass spectrometer method. In brief, the scan sequence began with an MS1 spectrum (Orbitrap analysis, resolution 60k, 300–1500 m/z, AGC target 1 × 10⁶, maximum injection time 150 ms). The top ten precursors were then selected for MS2/MS3 analysis. MS2 analysis consisted of CID (quadrupole ion trap analysis, AGC 2 × 10³, NCE 35, q-value 0.25, maximum injection time 100 ms). Following acquisition of each MS2 spectrum, we collected an MS3 spectrum using a new method we recently described in which we capture multiple MS2 fragment ions in the MS3 precursor population using isolation waveforms with multiple frequency notches.9, 12 Briefly, we have developed on-line algorithms that filter MS2 fragment ions based upon their expected reporter ion fragment signal and their required isolation specificity. In general 6–9 MS2 fragment ions contribute to the MS3 spectrum, and in this way we are able to significantly increase the resulting TMT reporter ion population. Every MS3 precursor population was fragmented by HCD and analyzed using the Orbitrap (NCE 50, Max AGC 1.5 × 10⁵, maximum injection time 250 ms). To further minimize the influence of co-eluting species, peptides with isolation specificities less than 0.8 were also excluded on-line.12b Unless otherwise noted we set our Orbitrap resolving power to 30k (@ 400 m/z) for all MS3 scans.
Data analysis
Mass spectra were processed using a software pipeline that was developed in-house, and is based around the Sequest algorithm.1a, 13 MS spectra were converted to mzXML files using a modified version of ReAdW.exe, and then searched against a database including all entries from the human or mouse International Protein Index databases (version 3.6), respectively. ReAdW.exe was modified to export ion noise as well as intensity. Concatenated onto the end of these databases were reverse databases comprised of all the listed protein sequences in reversed order. Searches were performed using a 50 ppm precursor ion tolerance. Product ion tolerances were either set to 0.5 Th or 0.02 Th depending upon whether the spectra being searched were collected using the quadrupole ion trap or the Orbitrap, respectively. TMT tags on lysine residues and peptide N termini (229.162932 Da) and carbamidomethylation of cysteine residues (57.02146 Da) were set as static modifications, while oxidation of methionine residues (+15.99492 Da) was set as a variable modification. Peptide spectral matches (PSMs) were filtered to a 1% FDR.14 PSM Filtering was performed using an linear discriminant analysis, as previously described, while considering the following parameters: XCorr, ΔCn, missed cleavages, peptide length, charge state, and precursor mass accuracy.1a
For TMT-based reporter ion quantitation, we began by extracting the S/N ratio for each TMT channel. This entailed finding the closest matching centroid to the expected mass of the TMT reporter ion. The search space for each reporter ion was limited to a range of 0.002 Th to prevent overlap between the isobaric reporter ions. Following extraction, the TMT reporter ion signals were adjusted to account for isotopic impurities in each TMT variant (provided by the manufacturer). Based upon published relationships, and our own observations, we estimated that the noise band of the Orbitrap pre-amplifier is approximately equal to 5 charges; hence, we approximated the number of TMT ions in a given peak by multiplying the S/N ratio by 5.15
When calculating the TMT ratios for the HeLa experiments, we only considered spectra that produced a positive human identification, and we only calculated the ratio if both ions were present (requiring both ions to be present resulted in ~1% loss in MS3 data). In the case of the 2-, and 6-plex HeLa samples, the ratios were normalized to the expected value of 10 to account for any mixing errors. Because the 8-plex sample was a combination of the 2- and the 6-plex samples, the ratios for the 8-plex sample were normalized using the same factors that were derived for the 2- and 6-plex samples. In this manner, any possible systematic shifts in the observed TMT ratios between 2- and 8-plex samples, as well as between the 6- and 8-plex samples, are preserved in the 8-plex results.
For protein-level comparison of mouse brain and spleen proteomes, peptide-spectral matches were first identified, quantified, and filtered to an 1% FDR as described above. Peptides were then assembled into proteins and further filtered to a final protein-level FDR of 1%. Protein assembly was guided by principles of parsimony to produce the smallest set of proteins necessary to account for all observed peptides. Proteins were then quantified by summing reporter ion counts across all matching peptide-spectral matches. Peptide-spectral matches with poor quality MS3 spectra, (more than 4 TMT channels missing and/or fewer than 250 total reporter ions) or no MS3 spectra at all, were excluded from quantitation.
Following protein quantitation, each reporter ion channel was summed across all quantified proteins and normalized assuming equal protein loading across all eight samples. Welch’s T-Test was then used to identify proteins that were differentially expressed across quadruplicate brain and spleen replicates and the method of Benjamini and Hochberg16 was subsequently applied to control for multiple testing error (p < 0.01).
Results and Discussion
As originally implemented, there were only 6 TMT reagents available: TMT-126 to TMT-131. However, the TMT-127 and -129 reagents were recently modified to accommodate the preferred fragmentation pathways of ETD (Fig. 1). ETD fragments the TMT tag at the bond adjacent to the CID fragmentation site; hence, the proximal heavy carbon of the original TMT-127 and -129 reporter ions is retained on the balancer region during ETD (Supplementary Fig. 2).7 To obviate these fragmentation issues, these heavy carbons were substituted for heavy nitrogen atoms. In this manner, both ETD and CID produce all six reporter ions. A byproduct of substituting a 13C isotope for a 15N was the introduction of a mass shift of 6.32 mDa between the original TMT-127 and -129 reporter ions (here on referred to as TMT-127b and -129b reporter ions) and the new TMT-127 and -129 reporter ions (here on referred to as TMT-127a and -129a). Even though their masses are nearly identical, with a high-resolution and mass accuracy analyzer it is possible to distinguish these reporter ion isotopologues (vide infra). As such, we hypothesized that by combining all eight reagents together, we may increase the quantitative capacity of the TMT reagents from 6-plex to 8-plex. We were motivated, in part, because we predict that the same synthetic pathways that produced TMT-127a and -129a could be adapted to produce TMT-128a and TMT-130a channels. As such, we envision this work as a blue-print to producing at least a 10-plex set of TMT reagents.
Resolving reporter ion isotopologues with isobaric masses and studying their relative isotopic accuracy
In a proof-of-concept experiment, we labeled AngioT (DRVYIHPFHL) with TMT-127a, -127b, -129a, and -129b, and mixed the tagged peptides at ratios of 10:1:10:1, respectively. Following preparation and infusion of the TMT-labeled mixture, we fragmented the triply charged AngioT precursor ions with HCD and analyzed the resulting product ion population with an Orbitrap analyzer at a range of resolving powers (Fig. 2).
Figure 2.
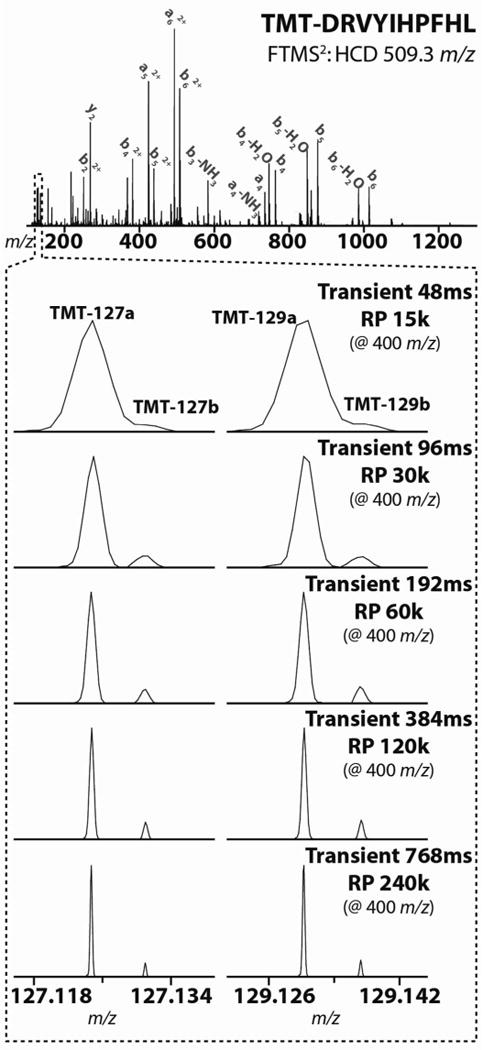
The peptide AngioT (DRVYIHPFHL) was labeled with TMT-127a, -127b, -129a, and -129b. Following labeling, the differentially tagged peptides were mixed at 10:1 ratios and analyzed with a FTMS2 HCD scan on an Orbitrap Elite. Spectra were collected at a range of resolving powers (15k–240k @ 400 m/z). With the D20 Orbitrap analyzer, a relatively short transient of 96ms provides baseline resolution between the differentially expressed reporter ions.
We mixed the peptides at 10:1, both to measure the quantitative accuracy of the isobaric TMT channels, and to create a situation in which it would be difficult to resolve these reporter ions due to their divergent intensities. At the lowest resolution settings, the proximal TMT channels coalesce such that the lower abundance channels appear only as shoulders on the high-abundance ions rather than as discrete peaks. However, as the Orbitrap analyzer transient is extended and the spectral resolution increases, the two peaks diverge to clearly reveal unique ion populations. Even at a 10:1 TMT ratio, a resolving power of ~50k at 130 m/z (30k at 400 m/z) is sufficient to resolve the isobaric TMT reporter ions. 50k is significantly higher than the ~21k nominal resolving power one might expect would be required for these isobaric ions (21k RP = 130 Da/6.32 mDa). This divergence reflects the difference between nominal resolving power and quantitative resolving power – i.e., the resolving power necessary to ensure accurate intensity measurements of the isobaric ions. At even higher resolution settings the two peaks are unambiguously resolved, and the longer transients also result in higher quantitative precision (vide infra). However, we feel that these improvements in data quality are not reasonable because the time penalties associated with the longer transients are substantial – i.e., the length of the transient increases from 96 to 192 ms when the resolution setting is increased from 30k to 60k (at 400 m/z).
All these analyses were performed using the high-field Orbitrap analyzer.8 With this analyzer, the time penalty of collecting spectra at 15k resolving power (at 400 m/z) instead of 30k is minor. The length of the associated Orbitrap transients increases from 48 ms to 96 ms -which in the context of our FTMS3 analyses produces a minimal increase in overall duty cycle (i.e., this translates into a 10–20% increase in the MS3 scan time). The older generation Orbitrap analyzer is equally capable of achieving baseline resolution for these isobaric TMT reporter ion isotopologues.17 However, the older analyzer has a larger geometry, an attenuated electric field, and the supporting software does not include the advanced signal processing algorithms that are commonplace with the new high-field analyzer. As such, to achieve equivalent spectral resolutions with the older analyzer requires transients that are 4 times as long as what is required with the newer high-field analyzer – e.g., to acquire a spectrum with a resolving power of 30k at 400 m/z requires a 384 ms transient on the old analyzer.
LC-MS/MS analysis of 2-plex, 6-plex, and 8-plex complex mixtures
To assay the accuracy of the 8-plex set of TMT reagents, we prepared a series of TMT labeled complex mixtures that we analyzed by data-dependent LC-MS2/MS3. Our primary interest was to compare the quantitative accuracy of the isobaric reporter ion isotopologues with that of their standard counterparts and thus determine whether the extreme closeness of the isobaric channels distorted the observed TMT ratios. We equally split a complex mixture of LysC peptides – derived from an un-fractionated HeLa lysate – eight ways and labeled each aliquot with a different TMT reagent. Overall we prepared three different mixtures of the TMT-labeled LysC HeLa peptides: (1) a 2-plex mixture that utilized only the new TMT reporter ions (TMT-127a and -129a mixed at a 10:1 ratio); (2) a 6-plex mixture that utilized only the old TMT reporter ions (TMT-126, -127b, -128, -129b, -130, and -131 mixed at ratios of 10:1:1:10:1:10, respectively); and, (3) an 8-plex mixture that consisted of the 2-plex and 6-plex mixtures mixed together at a ratio of 1:1 (Fig. 3a).
By combining the 2- and 6-plex mixtures to form the 8-plex sample, and ensuring that neither the 2- nor the 6-plex mixtures contain any isobaric TMT channels, we were able to measure the TMT ratios produced using the isobaric TMT channels both in the presence and absence of any proximal and possibly interfering TMT signals. As expected, the distribution of TMT ratios from the 2- and 6-plex samples adhered closely to the expected ratio of 10:1 (Fig. 3b). However, as we move from the very simple 2-plex experiment to the more complicated 6-plex experiment, the distribution of observed TMT ratios does broaden (vide infra).
When the 2- and 6-plex samples are combined to produce the 8-plex sample, the resulting distribution of TMT ratios still centers on the expected value of 10:1. This result demonstrates that isobaric TMT isotopologues are suitable for quantitation. That said, the distribution of observed ratios for the 8-plex mixture is noticeably broader than either the 2- or 6-plex samples. This trend toward wider distributions with the 8-plex sample is in large part an extension of the same trend that was observed between the 2- and 6-plex samples, and is due to the diminished ion counts per TMT channel that necessarily result from dividing the total TMT product ion signal amongst an increasing number of TMT channels.
Whether the mixture being analyzed is 2-, 6-, or 8-plex, the TMT reporter ion population is finite. The partitioning between sequence-informative ions and TMT reporter ions is set by the relative energetics of peptide backbone and TMT reporter bond fragmentation. Because these bond energetics do not change as we increase the number of TMT channels present in the sample, the number of precursor ions partitioning into the TMT reporter ion population remains fixed – i.e., the median number of TMT ions produced during each MS3 analysis was approximately 1,900 for the 2-plex sample, 2,100 for the 6-plex, and 2,200 for the 8-plex (we attribute the slight upward trend to variations in sample preparation). However, as we move from the low complexity 2-plex TMT reporter population to the high complexity 8-plex population, the number of channels utilizing this finite population of reporter ions grows; hence, the number of TMT reporter ions per TMT channel decreases. In our 2-, 6-, and 8-plex experiments, the median number of TMT reporter ions per channel decreases to 950, 350, and 275, respectively – i.e., per 10:1 ratio the number of TMT reporter ions is 1,900, 700, and 550, respectively.
To better understand the impact these diminishing TMT ion counts have on the variance of the TMT ratios, we simulated the distribution of TMT ratios using a simple Poisson model for an expected ratio of 10:1 over a range of TMT ion counts (Fig. 4a). Overlaid onto this simulation are the observed distributions of TMT ratios from the TMT 2-, 6-, and 8-plex experiments. These experimental distributions have been centered over the median number of charges per 10:1 ratio for each experiment. In general, the observed distribution of TMT ratios matched closely with the expected distribution. For each experiment, the error bars of the observed distributions extend beyond the expected values. This is most likely due to measurement error (vide infra).
Figure 4.
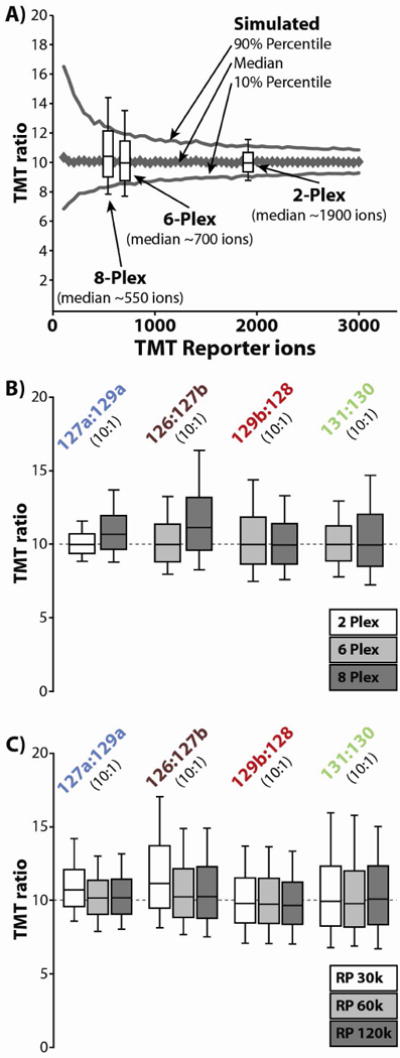
(A) The distribution of TMT ratios was simulated using a simple Poisson model for an expected ratio of 10:1 over a range of TMT ion counts. Overlaid onto this simulation are the observed distributions of TMT ratios from the TMT 2-, 6-, and 8-plex experiments. These experimental distributions were centered over the median number of charges observed in each experiment. In general the observed distribution matched closely with the expected distribution. For each experiment, the experimental error bars extend out beyond the expected values, most likely do to measurement error. (B) The different pairs of TMT ratios from the 2-, 6-, and 8-plex experiments are plotted against each other. These are the same distributions that were plotted in figure 3B. The ratios based upon the low abundance isobaric channels (i.e., 129a and 127b) diverge from the ratios based upon the low abundance standard channels (i.e., 128 and 130) in that the distributions skew towards higher ratios (> 10:1). (C) In a separate set of analyses, the 8-plex mixture was analyzed at resolving powers of 30k, 60k, and 120k (@ 400 m/z). As resolving power increases, the skewed distributions for ratios involving the low-abundance isobaric channels (i.e., 129a and 127b) shifts toward 10:1. Also, as resolving power increases, the distribution tightens, most likely due to improved analyzer accuracy.
There is also a noticeable trend toward higher TMT ratios for the 8-plex sample, which we do not attribute to decreasing TMT ion counts. Whereas the 2- and 6-plex distributions are centered directly over the expected value of 10:1, the 8-plex sample skews towards slightly larger TMT ratios (median value of ~10.5 for all channels). In an effort to further explore these trends, the TMT ratios from the 2-, 6-, and 8-plex experiments were plotted against each other (Fig. 4b). Interestingly, only the ratios based upon the low abundance isobaric channels (i.e., TMT-129a and -127b) show this skew toward higher TMT ratios, and this skew only occurs when there is a high abundance isobaric TMT signal proximal to these low abundance signals (i.e., the skew is only observable when analyzing the 8-plex mixture and not the 2- or 6-plex mixtures). By comparison, the TMT ratios based upon the low abundance standard channels (i.e., TMT-128 and -130) are centered over the expected value of 10:1 in both the 6- and 8-plex mixtures. It has been observed previously that ions with similar m/z ratios can constructively and destructively interfere with each other’s signals over the course of the FT transient such that relative isotopic accuracy is endangered.18 Though we have never noticed these issues when analyzing the original TMT reporter ions, we suspect these phenomena are responsible for this slight shift in the TMT ratios of the isobaric channels.
To further investigate these trends, we analyzed the 8-plex mixture using a range of resolution settings (30k, 60k, and 120k at 400 m/z) during our FTMS3 analyses (Fig. 4c). As resolving power increases, the median ratios based upon the low abundance isobaric channels (i.e., TMT-129a and -127b) shifts back towards the expected ratio of 10:1; hence, transient length does seem to have some role in this minor distortion of the TMT ratios. Hopefully as these phenomena are studied further, correction algorithms may develop that can compensate for this distortion. However, in the case of our system, these trends only result in an average increase of 9% in the median ratio (median of ~10.9:1 for the ratios based upon isobaric TMT channels), which we feel is immediately acceptable.
Increasing the transient length of the FTMS3 spectra also results in noticeably tighter distributions of observed TMT ratios. This is most likely due to improved analyzer accuracy – i.e., the longer transients are more accurate at measuring the number of charges in a given peak. It was noted earlier that the error bars of the 2-plex, 6-plex, and 8-plex distributions of TMT ratios exceeded the expected values based on the simple Poisson model (Fig. 4a). Most likely, this divergence between the expected and observed error was due to the additional measurement error that resulted from the shorter transients we employed in those experiments. However, the increase in variance resulting from these measurement inaccuracies is still rather small and the time penalties resulting from collecting longer transients are appreciable; hence, we feel the shorter transients were best.
As an alternative to increasing the transient length to improve the accuracy of the TMT measurements, we can also increase the injection time of the precursor population. The number of ions in the TMT population should scale linearly with precursor injection time up to the spacecharge limits of the mass spectrometer; hence, the injection would only need to be multiplied by 1.333 to maintain the ion distributions during an 8-plex experiment that are typical for a 6-plex experiment. This alternative strategy is depicted in figure 5. We tuned the MS3 injection time to the number of reporter channels in the sample – i.e., after the instrument firmware calculated the standard injection time for every MS3 precursor population, we multiplied that time by an additional scaling factor. For the 2-plex experiments all MS3 injection times were multiplied by 0.333. For the 8-plex experiments the times were multiplied by 1.333. No additional data was collected for the 6-plex experiment. Following these adjustments, the median number of charges per TMT channel were roughly equivalent across the 2-, 6-, and 8-plex experiments. Consequently, the distributions of observed TMT ratios were also approximately equivalent for all three experiments. Though we do not envision ourselves manipulating the injection times in this manner for the 8-plex experiment – as noted earlier the distribution of observed TMT ratios is already acceptable for the 8-plex experiment – for future experiments that employ additional quantitative channels (e.g., 18-plex) this strategy may be necessary.
Figure 5.
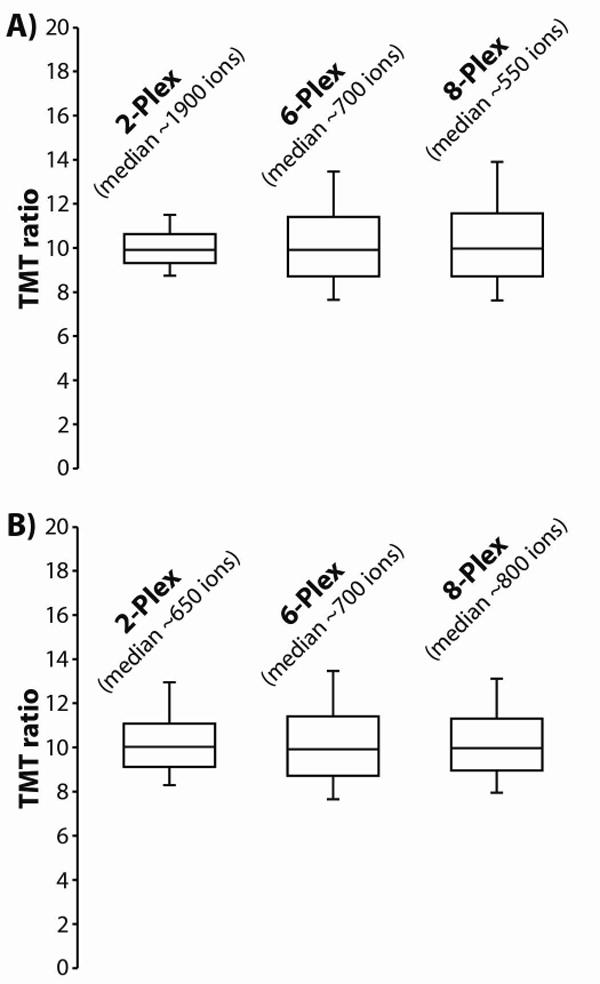
(A) We analyzed the 2-, 6-, and 8-plex samples using the standard MS3 method. As the total number of TMT channels increases, the average number of charges per TMT channel decreases. This results in poor ion statistics, which produce wider distributions of observed TMT ratios. However, as shown in (B) by simply increasing the injection time we can compensate for the decrease in ion counts that result from an increase in reporter ion channels. We tuned the MS3 injection time to the number of reporter channels in the sample: for 2-plex experiments all injection times were multiplied by 0.333, for 8-plex experiments the times were multiplied by 1.333. For 6-plex experiments no additional data was collected. Following these adjustments, the median number of charges per TMT channel were roughly equivalent across the 2-, 6-, and 8-plex experiments. Consequently, the distributions of observed TMT ratios were also approximately equivalent for all three experiments.
Mouse tissues
Previously, we characterized the performance of the isobaric TMT isotopologues using control samples: individual peptides and protein digests mixed at known ratios. Next we compared protein abundance profiles across quadruplicate mouse brain and spleen extracts. Quantifying tissue-specific protein expression patterns is useful from an analytical point of view, as tissue-specific patterns of both gene and protein expression have been profiled previously1a, 19, enabling us to evaluate our results against these known standards. Furthermore, by incorporating four technical replicates of each tissue, we can compare the performance of the isobaric channels with their standard counterparts.
Following digestion, labeling and mixing of these eight lysates, a single combined sample was analyzed via LC-MS2/MS3 using the Orbitrap Elite as discussed previously.9 A total of 941 proteins were identified and quantified at a 1% protein FDR, 835 of which were found to be differentially expressed between brain and spleen (Fig. 6a). Protein expression profiles consistently matched expectations, as proteins including Mbp, Snap25 and Mtap2 were found specifically in brain tissue, while proteins such as Pcna, Vcl and Hnrnpu were found predominantly in spleen.1a A subset of ubiquitously-expressed proteins, including Hspa9, was found to be present at comparable levels in spleen and brain. Notably, protein profiles observed via isobaric labeling channels (127a, 127b, 129a, and 129b) are virtually indistinguishable from their standard counterparts (126, 128, 130, and 131) within each tissue, demonstrating that isobaric TMT channels and standard channels are equally suited for protein quantitation.
Figure 6.
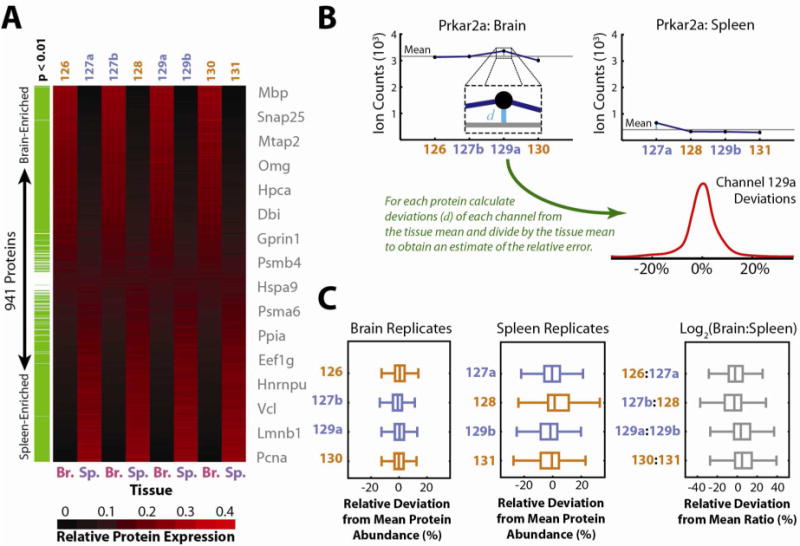
(A) Quadruplicate mouse brain and spleen samples were labeled and the combined lysates were analyzed in a single LC-MS run to evaluate the performance of isobaric labeling for quantitative characterization at a proteomic scale. Relative reporter ion intensities are displayed as a heat map for 941 quantified proteins, ordered by their relative expression in brain (Br.) versus spleen (Sp.). Differentially expressed proteins were identified by Welsh’s T-Test (p < 0.01) with multiple testing correction by the method of Benjamini and Hochberg38 and are highlighted in green. Gene symbols from representative proteins are listed near their expression profiles. Reporter ion channels with standard spacing are colored orange, while isobaric channels are highlighted in blue. Notably, protein expression profiles are indistinguishable for brain and spleen replicates with either standard or isobaric labels. (B) To further probe the effects of isobaric labeling, each protein’s abundance profile was analyzed as depicted for Prkar2a. For each protein the mean ion count within each tissue was subtracted from each observed reporter ion count and the resulting difference was divided by the tissue mean. The resulting relative deviations were tallied for each reporter ion across all quantified proteins and the resulting distributions (C) were plotted as Box-Whisker plots for comparison. Similarly, relative deviations of log2 ratios observed for pairs of brain and spleen replicates compared with the overall average log2 ratio were plotted. If present, sub-optimal quantitation via isobaric labeling would be apparent either due to systematic shifts away from the mean (zero) or due to overall wider scatter in these distributions. However, no systematic differences between standard and isobaric labels are apparent, suggesting equivalent quantitative performance.
Although global protein profiles appear to indicate equivalent performance between the standard and isobaric labels, we investigated further to rule out more subtle systematic effects. Our experimental approach is diagrammed for a representative protein (Prkar2a) in Figure 6b, while Figure 6c summarizes our results. TMT reporter ions for each protein were grouped based on their tissue of origin, and the signal for each channel was compared against the average of all four replicates of that tissue. Upon plotting the distributions of the relative deviations associated with each reporter ion channel across all quantified proteins, any systematic biases due to isobaric labels should be reflected by shifts in each distribution away from zero, or by generally wider variability compared with standard isobaric labeling channels. In fact, we see no significant differences between standard and isobaric labeling, confirming that their performance for large-scale quantitative proteomics studies is equivalent.
Conclusions
Isobaric reagent design and implementation can be a time consuming and difficult process. It is necessary to optimize both the reagent structure – with an eye towards selecting fragmentation energies that appropriately balance peptide backbone bond fragmentation and reporter ion cleavage – and to make allowances for reagent synthesis and cost.6a, 20 Developing a reagent that maximizes quantitative IDs is particularly problematic when the goal is to produce as many quantitative channels as possible. Previous work examining the effectiveness of highly multiplexed isobaric reagents (> 6 reporter ions), found a strong inverse correlation between the number of quantitative channels and the probability of producing a sequence informative fragmentation spectrum.21
In every case, these highly multiplexed reagents utilized isobaric tags of larger and larger sizes. As such, these structures contain more atoms to manipulate when isotopically encoding all the different reporter isoforms. However, these larger tags are also the source of more competing fragment ions (e.g., neutral loss species, partial cleavages, etc.) that obfuscate the sequence informative fragment ion population. As noted by Pichler et al., substituting the iTRAQ 8-plex label for the iTRAQ 4-plex label results in a 5-fold decrease in the number of peptide spectral matches. By contrast, our strategy for increasing the multiplexing capacity of the TMT reagents does not require any alterations to the fundamental TMT structure; hence, there are no changes in fragmentation patterns, fragmentation energies, etc. Whereas other multiplexing strategies have been reduced to inventing a new isobaric tag, the strategy presented here is based upon a molecule that is proven to be well suited for both peptide identification and quantitation. As such, compared to the 5-fold decrease in sensitivity with the iTRAQ 8-plex labeling scheme, we only see a ~10% decrease in peptide spectral matches when we move from the TMT 2-plex to the 8-plex sample (2,747 PSMs vs. 3,012).
Though we only present data for an 8-plex set of reagents, based upon our success with these isobaric reporter ion isotopologues, and considering the structure of the TMT reporter ion, we feel that this work serves as a blueprint for a 10-plex set of reagents. We expect that the same synthetic pathways that produced TMT-127a and -129a can be adapted to produce TMT-128a and TMT-130a channels (Fig. 1). Looking beyond a possible 10-plex set of reagents, 18 different TMT reporter ions could be produced if every C and N were used in the TMT encoding process (Supplementary Fig. 3), and even higher degrees of multiplexing are possible if the elemental composition of the reporter ion includes multiple nitrogen atoms. For example, the piperazine ring of the iTRAQ 8-plex reporter ion contains two nitrogens; hence, it could form the basis for a 19-plex set of reagents if every possible isotopologue was generated. In contrast, a previously detailed hyper-plexing (> 10-plex) labeling scheme utilized mass-differential labeling in combination with the TMT isobaric tags.6b Though that method does allow for simultaneous quantitation across 18 samples, it comes at the cost of increased MS1 spectral complexity. Alternatively, our proposed hyper-plexing scheme would not suffer from that particular drawback; hence, we feel that this is more the future than the later method.
Supplementary Material
Acknowledgments
We thank Ian Jardine, Vlad Zabrouskov, and Mike Senko for helpful discussions and logistical support. We also thank Ramin Rad for helpful discussions with regards to data analysis. We are grateful to Thermo Fisher Scientific and the National Institutes of Health (GM67945 and HG3456) for providing funding for this work.
References
- 1.(a) Huttlin EL, Jedrychowski MP, Elias JE, Goswami T, Rad R, Beausoleil SA, Villen J, Haas W, Sowa ME, Gygi SP. A Tissue-Specific Atlas of Mouse Protein Phosphorylation and Expression. Cell. 2010;143(7):1174–1189. doi: 10.1016/j.cell.2010.12.001. [DOI] [PMC free article] [PubMed] [Google Scholar]; (b) Nagaraj N, Wisniewski JR, Geiger T, Cox J, Kircher M, Kelso J, Paabo S, Mann M. Deep proteome and transcriptome mapping of a human cancer cell line. Mol Syst Biol. 2011;7 doi: 10.1038/msb.2011.81. [DOI] [PMC free article] [PubMed] [Google Scholar]; (c) Beck M, Schmidt A, Malmstroem J, Claassen M, Ori A, Szymborska A, Herzog F, Rinner O, Ellenberg J, Aebersold R. The quantitative proteome of a human cell line. Mol Syst Biol. 2011;7 doi: 10.1038/msb.2011.82. [DOI] [PMC free article] [PubMed] [Google Scholar]; (d) Phanstiel DH, Brumbaugh J, Wenger CD, Tian SL, Probasco MD, Bailey DJ, Swaney DL, Tervo MA, Bolin JM, Ruotti V, Stewart R, Thomson JA, Coon JJ. Proteomic and phosphoproteomic comparison of human ES and iPS cells. Nature Methods. 2011;8(10):821–U84. doi: 10.1038/nmeth.1699. [DOI] [PMC free article] [PubMed] [Google Scholar]; (e) de Godoy LMF, Olsen JV, Cox J, Nielsen ML, Hubner NC, Frohlich F, Walther TC, Mann M. Comprehensive mass-spectrometry-based proteome quantification of haploid versus diploid yeast. Nature. 2008;455(7217):1251–U60. doi: 10.1038/nature07341. [DOI] [PubMed] [Google Scholar]
- 2.(a) DeSouza LV, Taylor AM, Li W, Minkoff MS, Romaschin AD, Colgan TJ, Siu KWM. Multiple reaction monitoring of mTRAQ-labeled peptides enables absolute quantification of endogenous levels of a potential cancer marker in cancerous and normal endometrial tissues. Journal of Proteome Research. 2008;7(8):3525–3534. doi: 10.1021/pr800312m. [DOI] [PubMed] [Google Scholar]; (b) Gygi SP, Rist B, Gerber SA, Turecek F, Gelb MH, Aebersold R. Quantitative analysis of complex protein mixtures using isotope-coded affinity tags. Nature Biotechnology. 1999;17(10):994–999. doi: 10.1038/13690. [DOI] [PubMed] [Google Scholar]; (c) Li JX, Steen H, Gygi SP. Protein profiling with cleavable isotope-coded affinity tag (cICAT) reagents – The yeast salinity stress response. Molecular & Cellular Proteomics. 2003;2(11):1198–1204. doi: 10.1074/mcp.M300070-MCP200. [DOI] [PubMed] [Google Scholar]; (d) Hansen KC, Schmitt-Ulms G, Chalkley RJ, Hirsch J, Baldwin MA, Burlingame AL. Mass spectrometric analysis of protein mixtures at low levels using cleavable C-13-isotope-coded affinity tag and multidimensional chromatography. Molecular & Cellular Proteomics. 2003;2(5):299–314. doi: 10.1074/mcp.M300021-MCP200. [DOI] [PubMed] [Google Scholar]; (e) Ong SE, Blagoev B, Kratchmarova I, Kristensen DB, Steen H, Pandey A, Mann M. Stable isotope labeling by amino acids in cell culture, SILAC, as a simple and accurate approach to expression proteomics. Molecular & Cellular Proteomics. 2002;1(5):376–386. doi: 10.1074/mcp.m200025-mcp200. [DOI] [PubMed] [Google Scholar]; (f) Hsu JL, Huang SY, Chow NH, Chen SH. Stable-isotope dimethyl labeling for quantitative proteomics. Analytical Chemistry. 2003;75(24):6843–6852. doi: 10.1021/ac0348625. [DOI] [PubMed] [Google Scholar]
- 3.(a) Hsu JL, Huang SY, Chen SH. Dimethyl multiplexed labeling combined with microcolumn separation and MS analysis for time course study in proteomics. Electrophoresis. 2006;27(18):3652–3660. doi: 10.1002/elps.200600147. [DOI] [PubMed] [Google Scholar]; (b) Morano C, Zhang X, Fricker LD. Multiple Isotopic Labels for Quantitative Mass Spectrometry. Analytical Chemistry. 2008;80(23):9298–9309. doi: 10.1021/ac801654h. [DOI] [PMC free article] [PubMed] [Google Scholar]; (c) Boersema PJ, Aye TT, van Veen TAB, Heck AJR, Mohammed S. Triplex protein quantification based on stable isotope labeling by peptide dimethylation applied to cell and tissue lysates. Proteomics. 2008;8(22):4624–4632. doi: 10.1002/pmic.200800297. [DOI] [PubMed] [Google Scholar]
- 4.Mertins P, Udeshi ND, Clauser KR, Mani DR, Patel J, Ong S-E, Jaffe JD, Carr SA. iTRAQ labeling is superior to mTRAQ for quantitative global proteomics and phosphoproteomics. Molecular & Cellular Proteomics. 2011 doi: 10.1074/mcp.M111.014423. [DOI] [PMC free article] [PubMed] [Google Scholar]
- 5.(a) Thompson A, Schafer J, Kuhn K, Kienle S, Schwarz J, Schmidt G, Neumann T, Hamon C. Tandem mass tags: A novel quantification strategy for comparative analysis of complex protein mixtures by MS/MS. Analytical Chemistry. 2003;75(8):1895–1904. doi: 10.1021/ac0262560. [DOI] [PubMed] [Google Scholar]; (b) Dayon L, Hainard A, Licker V, Turck N, Kuhn K, Hochstrasser DF, Burkhard PR, Sanchez JC. Relative quantification of proteins in human cerebrospinal fluids by MS/MS using 6-plex isobaric tags. Analytical Chemistry. 2008;80(8):2921–2931. doi: 10.1021/ac702422x. [DOI] [PubMed] [Google Scholar]; (c) Ross PL, Huang YLN, Marchese JN, Williamson B, Parker K, Hattan S, Khainovski N, Pillai S, Dey S, Daniels S, Purkayastha S, Juhasz P, Martin S, Bartlet-Jones M, He F, Jacobson A, Pappin DJ. Multiplexed protein quantitation in Saccharomyces cerevisiae using amine-reactive isobaric tagging reagents. Molecular & Cellular Proteomics. 2004;3(12):1154–1169. doi: 10.1074/mcp.M400129-MCP200. [DOI] [PubMed] [Google Scholar]; (d) Choe L, D’Ascenzo M, Relkin NR, Pappin D, Ross P, Williamson B, Guertin S, Pribil P, Lee KH. 8-Plex quantitation of changes in cerebrospinal fluid protein expression in subjects undergoing intravenous immunoglobulin treatment for Alzheimer’s disease. Proteomics. 2007;7(20):3651–3660. doi: 10.1002/pmic.200700316. [DOI] [PMC free article] [PubMed] [Google Scholar]
- 6.(a) Sohn CH, Lee JE, Sweredoski MJ, Graham RLJ, Smith GT, Hess S, Czerwieniec G, Loo JA, Deshaies RJ, Beauchamp JL. Click Chemistry Facilitates Formation of Reporter Ions and Simplified Synthesis of Amine-Reactive Multiplexed Isobaric Tags for Protein Quantification. J Am Chem Soc. 2012;134(5):2672–2680. doi: 10.1021/ja2099003. [DOI] [PMC free article] [PubMed] [Google Scholar]; (b) Dephoure N, Gygi SP. Hyperplexing: A Method for Higher-Order Multiplexed Quantitative Proteomics Provides a Map of the Dynamic Response to Rapamycin in Yeast. Science Signaling. 2012;5(217) doi: 10.1126/scisignal.2002548. [DOI] [PMC free article] [PubMed] [Google Scholar]
- 7.(a) Han HL, Pappin DJ, Ross PL, McLuckey SA. Electron transfer dissociation of iTRAQ labeled peptide ions. Journal of Proteome Research. 2008;7(9):3643–3648. doi: 10.1021/pr8001113. [DOI] [PMC free article] [PubMed] [Google Scholar]; (b) Phanstiel D, Zhang Y, Marto JA, Coon JJ. Peptide and protein quantification using iTRAQ with electron transfer dissociation. Journal of the American Society for Mass Spectrometry. 2008;19(9):1255–1262. doi: 10.1016/j.jasms.2008.05.023. [DOI] [PMC free article] [PubMed] [Google Scholar]; (c) Phanstiel D, Unwin R, McAlister GC, Coon JJ. Peptide Quantification Using 8-Plex Isobaric Tags and Electron Transfer Dissociation Tandem Mass Spectrometry. Analytical Chemistry. 2009;81(4):1693–1698. doi: 10.1021/ac8019202. [DOI] [PMC free article] [PubMed] [Google Scholar]; (d) Viner RI, Zhang T, Second T, Zabrouskov V. Quantification of post-translationally modified peptides of bovine alpha-crystallin using tandem mass tags and electron transfer dissociation. Journal of Proteomics. 2009;72(5):874–885. doi: 10.1016/j.jprot.2009.02.005. [DOI] [PubMed] [Google Scholar]
- 8.Makarov A, Denisov E, Lange O. Performance Evaluation of a High-field Orbitrap Mass Analyzer. Journal of the American Society for Mass Spectrometry. 2009;20(8):1391–1396. doi: 10.1016/j.jasms.2009.01.005. [DOI] [PubMed] [Google Scholar]
- 9.Ting L, Rad R, Gygi SP, Haas W. MS3 eliminates ratio distortion in isobaric multiplexed quantitative proteomics. Nature Methods. 2011;8(11):937–940. doi: 10.1038/nmeth.1714. [DOI] [PMC free article] [PubMed] [Google Scholar]
- 10.Villen J, Gygi SP. The SCX/IMAC enrichment approach for global phosphorylation analysis by mass spectrometry. Nature Protocols. 2008;3(10):1630–1638. doi: 10.1038/nprot.2008.150. [DOI] [PMC free article] [PubMed] [Google Scholar]
- 11.Rappsilber J, Ishihama Y, Mann M. Stop and go extraction tips for matrix-assisted laser desorption/ionization, nanoelectrospray, and LC/MS sample pretreatment in proteomics. Analytical Chemistry. 2003;75(3):663–670. doi: 10.1021/ac026117i. [DOI] [PubMed] [Google Scholar]
- 12.(a) McAlister GC, Jedrychowski M, Yu Y, Ting L, Huttlin EL, Rad R, Haas W, Gygi SP. In Isolating multiple MS2 fragments using waveforms with multiple frequency notches improves MS3 sensitivity ~8 fold over standard MS3-based TMT methods; 60th annual conference of the American Society of Mass Spectrometry, Vancouver, Canada; Vancouver, Canada. 2012. [Google Scholar]; (b) Wenger CD, Lee MV, Hebert AS, McAlister GC, Phanstiel DH, Westphall MS, Coon JJ. Gas-phase purification enables accurate, multiplexed proteome quantification with isobaric tagging. Nature Methods. 2011;8(11):933–935. doi: 10.1038/nmeth.1716. [DOI] [PMC free article] [PubMed] [Google Scholar]
- 13.Eng JK, McCormack AL, Yates JR. An approach to correlate tandem mass-spectral data of peptides with amino-acid-sequences in a protein database. Journal of the American Society for Mass Spectrometry. 1994;5(11):976–989. doi: 10.1016/1044-0305(94)80016-2. [DOI] [PubMed] [Google Scholar]
- 14.Elias JE, Gygi SP. Target-decoy search strategy for increased confidence in large-scale protein identifications by mass spectrometry. Nature Methods. 2007;4(3):207–214. doi: 10.1038/nmeth1019. [DOI] [PubMed] [Google Scholar]
- 15.Makarov A, Denisov E. Dynamics of Ions of Intact Proteins in the Orbitrap Mass Analyzer. Journal of the American Society for Mass Spectrometry. 2009;20(8):1486–1495. doi: 10.1016/j.jasms.2009.03.024. [DOI] [PubMed] [Google Scholar]
- 16.Benjamini Y, Hochberg Y. Controlling the False Discovery Rate: a Practical and Powerful Approach to Multiple Testing. J Royal Stat Soc Series B. 1995;57(1):289–300. [Google Scholar]
- 17.Makarov A, Denisov E, Kholomeev A, Baischun W, Lange O, Strupat K, Horning S. Performance evaluation of a hybrid linear ion trap/orbitrap mass spectrometer. Analytical Chemistry. 2006;78(7):2113–2120. doi: 10.1021/ac0518811. [DOI] [PubMed] [Google Scholar]
- 18.(a) Peterson AC, McAlister GC, Quarmby ST, Griep-Raming J, Coon JJ. Development and Characterization of a GC-Enabled QLT-Orbitrap for High-Resolution and High-Mass Accuracy GC/MS. Analytical Chemistry. 2010;82(20):8618–8628. doi: 10.1021/ac101757m. [DOI] [PubMed] [Google Scholar]; (b) Hofstadler SA, Bruce JE, Rockwood AL, Anderson GA, Winger BE, Smith RD. Isotopic beat patterns in fourier-transform ion-cyclotron resonance mass-spectrometry – implications for high-resolution mass measurements of large biopolymers. International Journal of Mass Spectrometry and Ion Processes. 1994;132(1–2):109–127. [Google Scholar]; (c) Easterling ML, Amster IJ, van Rooij GJ, Heeren RMA. Isotope beating effects in the analysis of polymer distributions by Fourier transform mass spectrometry. Journal of the American Society for Mass Spectrometry. 1999;10(11):1074–1082. [Google Scholar]; (d) Bresson JA, Anderson GA, Bruce JE, Smith RD. Improved isotopic abundance measurements for high resolution Fourier transform ion cyclotron resonance mass spectra via time-domain data extraction. Journal of the American Society for Mass Spectrometry. 1998;9(8):799–804. [Google Scholar]; (e) Xu Y, Heilier JF, Madalinski G, Genin E, Ezan E, Tabet JC, Junot C. Evaluation of Accurate Mass and Relative Isotopic Abundance Measurements in the LTQ-Orbitrap Mass Spectrometer for Further Metabolomics Database Building. Analytical Chemistry. 2010;82(13):5490–5501. doi: 10.1021/ac100271j. [DOI] [PubMed] [Google Scholar]; (f) Erve JCL, Gu M, Wang YD, DeMaio W, Talaat RE. Spectral Accuracy of Molecular Ions in an LTQ/Orbitrap Mass Spectrometer and Implications for Elemental Composition Determination. Journal of the American Society for Mass Spectrometry. 2009;20(11):2058–2069. doi: 10.1016/j.jasms.2009.07.014. [DOI] [PubMed] [Google Scholar]; (g) Weber RJM, Southam AD, Sommer U, Viant MR. Characterization of Isotopic Abundance Measurements in High Resolution FT-ICR and Orbitrap Mass Spectra for Improved Confidence of Metabolite Identification. Analytical Chemistry. 2011 doi: 10.1021/ac2001803. null-null. [DOI] [PubMed] [Google Scholar]
- 19.(a) Su AI, Wiltshire T, Batalov S, Lapp H, Ching KA, Block D, Zhang J, Soden R, Hayakawa M, Kreiman G, Cooke MP, Walker JR, Hogenesch JB. A gene atlas of the mouse and human protein-encoding transcriptomes. Proc Natl Acad Sci USA. 2004;101(16):6062–7. doi: 10.1073/pnas.0400782101. [DOI] [PMC free article] [PubMed] [Google Scholar]; (b) Kislinger T, Cox B, Kannan A, Chung C, Hu P, Ignatchenko A, Scott MS, Gramolini AO, Morris Q, Hallett MT, Rossant J, Hughes TR, Frey B, Emili A. Global survey of organ and organelle protein expression in mouse: combined proteomic and transcriptomic profiling. Cell. 2006;125(1):173–86. doi: 10.1016/j.cell.2006.01.044. [DOI] [PubMed] [Google Scholar]
- 20.Xiang F, Ye H, Chen RB, Fu Q, Li LJ. N, N-Dimethyl Leucines as Novel Isobaric Tandem Mass Tags for Quantitative Proteomics and Peptidomics. Analytical Chemistry. 2010;82(7):2817–2825. doi: 10.1021/ac902778d. [DOI] [PMC free article] [PubMed] [Google Scholar]
- 21.Pichler P, Kocher T, Holzmann J, Mazanek M, Taus T, Ammerer G, Mechtler K. Peptide Labeling with Isobaric Tags Yields Higher Identification Rates Using iTRAQ 4-Plex Compared to TMT 6-Plex and iTRAQ 8-Plex on LTQ Orbitrap. Analytical Chemistry. 2010;82(15):6549–6558. doi: 10.1021/ac100890k. [DOI] [PMC free article] [PubMed] [Google Scholar]
Associated Data
This section collects any data citations, data availability statements, or supplementary materials included in this article.