Abstract
The cAMP-protein kinase A (PKA) signaling pathway is involved in regulating the release of transmitters from neurons and other cells. Multiple phosphodiesterase (PDE) isoforms regulate this pathway, however, the pattern of isoform expression and stimulus response across tissues has not been fully characterized.
Using fluorescent resonance energy transfer (FRET)-based imaging in primary superior cervical ganglia (SCG) neurons and real-time qPCR, we explored the role of PDE3 and PDE4 isoforms and oxygen tension in the activation of PKA and changes in gene expression. These primary neurons were infected with an adenovirus containing A-Kinase activity reporter (AKAR3) and assayed for responses to PDE inhibitors: rolipram (ROL, 1 μM), milrinone (MIL, 10 μM) and IBMX (100 μM), and adenylyl cyclase activator forskolin (FSK, 50 m M). Different PDE activity patterns were observed in different cells: high PDE4 activity (n = 3), high PDE3 activity (n = 3) and presence of activity of other PDEs (n = 3). Addition of PKA inhibitor H89 (10 μM) completely reversed the response. We further studied the effect of oxygen in the PKA activity induced by PDE inhibition. Both normoxia (20%O2/5%CO2) and hypoxia (0%O2/5%CO2) induced a similar increase in the FRET emission ratio (14.5 ± 0.8 and 14.7 ± 0.8, respectively).
PDE3a, PDE4b and PDE4d isoforms mRNAs were highly expressed in the whole SCG with no modulation by hypoxia.
Conclusion: Using a FRET-based PKA activity sensor, we show that primary SCG neurons can be used as a model system to dissect the contribution of different PDE isoforms in regulating cAMP/PKA signaling. The differential patterns of PDE regulation potentially represent subpopulations of ganglion cells with different physiological functions.
Keywords: Superior cervical ganglia (SCG), Phosphodiesterases (PDE), Cyclic AMP (cAMP), Hypoxia, Protein kinase A (PKA)
39.1 Introduction
Cyclic AMP is a ubiquitous second messenger involved in synaptic transmission and signal transduction. The levels of cAMP are regulated by the synthetic activity of adenylate cyclases (AC) and by the hydrolytic activity of phosphodiesterases (PDE); the latter determines the intracellular concentration of cAMP (Bender and Beavo 2006). Thus, PDEs have become important targets of study in the past years and have been pursued as therapeutic targets (Bender and Beavo 2006). There are 11 PDE isoforms that differ in their affinity for cAMP and/or cGMP and inhibitors, and in their responses to modulators (Bender and Beavo 2006).
Superior cervical ganglion (SCG) has a key role in the sympathetic nervous system and sends neuronal projections to the carotid body (CB) controlling the vascular tone. We have recently observed that acute hypoxia decreased cAMP levels induced by PDE inhibitors in these ganglia, an opposite effect to that observed in the CB (Nunes et al. 2010).
The aim of this work is to characterize the role of PDE3 and PDE4 regulation on cAMP/PKA activity in the SCG under different oxygen concentrations. We also wanted to explore whether the effect of hypoxia observed in cAMP production induced by IBMX is translated into apparent changes in PKA activity in primary SCG neurons.
To answer these questions we investigated the effect of PDE inhibitors on the activation of PKA in dissociated SCG neurons using fluorescence resonance energy transfer (FRET)-based imaging and studied the expression of PDE3 and PDE4 and their regulation by oxygen in the whole SCG by quantitative RT-PCR.
39.2 Methods
39.2.1 Surgical Procedures
The experiments were performed using SCGs isolated from Sprague–Dawley rats (Charles River Laboratories, Wilmington, MA) of both sexes at postnatal days 5–9. The Animal Care and Use Committee at the Johns Hopkins University School of Medicine approved all experimental protocols. The animals were anesthetized briefly with isoflurane and immediately decapitated. The carotid bifurcation was isolated and the SCG dissected and cleaned of surrounding connective tissue under a dissecting microscope. The tissues removed were further prepared as follows.
39.2.2 Measurement of Protein Kinase A (PKA) Activity in Primary Superior Cervical Ganglia Neurons by FRET
SCGs were mechanically and enzymatically dissociated with an enzyme mixture consisting of trypsin and collagenase (∼0.5 mg/ml). SCG cells were plated on poly-D-Lysine and laminin coated imaging dishes and cultured for 2–4 days in neurobasal-A supplemented with NGF and Ara-C (10 μM). To monitor PKA activity, we infected the SCG neurons with an adenovirus containing a 3 rd-generation of a genetically encoded A-Kinase activity reporter (AKAR3) for 24 h.
In one set of experiments we imaged the SCG neurons at 37 °C and sequentially treated them with rolipram (ROL, specific PDE4 inhibitor, 1 μM), milrinone (MIL, specific PDE3 inhibitor, 10 μM), IBMX (non-specific inhibitor, 100 μM), Forskolin (FSK, transmembrane adenylylcyclase activator, 50 μM) and H89 (PKA inhibitor, 10 μM).
In another set of experiments, we placed the imaging dish into a chamber (Warner Instruments) to allow superfusion of the cells with a constant flow rate of 2 ml/min (Ismatec, Cole Parmer instrument) with Kreb's modified solution containing (in mM): NaCl 116, NaHCO3 24, KCl 5, CaCl2 2, MgCl2 1.1, Hepes 10, Glucose 5.5 and adjusted to pH 7.40 (Perez-Garcia et al. 1990), equilibrated either with normoxia (20%O2/5%CO2) or hypoxia (0–5%O2/5%CO2) in the presence or absence of IBMX (100 μM).
The cells were imaged on a Zeiss Axiovert 200 M microscope (Carl Zeiss) with a 40× oil immersion objective and a cooled charge-coupled device camera (Roper Scientific) controlled by Metafluor 6.2 software (Molecular Devices). Dual emission ratio imaging used a 420DF20 excitation filter, a 450DRLP dichroic mirror and two emission filters (475DF40 for cyan fluorescent protein (CFP) and 535DF25 for yellow fluorescent protein (YFP)). Exposure time was 50–500 ms and images were acquired every 20 s. Background correction of the fluorescence images was performed by subtracting auto fluorescent intensities of regions of the imaging dish with no cells. Graph curves were normalized by setting the emission ratio at baseline (before the addition of any drugs) as equal to one.
39.2.3 PDE mRNA Gene Expression and Regulation
In one set of experiments we compared PDE3 and PDE4 gene expression levels in the whole SCG. The tissues were isolated (3 rats per condition; n = 3 independent experiments), quick-frozen on dry ice and stored at −80 °C.
In another set of experiments, we studied the effect of changes in oxygen tension on the expression of PDE3 and PDE4 in the whole SCG. Tissues were pre-incubated in a 37 °C shaker bath for 30 min in Kreb's modified medium equilibrated with 20%O2/5%CO2 (normoxia). After the pre-incubation period, tissues were incubated in a fresh incubation medium, equilibrated in normoxia, hypoxia (5%O2/5%CO2) or hyperoxia (60%O2/5%CO2) for 60 min. Tissues were quick-frozen on dry ice and stored at −80 °C.
Frozen tissues were processed to obtain total RNA (about 1 μg, micro-to-Midi Total RNA Purification, Invitrogen) that was used for first-strand cDNA synthesis using an iSCRIPt cDNA synthesis kit (Bio-Rad Laboratories). The primer sequences used were: forward 5′-GTGGCCGTATTCTGAGCCAGGTG-3′ and reverse 5′-GCTGTGTTGTGAGATACCACACGGC-3′ for PDE3a, forward 5′-CGACCAATTCCTGGCTTACAGCAGC-3′ and reverse 5′- GCAGGAATG-TTTGAAGACAGGCAGCC-3′ for PDE3b, forward 5′-CCTGCACGCAGCGGATGTGC-3′ and reverse 5′-GGAACTGGTTGGAG-ACGCCAGG-3′ for PDE4a, forward 5′-CCTGGCTGCCAT-TTTTGCAGC-TGC-3′ and reverse 5′-GAGCTTGAATCCCACAGCGAGGTG-3′ for PDE4b, forward 5′-CCAGGAGGAGCAGCTGGCTAAG-3′ and reverse 5′- CACGTTGGAGTGGTAGTGCCCTTC-3′ for PDE4c, forward 5′- GCG-GAGCTGTCTGGCAACCG-3′ and reverse 5′- GACTGGACGACATCTG-CAGCATGG-3′ for PDE4d, and forward 5′- GATGGCCTTCTACCCG-AAGACACC-3′ and reverse 5′- GCCAGCTACATAGGAGTTACGGGC-3′ for G6PDH.
qRT-PCR was performed with a MyiQ iCycler qRT-PCR system (Bio-Rad Laboratories) with Syber Green detection. qRT-PCR conditions were: 5 min at 95 °C, followed by 40 cycles at 95 °C for 20 s, 60 °C for 20 s, 72 °C for 20 s, a terminal extension period (72 °C, 10 min) and a melting curve with 0.5 °C increments in temperature. Product formation during the exponential phase of the reaction was analyzed for relative quantification to the reference gene based on the threshold cycle (C T) for amplification as 2(ΔCT), where ΔCT = CT,reference − CT,target.
39.3 Results
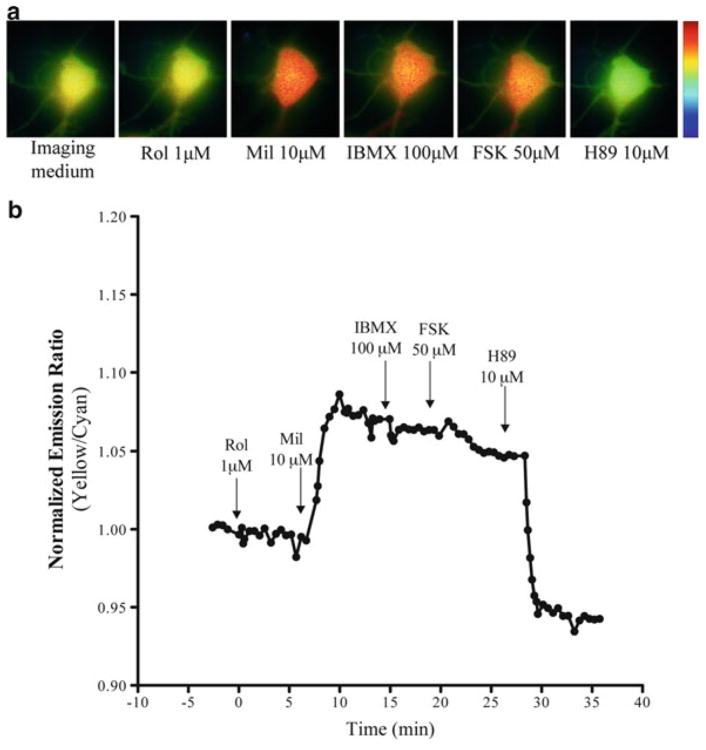
We investigated the role of PDE3 and PDE4 on the activation of PKA in primary SCG neurons using FRET-based imaging. Figure 39.1 shows a representative response in a SCG neuron induced by sequential addition of specific and non-specific PDE inhibitors. While ROL did not induce a change in emission ratio (ΔER), Mil induced an increase in ΔER with no further changes with IBMX and FSK. Addition of H89 (10 μM) completely reversed the response. This pharmacological pro file suggests that there is high PDE3 activity in this neuron. However, this pattern was not consistent in all SCG neurons. PDE inhibitors differentially modulated PKA activity, suggesting that there are subpopulations of SCG neurons with different PDE activity patterns.
Fig. 39.1.
(a) Pseudocolor images (400×) and (b) representative response curve of AKAR3 to rolipram (Rol, 1 μM), milrinone (Mil, 10 μM), IBMX (100 μM), FSK (50 μM) and H89 (10 μM) in a SCG neuron
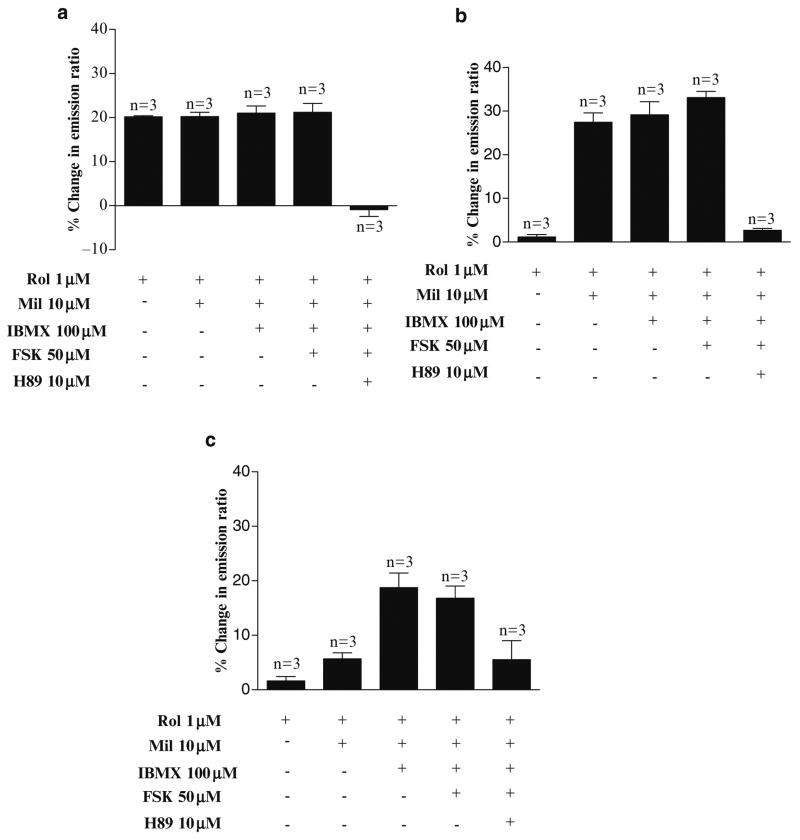
Figure 39.2 shows the profiles of PDE3 and PDE4 activity in regulating PKA in different SCG neurons: 1) high PDE4 activity with 20.0 ± 0.4% ΔER in response to ROL with no further increase with MIL, IBMX and FSK (n = 3, Fig. 39.2a), 2) high PDE3 activity with 1.9 ± 0.6% ΔER in response to ROL and 19.0 ± 7.2% ΔER to MIL with no further increase with IBMX and FSK (n = 3, Fig. 39.2b), and 3) activity of other PDEs than PDE3/PDE4, with 1.6 ± 0.8% ΔER in response to ROL, 5.7 ± 1.1% in response to MIL and 18.7 ± 2.7% in response to IBMX and no further increase in the presence of FSK (n = 3, Fig. 39.2c). Addition of H89 reversed the response in all neurons (Fig. 39.2).
Fig. 39.2.
Heterogenous responses in PKA activity induced by PDE inhibitors in SCG neurons. Composite data showing different response patterns of AKAR3 induced by PDE inhibitors, within a population of SCG neurons. SCG neurons containing (a) high PDE4 activity, (b) high PDE3 activity, and c) activity from other PDEs than PDE3 and PDE4. Values represent means ± SEM
To determine whether oxygen tension modifies PKA activity by affecting PDE activity, we perfused SCG neurons with Kreb's modified solution in the presence and absence of IBMX (100 μM) equilibrated either with normoxia or hypoxia.
ΔER increased as a consequence of perfusion with IBMX in normoxia and this effect was completely reversible after washout. No differences were observed in the ΔER between normoxia and hypoxia in the presence of IBMX (14.5 ± 0.8 ΔER and 14.7 ± 0.8 ΔER, respectively, n = 10).
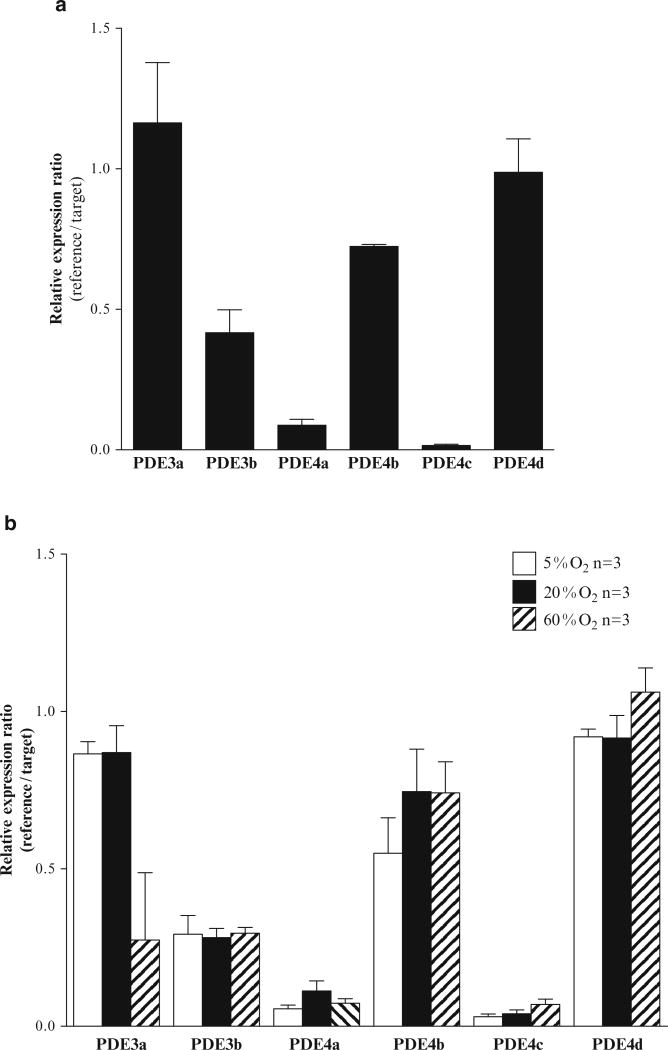
We further characterized the gene expression of the PDE3a-b and PDE4a-d isoforms in the whole SCG. Even though all isoforms were expressed in the SCG: PDE3a, PDE4b and PDE4d were the most abundant (Fig. 39.3). This pattern of expression was similar in SCG incubated with control oxygen concentrations (hypoxia, normoxia and hyperoxia) (Fig. 39.3b) and those that were quick frozen without incubations (Fig. 39.3a). Exposing SCGs with different percentages of oxygen did not significantly modulate PDE expression (Fig. 39.3b).
Fig. 39.3.
Effect of different oxygen concentrations on PDE3 and PDE4 isoform gene expression in the whole superior cervical ganglia (SCG). (a) PDE3a-b and PDE4a-d isoform expression levels and their (b) regulation by hypoxia (5%O2), normoxia (20%O2) and hyperoxia (60%O2)
39.4 Discussion
In this work, we characterized the PDE3 and PDE4 expression in the SCG and investigated the role of these PDE isoforms in the activation of PKA in ganglion neurons. We demonstrated that FRET-based imaging could be used to study the contribution of PDE isoforms in the regulation of cAMP/PKA signaling in primary SCG neurons as a model system. We observed differential patterns of PDE regulation in subpopulations of SCG neurons, which can potentially represent those subpopulations with different physiological functions. The level of oxygen tension did not modulate PDE expression and did not change the effect of PDE inhibition in the PKA activity.
SCG contains subpopulations of sympathetic neurons (secreto-, pilo-, vasomotor neurons), which receive input from the cervical sympathetic pre-ganglionic nerve fibers and provides innervations of the neck and head structures (Asamoto 2005). Each subpopulation of neurons projects exclusively to specific targets (Li and Horn 2006), which could explain the differences in PDE regulating PKA activity between SCG neurons described in our work.
We identified for the first time PDE3 and PDE4 mRNA expression patterns in the SCG. This finding adds to the literature by identifying PDE3 isoforms in this ganglion and is consistent with previous reports that characterize PDE4 by the effects of their specific inhibitors (Giorgi et al. 1994; Lakics et al. 2010; Li and Horn 2006; Nunes et al. 2010). We found that PDE3a, PDE4b and PDE4d were the most abundant isoforms in the SCG. It has been shown that these isoforms are highly expressed in specific tissues: PDE3a in the heart, PDE4b in the CNS and PDE4d in the muscle (Lakics et al. 2010).
We had previously observed that acute hypoxia induced a decrease in cAMP levels in the presence of the non-specific PDE inhibitor, IBMX and specific PDE2 and PDE4 inhibitors, in whole SCG of adult Wistar rats (Nunes et al. 2010). In the present work, hypoxia did not modulate either the levels of gene expression or PDE inhibition induced PKA activity. Taken together, these findings suggest that changes in IBMX-induced cAMP accumulation caused by changing oxygen concentrations are not translated into changes in PKA activity. No effect of oxygen tension on changes in PKA activity could be due to saturation of PKA activity under high levels of cAMP caused by the PDE inhibition. Further experiments will test whether changes in oxygen concentrations directly modify PDE activity.
The results suggest selective distribution of PDE3a, PDE4b and PDE4d isoforms in subpopulations of ganglion cells that potentially represent subpopulations with different physiological functions.
Acknowledgments
A.R. Nunes was supported by the Portuguese Fundacao de Ciencia e Tecnologia (FCT, SFRH/BD/39473/2007). This work is also supported by NIH R01 DK073368 (to JZ) and HL082846 (to YKX).
Contributor Information
Ana Rita Nunes, Department of Pediatrics, Johns Hopkins University, School of Medicine, CMSC 6-104, 600 N. Wolfe Street, Baltimore, MD 21287-3200, USA aritanunes@gmail.com; CEDOC, Departamento de Farmacologia, Faculdade de Ciências Médicas, Universidade NOVA de Lisboa, Lisbon, Portugal.
Vedangi Sample, Department of Pharmacology and Molecular Sciences, Johns Hopkins University, School of Medicine, 725 N. Wolfe Street, Hunterian 307, Baltimore, MD 21205, USA.
Yang K. Xiang, Department of Molecular and Integrative Physiology, University of Illinois at Urbana, Urbana, IL, USA
Emília C. Monteiro, CEDOC, Departamento de Farmacologia, Faculdade de Ciências Médicas, Universidade NOVA de Lisboa, Campo Mártires da Pátria 130, 1169-056, Lisbon, Portugal
Estelle Gauda, Department of Pediatrics, Johns Hopkins University, School of Medicine, CMSC 6-104, 600 N. Wolfe Street, Baltimore, MD 21287-3200, USA, egauda@mail.jhmi.edu.
Jin Zhang, Department of Pharmacology and Molecular Sciences, Johns Hopkins University, School of Medicine, 725 N. Wolfe Street, Hunterian 307, Baltimore, MD 21205, USA; Department of Neuroscience and Oncology, Johns Hopkins University, School of Medicine, Baltimore, MD, USA jzhang32@jhmi.edu.
References
- Asamoto K. Network of the sympathetic nervous system: focus on the input and output of the cervical sympathetic ganglion. Anat Sci Int. 2005;80:132–140. doi: 10.1111/j.1447-073x.2005.00107.x. [DOI] [PubMed] [Google Scholar]
- Bender AT, Beavo JA. Cyclic nucleotide phosphodiesterases: molecular regulation to clinical use. Pharmacol Rev. 2006;58:488–520. doi: 10.1124/pr.58.3.5. [DOI] [PubMed] [Google Scholar]
- Giorgi M, Squitti R, Bonsi P, Paggi P, Toschi G. Activities of 3′5′ cyclic nucleotide phophodiesterases in the superior cervical ganglion of rat: characterization, compartmentalization and observation in young and old animals. Neurochem Int. 1994;25(5):493–500. doi: 10.1016/0197-0186(94)90026-4. [DOI] [PubMed] [Google Scholar]
- Lakics V, Karran EH, Boess FG. Quantitative comparison of phosphodiesterase mRNA distribution in human brain an peripheral tissues. Neuropharmacol. 2010;59:367–374. doi: 10.1016/j.neuropharm.2010.05.004. [DOI] [PubMed] [Google Scholar]
- Li C, Horn JP. Physiological classification of sympathetic neurons in the rat SCG. J Neurophysiol. 2006;95:187–195. doi: 10.1152/jn.00779.2005. [DOI] [PubMed] [Google Scholar]
- Nunes AR, Batuca JR, Monteiro EC. Acute hypoxia modifies cAMP levels induced by inhibitors of phosphodiesterase-4 in rat carotid bodies, carotid arteries and superior cervical ganglia. Br J Pharmacol. 2010;159:353–361. doi: 10.1111/j.1476-5381.2009.00534.x. [DOI] [PMC free article] [PubMed] [Google Scholar]
- Perez-Garcia MT, Almaraz L, Gonzalez C. Effects of different types of stimulation on cyclic AMP content in the rabbit carotid body: functional significance. J Neurochem. 1990;55:1287–1293. doi: 10.1111/j.1471-4159.1990.tb03137.x. [DOI] [PubMed] [Google Scholar]


