

Abstract
OBJECTIVES
The theoretical differences in energy losses as well as coronary flow with different band sizes for branch pulmonary arteries (PA) in hypoplastic left heart syndrome (HLHS) remain unknown. Our objective was to develop a computational fluid dynamic model (CFD) to determine the energy losses and pulmonary-to-systemic flow rates. This study was done for three different PA band sizes.
METHODS
Three-dimensional computer models of the hybrid procedure were constructed using the standard commercial CFD softwares Fluent and Gambit. The computer models were controlled for bilateral PA reduction to 25% (restrictive), 50% (intermediate) and 75% (loose) of the native branch pulmonary artery diameter. Velocity and pressure data were calculated throughout the heart geometry using the finite volume numerical method. Coronary flow was measured simultaneously with each model. Wall shear stress and the ratio of pulmonary-to-systemic volume flow rates were calculated. Computer simulations were compared at fixed points utilizing echocardiographic and catheter-based metric dimensions.
RESULTS
Restricting the PA band to a 25% diameter demonstrated the greatest energy loss. The 25% banding model produced an energy loss of 16.76% systolic and 24.91% diastolic vs loose banding at 7.36% systolic and 17.90% diastolic. Also, restrictive PA bands had greater coronary flow compared with loose PA bands (50.2 vs 41.9 ml/min). Shear stress ranged from 3.75 Pascals with restrictive PA banding to 2.84 Pascals with loose banding. Intermediate PA banding at 50% diameter achieved a Qp/Qs (closest to 1) at 1.46 systolic and 0.66 diastolic compared with loose or restrictive banding without excess energy loss.
CONCLUSIONS
CFD provides a unique platform to simulate pressure, shear stress as well as energy losses of the hybrid procedure. PA banding at 50% provided a balanced pulmonary and systemic circulation with adequate coronary flow but without extra energy losses incurred.
Keywords: Hypoplastic left heart syndrome, Computational fluid dynamics, Navier–Stokes equations, Haemodynamics, Simulations
INTRODUCTION
Hypoplastic left heart syndrome (HLHS) remains a high-risk palliation with ongoing refinement in surgical technique, perioperative care and medical management [1, 2]. Recently, the hybrid procedure has been considered a suitable alternative to the Norwood procedure. While the hybrid procedure is a much less complex technical undertaking compared with the Norwood procedure, some institutions have reserved the hybrid procedure for the sickest of HLHS [3]. There is no significant advantage of one procedure over the other, but it is difficult to systematically compare management strategies for patients with HLHS due to the multitude of clinical confounders including surgeon selection bias and patient pathophysiological variables [4].
Computational fluid dynamics (CFD) has been used to study haemodynamic effects such as energy losses and oxygen perfusion rates in single ventricle hearts [5–7]. In this study, we utilize computational fluid dynamic modelling of the hybrid procedure to determine potential energy losses as well as coronary flows for the hybrid procedure using different pulmonary band sizes. The focus of the models was on the pressure loss of the fluid system from the entrance to the various exits of the heart. The elements of heart models were fixed for each banding size. Isolating the effect of the banding size was the primary goal of the research.
METHODS
In this study, CFD modelled the fluid mechanical properties of blood pumping through a HLHS circuit after the hybrid procedure was performed. The mathematical models solved for pressure and velocity across the heart to monitor pressure losses. These losses come from changes in fluid velocity through a change in area or curvature of the surroundings and from wall shear stress or friction. Different heart procedures can be compared for energy efficiency if the pressure loss from the same two points in the procedures is measured and the volume flow rate is the same within all. By fixing the blood volume flow rate and the pressure at various outlet points of the heart models, the most efficient model will be the one that needs the least amount of pressure at the right ventricle to deliver the same amount of blood volume flow rate through the ductal arch. The more pressure losses incurred, the harder the heart has to beat to maintain the same flow rate, which makes the system less efficient.
In order to determine the energy efficiency of the heart, the pressure and velocity must be solved for. This is accomplished by solving a set of highly non-linear partial differential equations, known as the Navier–Stokes [8]. They are derived from the basic principles of physics such as conservation of mass, momentum and energy. The energy equation is usually coupled into the Navier–Stokes equations, but since temperature data were not necessary in the study, it was left out to save on computational time. Numerical analysis is needed to come to an approximate solution to these equations because, as in most partial differential equations, they have no analytical or exact solutions.
CFD is a fast and efficient way to solve these equations numerically. Four different 3D CFD models representing three different pulmonary artery (PA) band sizes and an unbanded model were created. All these models had aortic valve atresia anatomically with no flow across the aortic valve. The unbanded PA model was the reference model. The three hybrid procedure cases restricted flow to the PA by restricting the diameter of branch PAs to 25 (restrictive), 50 and 75% (loose) from the unbanded PA. Everything else about the four models remained the same for robust comparison.
The models were created by taking the dimensions of the major blood vessels of the heart from averages found in published literature extrapolated from computed tomography, magnetic resonance, echocardiography and catheterization of real-time patient data [9–11]. Geometric data for the models can be found in Table 1. All four models had the same aorta diameter and length, and pulmonary artery diameter and length. The brachiocephalic vessels, the left subclavian artery, left carotid artery and innominate artery were all modelled the same to minimize anatomical variable confounding. The models also included the coronary artery ostia. Meshes of the models had ∼500 000 nodes and 1.2 million tetrahedral elements, which means pressure data among other fluid characteristics are available at 500 000 points throughout each model. A time step of 0.005 s was used. The commercial programme Gambit was used to create the geometry and mesh, and Fluent was used as the solver and post-processor.
Table 1:
Geometric parameters for all computational fluid dynamic simulation models
| Tricuspid valve (inlet) | 14 mm |
| Pulmonary artery | 5 mm |
| Left and right PA (four outlets) | 2 mm |
| Ascending aorta (outlet) | 2 mm |
| Left subclavian artery (outlet) | 6.5 mm |
| Left common carotid artery (outlet) | 5.1 mm |
| Brachiocephalic artery (outlet) | 4.8 mm |
| Coronary vessels (two outlets) | 0.5 mm |
| Density of blood | 1025 kg/m3 |
| Viscosity of blood | 0.00027 kg/(m-s) |
The simulations were run until the simulation reached a half a second, which was a full heart beat for an infant averaging 120 beats per minute. To collect data at end systole, the simulation was stopped at 0.25 s, when the pressure in the right ventricle was the highest. At 0.5 s, the heart returned to its initial pressure and the simulation was over. The blood pressure used was 9.332 kPa (70 mmHg) in systole and 5.333 kPa (40 mmHg) in diastole. Using the cosine function shown in equation (1) and Fig. 1, these pressures were set at the descending aorta and the branchiophalic vessels for all the models. Per simulation, this model behaved like HLHS with aortic atresia and retrograde flow across the arch. The pressure at the inlet was solved for each model to create a volume flow rate of 2000 ml/min throughout the heart and major vessels. It is understood that a constant flow rate in the heart is not physiological, but is a measure adopted simply for assessing the flow efficiencies associated with each procedure.
| (1) |
Figure 1:

Pressure contours in end systole. Pressure loss decreases as the banding decreases, providing the least amount of pressure loss for the no banding case.
The Fluent CFD programme utilizes the finite volume method to solve the conservation of mass and momentum equations of the Navier–Stokes equations. These equations describe the flow of a Newtonian fluid, which is a reasonable assumption given the large vessel size of the heart. Pressure and velocity data at each node of the mesh were calculated and used to derive pressure differences across the heart, as well as shear stress and flow rate to the systemic and pulmonary circulatory systems. These data were used to calculate the efficiency of each procedure.
We defined efficiency by the pressure drop from inlet to outlet of the HLHS model. This pressure loss is converted to a percentage by dividing the pressure loss by the inlet pressure.
The more the pressure decrease, or the higher the percent pressure loss, the more work the heart has to do to move the same amount of flow. For the four HLHS models, the pressure loss from the inlet of the model to the major vessel outlets is measured and compared.
The average shear stress of the heart wall was also calculated. The systemic-to-pulmonary flow ratio was calculated by measuring the volume flow rate through the pulmonary artery outlets and comparing it to the volume flow rate through the aorta and major vessel outlets. Finally, the volume flow rate going through the coronary arteries was also measured and compared with each PA model.
RESULTS
Restrictive PA banding (25% diameter) in the hybrid model produced the most quantum of pressure drop at 16.76% at systole. Pressure drop decreases as the effective PA become more patent. An increase in pressure losses was observed in the diastolic models when comparing them with the systolic models. This is due to the low pressure seen in the left ventricle as it maximally expands at the end of diastole. This low pressure induces a force on the fluid in the direction opposite to that in which the fluid is moving. This means the heart pump must work harder to maintain the same flow rate. The same pattern can be seen in the end-of-diastole cases where the pressure loss was 24.91% for the restrictive PA banding hybrid model. The efficiency of the heart as shown by the percent pressure loss is given in Table 2 for end systole. Table 3 also shows the shear stress, along with the ratio between pulmonary and systemic flow. Table 4 shows the flow rate into the coronary arteries for both systole and diastole for all the CFD models following banding and shunted Norwoods.
Table 2:
Pressures at outlets of all models
| mmHg | Pa | |
|---|---|---|
| Coronary artery | 70.46 | 9393.9 |
| LPA | 10.34 | 1378.5 |
| RPA | 10.56 | 1407.8 |
Table 3:
End systole losses for the various PA banding from restrictive (25%) to unbanded (100%)
| Systemic | Qp/Qs | Shear (Pa) | Pressure loss (%) |
|---|---|---|---|
| 0.25 Hybrid | 0.21 | 3.45 | 16.76 |
| 0.50 Hybrid | 1.46 | 3.12 | 7.58 |
| 0.75 Hybrid | 3.10 | 2.84 | 7.36 |
| 1.00 Hybrid | 3.97 | 3.75 | 5.16 |
Table 4:
Volume flow rate in ml/min for the coronary arteries during end systole (S) and diastole (D).
| Left coronary flow (S) | Right coronary flow (S) | Left coronary flow (D) | Right coronary flow (D) | |
|---|---|---|---|---|
| BTS3 | 16.5 | 16.4 | 94.8 | 95.4 |
| BTS3.5 | 8.6 | 9.1 | 103.6 | 102.3 |
| BTS4 | 27.4 | 27.8 | 110.6 | 111.9 |
| RVPA4 | 36.1 | 36.1 | 103.2 | 101.8 |
| RVPA5 | 36.1 | 36.1 | 100.1 | 99.5 |
| RVPA6 | 18.7 | 19.1 | 102.7 | 102.6 |
| H.25 (restrictive) | 50.1 | 49.3 | 142.1 | 139.8 |
| H.5 | 47.1 | 46.3 | 144.7 | 142.8 |
| H.75 (loose) | 41.9 | 40.7 | 146.8 | 142.8 |
| H unbanded | 39.1 | 38.9 | 121.6 | 120.9 |
RVPA 4–6: right ventricle to pulmonary artery shunt Norwood circulation at 4–6 mm shunt, respectively; BTS 3, 3.5 and 4: Blalock–Taussig shunt Norwood circulation at 3, 3.5 and 4 mm shunt, respectively; H: hybrid procedure.
For both end systole and end diastole models, the pressure loss decreases as the pulmonary artery diameter increases. This can be seen in Fig. 1, which illustrates the pressure contours for the various cases for end systole. This shows that more losses are accrued by the large aortic arch area than in turning into the PA. The change in area from the tricuspid valve to the aorta, and the turning of the blood flow from aortic arch to ascending aorta and the brachiocephalic vessels provide many opportunities for losses. Also, the larger surface area of the aorta compared with the PA provides a greater opportunity for shear stress to occur.
The correlation for shear stress in the hybrid model was less straightforward. Figure 2 highlights the shear stress contours in the hybrid. The unbanded model creates the most shear, most likely due to the increased area of the high shear stress within the PAs. This holds true for both end-systole and end-diastole cases, producing a shear of 3.75 and 3.55 Pa, respectively. Due to the low pressure in the right ventricle at end diastole, the flow will be slower than at end systole, which is why lower shear stress is seen at end diastole. The tighter the band, the more shear stress is produced in both the end-systole and end-diastole simulations. These findings provide a tentative observation that to minimize shear stress, the banding should be loose and maintain at least 75% of the pulmonary artery diameter (see Figs 3 and 4).
Figure 2:

Shear stress in end systole. The least amount of shear stress is in the 0.75 banding case.
Figure 3:
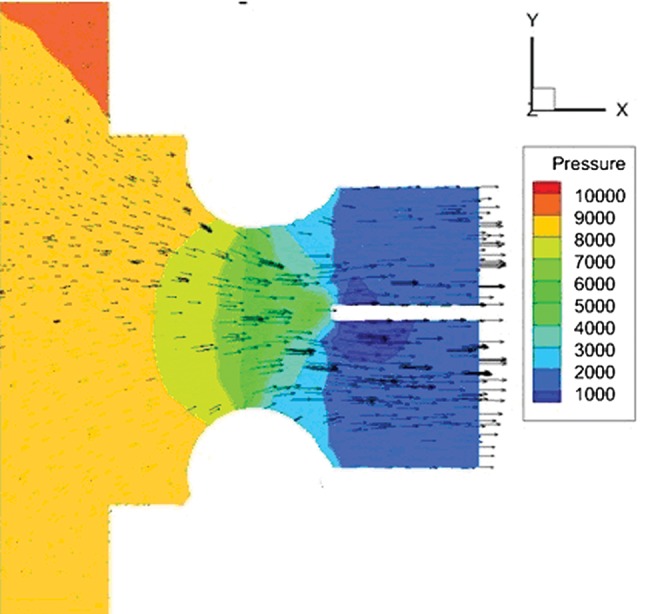
Velocity vectors in the PA in the 50% banding case. A large pressure drop can be seen in PA at the banding point due to increased flow velocity.
Figure 4:

Energy loss decreases as the PA banding is loosened. Qp:Qs: pulmonary to systemic flow ratio.
As the pulmonary banding becomes more restrictive, several changes occur in the flow. First, the overall area becomes less, creating less shear stress (Fig. 4). However, this creates a higher velocity at the banding point at which there is the highest shear stress (Fig. 3). Also with more restrictive banding, less flow is permitted, which creates less shear within the distal PA beyond the band, which allows more flow to the large surface area aorta, where the majority of shear occurs. This creates an interesting optimization problem in the case of minimizing shear within a certain Qp/Qs value.
It was difficult to find a correlation between banding and coronary flow. The general assumption is that higher diastolic pressures allow greater coronary perfusion; however, this has not been measured clinically and proven in patients. In a previous study, coronary flow was also measured in two Norwood procedures for HLHS. The hybrid procedure that produced the most amount of coronary flow was the hybrid model at 146.8 ml/min in end diastole compared with the Blalock–Taussig shunt at 110.6 ml/min and right ventricle to pulmonary artery shunt at 103.2 ml/min. However, a correlation between banding size and flow to coronaries remains difficult to determine. Measuring localized velocities and pressures closer to the coronaries could give more insight regarding the behaviour seen. Inaccuracies are possible, since the CFD model does not include the ventricular arterial valve (anatomical pulmonary valve) in the hybrid model.
DISCUSSION
In a newborn with HLHS, pulmonary blood flow is unrestricted. Initial intervention consists of placement of a pulmonary artery band and sustaining a patent ductus arteriosus. The extent of restricting the pulmonary artery bands remains difficult to estimate. Currently, most PA bands of size 3.5 mm diameter and further are restricted if there is clinical evidence of over circulation and if the patient tolerates it. The degree of restriction is measured post-band placement using either echocardiography typically with the gradient across the band or by angiography, typically with the orifice diameter metric at the band. However, despite many formulas and technological advances, perfect banding remains a rarity. Furthermore, reinterventions with adjusting the band further during the same admission are associated with morbidity and mortality [12].
The purpose of using CFD in this study was to help us to comprehend the energy losses during HLHS palliation. It may also allow us to better understand, and provide preliminary guidance when a restrictive vs loose band is chosen for each particular patient. The focus of this study was to understand flow across the heart with differential pulmonary artery banding only. We assumed that the ductus arteriosus remains unobstructive throughout the CFD simulations.
There are several aspects that must be taken into account when considering pressure drop in a fluid system. Shear stress plays a vital role, but it is not the only contributor to pressure drop. The velocity of fluid is also a contributor, with high-velocity fluid often contributing more shear, as well as turbulent effects. The smaller the area that the blood traverses, the greater velocity beyond. This is law of conservation of mass. Also, local losses from flow turning, accelerating or decelerating across the aortic arch contribute to pressure loss.
Comparing shear stress, velocities, pressure loss and coronary mass flow based on the degree of PA band restriction allowed us to provide preliminary data for each band size. While the pressure loss effects from the systemic circulation decreased as the pulmonary artery band was loosened, the total coronary flow (both in diastole and systole) decreased as well. Possible reasons suggest less shear stress with loose bands and more kinetic energy of blood in passing in a retrograde fashion across the arch into the coronary vessels. We noticed that pressure loss occurs when faster flow happens at the ductus, retrograde ascending aorta and descending aorta. Shear across the PA was minimal compared with that of the ductus, arch and descending aorta.
With the ongoing modifications of the hybrid procedure in clinical practice [13, 14] outcomes comparable to the traditional Norwood procedure have been attained.
Throughout these various interventions, the heart is continuously working to overcome the myriad of increased after-loads both at the pulmonary and systemic ends. Of note, the newborn's heart is immature. The majority of the myocardium is made of fibrous tissue and the remaining is contractile muscle tissue. The size of the heart is small, so a given stroke volume is ejected at maximal myocardial shortening. This is most likely, particularly when the contraction starts at a smaller volume in the newborn heart compared with the adult heart.
Upon PA banding, extra flow enters the ductus arteriosus as well as the ascending aorta. This explains the mechanisms behind increased systolic coronary mass flow with restrictive bands. While the majority of coronary flow occurs in diastole, restricting PA bands could significantly affect total coronary flow.
While restrictive bands increase energy losses as well as coronary mass flow in the face of reduced pulmonary blood flow, intermediate pulmonary bands exhibit intermediate coronary mass flow without excess energy loss. Though the exact clinical implications of energy loss remain elusive in the long term, loss of excess energy may be an unnecessary subclinical burden leading to reduced survival.
There is evidence that the single ventricle is already compromised biologically and structurally in HLHS [15]. In the case of the hybrid state, the energy losses persist until the comprehensive second stage, which in the hybrid model involves aortic arch reconstruction in addition to the superior cavopulmonary shunt. There is an undefined but definite event in time and within most biological systems when reversible changes lead to irreversible processes. When this occurs, the lasting health of the single ventricle will be definitely compromised and potentially lead to a failing ventricle. This is now observed with the Fontan circulation among its survivors worldwide.
Given that the growing child will need to preserve the most effective cardiac output of a single functional over its lifetime, further prevention of energy losses by optimizing their circulation at the time of palliation is warranted. Intuitively, preservation of energy in part will minimize the load on the ventricle and theoretically optimize its performance. Our study demonstrates that maximum efficiency is attained when banding 50% of the branch PA as well as allowing higher coronary flow in these models. If the patient with HLHS has poor cardiac function and a hybrid approach is contemplated, then restricting the pulmonary bands may not be the best option given the excess energy losses incurred.
While other sources of energy loss exist, our study did not measure energy losses in the form of friction and tension developed on the heart walls. Based on Laplace's law, loss of energy is greater when the newborn myocardium faces higher after-load. Further, we did not control for adaptation and growth and pliable blood vessels. These are areas to which further research using CFD should be dedicated.
While much can be learned from the models used in this investigation, despite the idealized geometry and boundary conditions, there are some limitations. The model assumes rigid walls, but in reality the heart walls and blood vessel walls stretch. Capturing the compliance and hysteretic behaviour of the walls would further account for the energy losses associated with these effects. Another omission of the models is the arterioventricular valve. Considering how fast the infant heart beats, opening and closing of the valves would do little to alter the order of the results, but would increase the accuracy of energy loss prediction for all models. When models of heart growth for each strategy become more sophisticated, they could be used to model energy losses over a period of time, thus accommodating for biological adaptation as well. The pulmonary circulation is a fragile fluid dynamic system and current computer simulation in this study was not able to model its sensitivity to systemic saturation. The lack of lung model as well as chest wall biomechanics in this study is a limitation when extrapolated to real-time Norwood circulation.
Overall, the purpose of this work was to raise questions about contemporary palliative procedures in HLHS and provide some computer simulation as a foundation to guide clinical banding of the PA.
CONCLUSION
The clinical inference from this study suggests that restrictive banding on the PA may be the most energy-efficient approach when considering the hybrid procedure, if tolerated. Providing loose banding also produces less shear stress on the heart walls. In order to produce systemic-to-pulmonary flow closer to 1, somewhere between 50% banding and 75% banding will likely be needed. The results from this study do not recommend the superiority of a specific PA banding size over another. There are other factors to consider when choosing a palliative strategy, such as oxygen flow to the brain, overall risk of the procedure and which procedure delivers the optimum systemic to pulmonary blood flow ratio.
Conflict of interest: none declared.
REFERENCES
- 1.Norwood WI, Lang P, Castaneda AR, Campbell DN. Experience with operations for hypoplastic left heart syndrome. J Thorac Cardiovasc Surg. 1981;85:511–9. [PubMed] [Google Scholar]
- 2.Ohye RG, Sleeper LA, Mahony L, Newburger JW, Pearson GD, Lu M Pediatric Heart Network Investigators. Comparison of shunt types in the Norwood procedure for single-ventricle lesions. N Engl J Med. 2010;362:1980–92. doi: 10.1056/NEJMoa0912461. doi:10.1056/NEJMoa0912461. [DOI] [PMC free article] [PubMed] [Google Scholar]
- 3.Galantowicz M, Cheatham JP, Phillips A, Cua CL, Hoffman TM, Hill SL, et al. Hybrid approach for hypoplastic left heart syndrome: intermediate results after the learning curve. Ann Thorac Surg. 2008;85:2063–70. doi: 10.1016/j.athoracsur.2008.02.009. discussion 2070–1 doi:10.1016/j.athoracsur.2008.02.009. [DOI] [PubMed] [Google Scholar]
- 4.Pigula FA, Vida V, Del Nido P, Bacha E. Contemporary results and current strategies in the management of hypoplastic left heart syndrome. Semin Thorac Cardiovasc Surg. 2007;19:238–44. doi: 10.1053/j.semtcvs.2007.07.002. doi:10.1053/j.semtcvs.2007.07.002. [DOI] [PubMed] [Google Scholar]
- 5.De Leval MR, Kilner P, Gewillig M, Bull C. Total cavopulmonary connection: a logical alternative to atriopulmonary connection for complex Fontan operations. J Thorac Cardiovasc Surg. 1988;96:682–95. [PubMed] [Google Scholar]
- 6.Bove EL, Migliavacca F, de Leval MR, Balossino R, Pennati G, Lloyd TR, et al. Use of mathematic modeling to compare and predict hemodynamic effects of the modified Blalock-Taussig and right ventricle pulmonary artery shunts for hypoplastic left heart syndrome. J Thorac Cardiovasc Surg. 2009;136:312–20. doi: 10.1016/j.jtcvs.2007.04.078. doi:10.1016/j.jtcvs.2007.04.078. [DOI] [PubMed] [Google Scholar]
- 7.Hsia TY, Migliavacca F, Pennati G, Balossino R, de Leval MR, Bradley SM, et al. Management of a stenotic right ventricle-pulmonary artery shunt early after the Norwood procedure. Ann Thorac Surg. 2009;88:830–7. doi: 10.1016/j.athoracsur.2009.05.051. doi:10.1016/j.athoracsur.2009.05.051. [DOI] [PubMed] [Google Scholar]
- 8.Anderson JD. Fundamentals of Aerodynamics. 4th edn. New York: McGraw Hill; 2005. [Google Scholar]
- 9.Walther FJ. Echocardiographic measurements in normal preterm and term neonates. Acta Paediatrica. 1986;75:536–68. doi: 10.1111/j.1651-2227.1986.tb10251.x. [DOI] [PubMed] [Google Scholar]
- 10.Woezik H, Klein HW. Growth of the internal diameters in the pulmonary arterial tree in infants and children. J Anat. 1987;151:107–15. [PMC free article] [PubMed] [Google Scholar]
- 11.Walther FJ. Pulsed Doppler determinations of cardiac output in neonates: normal standards for clinical use. Pediatrics. 1985;76:829–33. [PubMed] [Google Scholar]
- 12.Bradley SM, Simsic JM, Atz AM. The infant with single ventricle and excessive pulmonary blood flow: results of a strategy of pulmonary artery division and shunt. Ann Thorac Surg. 2002;74:805–10. doi: 10.1016/s0003-4975(02)03836-5. discussion 810 doi:10.1016/S0003-4975(02)03836-5. [DOI] [PubMed] [Google Scholar]
- 13.Takabayashi S, Shimpo H, Kajimoto M, Yokoyama K, Kado H, Mitani Y. Stage I bilateral pulmonary artery banding maintains systemic flow by prostaglandin E1 infusion or a main pulmonary artery to the descending aorta shunt for hypoplastic left heart syndrome. Interact CardioVasc Thorac Surg. 2005;4:352–5. doi: 10.1510/icvts.2004.095620. doi:10.1510/icvts.2004.095620. [DOI] [PubMed] [Google Scholar]
- 14.Mitani Y, Takabayashi S, Sawada H, Ohashi H, Hayakawa H, Ikeyama Y, et al. Fate of the opened arterial duct: lessons learned from bilateral pulmonary artery banding for hypoplastic left heart syndrome under the continuous infusion of prostaglandin E1. J Thorac Cardiovasc Surg. 2007;133:1653–4. doi: 10.1016/j.jtcvs.2007.01.053. doi:10.1016/j.jtcvs.2007.01.053. [DOI] [PubMed] [Google Scholar]
- 15.Colan SD. Ventricular function in volume overload lesions. In: Fogel MA, editor. Ventricular Function and Blood Flow in Congenital Heart Disease. Philadelphia: Blackwell; 2005. pp. 205–22. [Google Scholar]