Abstract
Superoxide dismutase (SOD, EC 1.15.1.1) is an important metal-containing antioxidant enzyme that provides the first line of defense against toxic superoxide radicals by catalyzing their dismutation to oxygen and hydrogen peroxide. SOD is classified into four metalloprotein isoforms, namely, Cu/Zn SOD, Mn SOD, Ni SOD and Fe SOD. The structural models of soybean SOD isoforms have not yet been solved. In this study, we describe structural models for soybean Cu/Zn SOD, Mn SOD and Fe SOD and provide insights into the molecular function of this metal-binding enzyme in improving tolerance to oxidative stress in plants.
Keywords: amino acid analysis, model evaluation, molecular modeling, phylogenetic analysis, superoxide dismutase (SOD)
Introduction
Crop plants are frequently exposed to a variety of abiotic, biotic and xenobiotic stresses that cause injury, limit their growth and adversely affect their productivity. The most common result of such stress is the production of toxic reactive oxygen species (ROS). Increased levels of ROS such as superoxide (O2•−), hydrogen peroxide (H2O2) and the hydroxyl radical (•OH) cause irreparable damage to cellular components such as DNA, proteins and lipids that require additional defense mechanisms (Blokhina et al., 2003). Plant responses to ROS toxicity involve the coordinated action of enzymatic and non-enzymatic antioxidant defense systems (Pallavi and Rama Shankar, 2005; Pallavi et al., 2012). Among enzymatic defenses, superoxide dismutase (SOD, EC 1.15.1.1) is the most important enzyme because of its distinct ability to neutralize superoxide anions by dismutating them into O2 and H2O2. SOD is synthesized by all aerobic organisms and also by some air-tolerant and obligate anaerobic organisms (Fink and Scandalios, 2002).
SODs are metalloproteins that occur in four isoforms: copper zinc SOD (Cu/Zn SOD), manganese SOD (Mn SOD), nickel SOD (Ni SOD) and iron SOD (Fe SOD), all of which are highly stable because of the β-barrel structure and low content of α-helix strands (Renu and Sabarinath, 2004). Almost all eukaryotic organisms synthesize Mn and Cu/Zn SOD whereas Fe SOD is exclusive to plants (Kwang-Hyun et al., 2006). Ni SOD was recently reported in Streptomyces griseus and S. coelicolor (Garcia-Hernández et al., 2002). In the Arabidopsis thaliana genome, three Cu/Zn SODs (cytosolic, chloroplast and peroxisomal), one Mn SOD and three Fe SODs (Fe SOD1, 2 and 3) genes have been reported, with Fe SOD2 and 3 being chloroplastic. Chloroplast Cu/Zn SOD is located in the thylakoid membranes and Fe SOD2 and 3 are located in the stroma (Myouga et al., 2008).
Soybean (Glycine max. L) is an important legume plant that is widely cultivated for its protein and oil and is considered a miracle crop. Although the role of SOD as an antioxidant enzyme under stress conditions has been studied in different varieties of soybean (Chaitanya et al., 2009; Hassan et al., 2011), the genes that control the expression of these isoforms have not been identified. In this study, we undertook a molecular, structural and phylogenetic analysis of soybean SOD isoforms (Cu/Zn, Mn and Fe SOD) based on homology modeling using A. thaliana SODs.
Materials and Methods
Identification of EST sequences
The sequences of genes corresponding to SOD isoenzymes in Arabidopsis, namely, Mn SOD (AT3G10920), Fe SOD (AT4G25100) and Cu/Zn SOD distributed in chloroplasts (ATG12520), cytosol (AT1G08830) and peroxisomes (AT5G18100), were used as the query sequences in BLAST searches to identify the corresponding genes in soybean. These nucleotide sequences were assessed for homology at the protein level and used for phylogenetic analysis.
Phylogenetic analysis of sequences
All sequence alignments were done using ClustalW (Aiyar, 2000). Phylogenetic trees were plotted using MEGA 4.0 software with the UPGMA method (Tamura et al., 2007). Soybean genes that separated along with Arabidopsis genes were pooled and their amino acid pattern was analyzed by constructing pretty boxes using Boxshade.
Secondary structure prediction of SOD proteins
The secondary structures of the soybean SOD isoenzymes were predicted using the PSIPRED online server based on the retrieved sequences. PSIPRED incorporates two feed-forward neural networks that analyze the data generated as an output from PSI-BLAST (position-specific iterated BLAST) (Altschul et al., 1997). Validation of the procedure and performance using PSIPRED yielded an average Q3 score of 76.5%.
3D structure
The 3D structure models for soybean and Arabidopsis SODs were developed using 3D LigandSite. This software was used to the exact binding site of metal ions in the amino acid sequences. Dompred software was used to predict the domains and their boundaries for a given protein sequence.
Quaternary structure prediction
The quaternary structures of SOD proteins in soybean and Arabidopsis were predicted using the protein interfaces and surfaces tool PISA. Assemblies that could form crystals were determined by identifying the sets that represented the solutions indicated in the headings of the appropriate table (see Results). The highest values in the assemblies were considered to be the most appropriate. The MM size indicated the number of macromolecular monomeric units in that particular assembly and corresponded to an oligomeric or multimeric state. A formula was obtained to indicate the chemical composition of the assembly and denoted the number of different monomeric units. The stability of an assembly, i.e., its tendency to dissociate in solution, was also determined. The solvation free energy (ΔGint) was calculated as the difference in solvation energies of the isolated and assembly structures and indicated the free energy gain (kcal/M) during the formation of an assembly. The free energy of dissociation (ΔGdiss) represented the free energy difference between the associated and dissociated states. Assemblies with ΔGdiss > 0 were thermodynamically more stable because positive values were included in external energy use during the dissociation of an assembly.
Model evaluation
The dihedral angles φvs. ψ of amino acid residues in the protein structures were visualized and analyzed with Ramachandran plots (Ramachandran et al., 1963). The evaluation of models predicted in silico is essential in order to avoid errors resulting from trivial and non-trivial mistakes. To avoid ambiguities and to improve accuracy, the predicted SOD models were evaluated using the ProSA and VADAR web servers. For a specific PDB structure, ProSA calculates the overall quality score and validates a low resolution structure for approximate models using C-alpha atoms of the input structure. The output provides a z-score for the model that indicates the overall model quality; this value was determined from the plot during prediction.
Results and Discussion
ROS produced by plants are eliminated by antioxidant defense systems that enhance the tolerance of plants to environmental stress (Min-Lang et al., 2012). In view of the increasing interest in the molecular modeling of the various isoforms of SOD, in this study we investigated the structure of soybean SOD isoforms and examined their phylogenetic relationships.
Phylogenetic analysis
The availability of information from various genome-sequencing projects, cDNA libraries and EST libraries offers the possibility of complementing investigations of gene function in vivo with parallel phylogenetic analyses of multigene families to address their evolution within and across species (Vincentz et al., 2003). Within families, the protein structure and catalytic residues that determine the substrate specificity are generally conserved. Bioinformatics tools are thus useful for the functional analysis of related proteins (Henrissat et al., 2001). However, many sequence-based families are polyspecific, i.e., they include genes that encode proteins with different functions. This reflects gene duplication and evolutionary divergence, with the acquisition of new protein functions (Emanuele et al., 2004). In the present study, the phylogenetic relationships of soybean SOD genes were evaluated with respect to Arabidopsis SOD genes by using the Maximum Composite Likelihood (MCL) approach implemented in MEGA (Tamura et al., 2007).
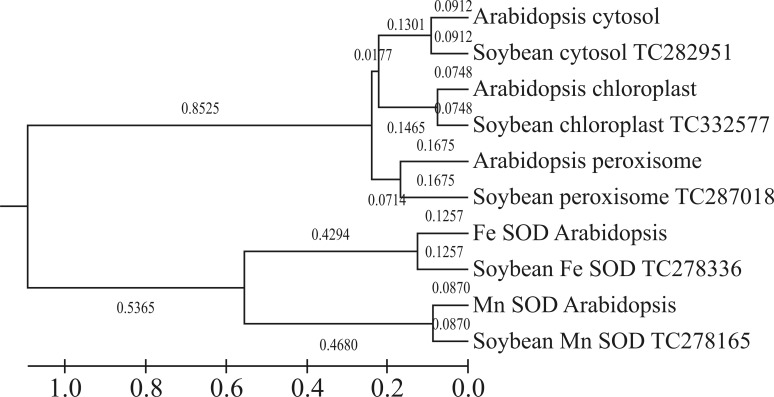
Phylogenetic analysis of the soybean and Arabidopsis open reading frames (ORFs) provided information on the evolutionary ancestry of all the SOD groups. This analysis showed that SODs segregated into two major clusters, with cytosolic, chloroplast, peroxisomal Cu/Zn in one cluster and Mn SOD and Fe SOD in another. In this tree, soybean SOD TC332577 segregated with chloroplast Cu/Zn SOD, TC287018 with peroxisomal Cu/Zn SOD, TC282951 with the genes of Arabidopsis cytosolic Cu/Zn SOD, TC278165 with Mn SOD and TC278336 with Fe SOD (Figure 1). Arabidopsis and soybean SODs were grouped with the same branch lengths, i.e., 0.0870 for Mn SOD, 0.1257 for Fe SOD, 0.0748 for chloroplast Cu/Zn SOD, and 0.0912 and 0.1675 for cytosolic and peroxisomal clusters, respectively. This homology in grouping reflected the strong similarities in the gene patterns of these two plants.
Figure 1.
Phylogenetic tree of soybean and Arabidopsis ORFs constructed with the neighbor-joining method and 500 bootstrap iterations (bootstrap values are indicated at each branching node). The ORFs formed two main clusters.
However, there was a subtle difference in the branch lengths of the major groups. Cu/Zn SOD segregated into a major group whereas the peroxisomal enzyme of both plants grouped together with a branch length of 0.1675. Chloroplast and cytosolic enzymes grouped together with branch lengths of 0.1465 and 0.1301, respectively; they were joined to the peroxisomal enzymes via branch lengths of 0.0714 and 0.0177, respectively. The difference between these branch lengths was < 0.075. Similarly, Mn SOD and Fe SOD grouped with branch lengths of 0.4680 and 0.4294, respectively; these two major groups were linked by a branch length difference of 0.32. The UPGMA tree showed that, the difference between two branch lengths at each cluster was ≤ 0.5 and in some cases almost zero. This result shows that these SODs are closely related to each other and that the sequences retrieved were accurate. The UPGMA tree showed that the SOD genes identified here are important and deserve further investigation.
Boxshade analysis
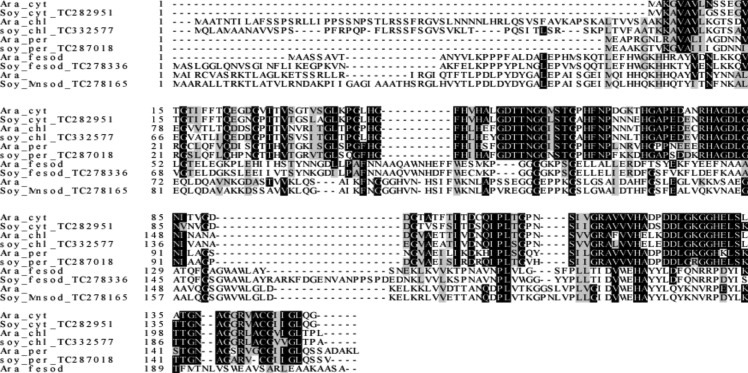
The comparison of homologous protein sequences is the most effective means of identifying common active sites or binding domains. Comparative studies of protein sequences allow the functional relationships among proteins to be determined and are particularly important for homology searches and threading methods in structure prediction. The alignment of multiple protein sequences is a powerful tool for grouping proteins into families and allows subsequent analysis of evolutionary issues (Balasubramanian et al., 2012). In the present study, the pattern of conserved amino acids in the soybean and Arabidopsis SOD protein sequences was studied using the Boxshade server, which split the sequences into two clusters with Cu/Zn SOD forming one cluster and Mn SOD and Fe SOD forming the second cluster (Figure 2). Fe and Mn SODs showed high similarities in sequence and structure. Rice Fe and Mn SODs also share high homology in their amino acid sequences. Mn SOD is the only form of SOD that is essential for the survival of aerobic life and plants. Mn SODs share 65% sequence similarity with each other (Youxiong et al., 2012). The degree of homology was also high among Cu/Zn SOD genes compared to that of Fe and Mn SODs. Our results indicated that the protein sequences from Cu/Zn SOD of chloroplasts, cytosol and peroxisomes had a greater number of conserved amino acid sequences than Mn and Fe SODs. The subcellular and phylogenetic distribution of SODs showed that all three SOD isoforms co-exist only in plants (Bowler et al., 1994). Comparative sequence analysis of the three SOD isoforms suggests that Fe SODs and Mn SODs are more efficient than Cu/Zn SODs, and that Fe and Mn SODs most probably arose from common ancestral enzymes, whereas Cu/Zn SODs evolved separately in eukaryotes (Smith and Dolittle, 1992).
Figure 2.
Multiple alignment of the deduced amino acid sequence of the soybean total ORF with Arabidopsis ORF. The multiple alignment was obtained using ClustalW and conserved amino acids were shaded using Boxshade (v.3.21). Dashes (−) indicate gaps in the alignment. Amino acids shaded in black indicate complete conservation.
Secondary structure analysis
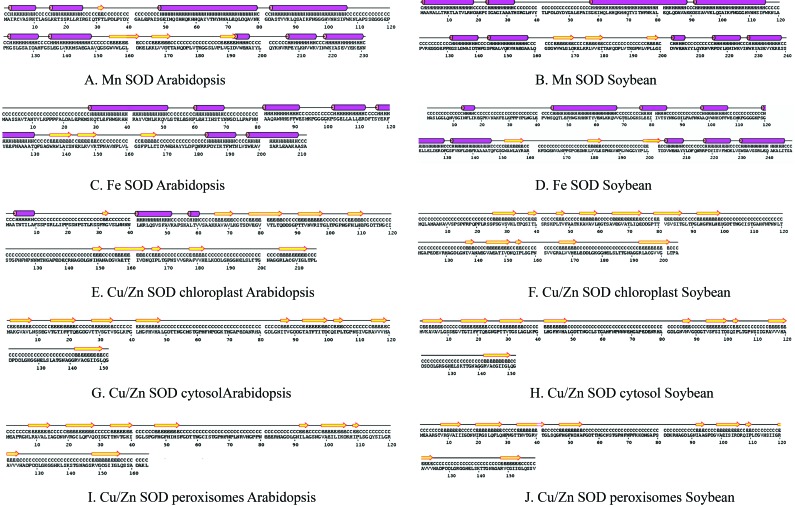
The secondary structure predictions for soybean and Arabidopsis Cu/Zn, Fe and Mn SOD proteins showed that Mn SODs had a long chain length consisting of α-helices and β-strands (Figure 3). Helices were absent in chloroplast, cytosolic and peroxisomal Cu/Zn SODs of soybean and Arabidopsis and their secondary structures were identical (Table 1). Soybean and Arabidopsis SOD proteins had a similar number of domains but their locations differed. The binding sites of the SOD proteins also differed in both plants (Table 2). The heterogen counts in the SOD genes of both plants were similar with respect to the type of heterogens present in SOD proteins (Table 3).
Figure 3.
Alignment of the secondary structures of soybean SOD with Arabidopsis SOD homologues. Identical residues are placed adjacent to facilitate comparison. The predicted secondary structure is shown for each aligned peptide: yellow arrows indicate β-sheets and pink cylinders indicate α-helices.
Table 1.
Secondary structure of Arabidospsis and soybean SOD proteins.
| Protein | Description | Amino acid number |
|---|---|---|
| Mn SOD Arabidopsis | CHAIN | 1–2, 12–15, 26–48, 80–82, 107–122, 132–135, 149–154, 162–165, 172–187, 191–192, 197–206, 216–218, 231 |
| HELIX | 3–11, 16–25, 49–79, 83–106, 123–131, 136–148, 193–196, 207–215, 219–230 | |
| STRAND | 155–161, 166–171, 188–190 | |
| Mn SOD Soybean | CHAIN | 1, 19–23, 33–57, 89–91, 116–131, 141–144, 158–163, 171–174, 181–196, 200–201, 206–215, 225–227, 239–240 |
| HELIX | 2–18, 24–32, 58–88, 92–115, 132–140, 145–157, 202–205, 216–224, 228–238 | |
| STRAND | 164–170, 175–180, 197–199 | |
| Fe SOD Arabidopsis | CHAIN | 1–28, 52–60, 70–81, 92–102, 113–116, 131–135, 143–144, 151–162, 168–171, 174–183, 193–196, 210–212 |
| HELIX | 29–51, 61–69, 82–91, 103–112, 117–130, 172–173, 184–192, 197–209 | |
| STRAND | 136–142, 145–150, 163–167 | |
| Fe SOD Soybean | CHAIN | 1–13, 18–44, 68–76, 85–97, 108–119, 130–132, 147–151, 159–178, 184–198, 202–203, 210–217, 227–230, 246–248 |
| HELIX | 14–17, 45–67, 77–84, 98–107, 120–129, 133–146, 204–209, 218–226, 231–245 | |
| STRAND | 152–158, 179–183, 199–201 | |
| Cu/Zn chloroplast Arabidopsis | CHAIN | 1–3, 10–40, 52–57, 61–65, 72–76, 86–90, 99–106, 112–148, 152–155, 164–165, 168–177, 183–204, 214–216 |
| HELIX | 4–9, 41–51, 58–60 | |
| STRAND | 66–71, 77–85, 91–98, 107–111, 149–151, 156–163, 166–167, 178–182, 205–213 | |
| Cu/Zn chloroplast Soybean | CHAIN | 1–25, 34–37, 40–53, 60–64, 74–78, 87–91, 100–136, 140–143, 152–153, 156–165, 172–192, 202–204 |
| HELIX | Nil | |
| STRAND | 26–33, 38–39, 54–59, 65–73, 79–86, 92–99, 137–139, 144–151, 154–155, 166–171, 193–201 |
Table 2.
Predicted binding sites of Arabidopsis and soybean SOD proteins.
| Protein | Plant | Residue | Amino acid | Contact | Av distance | Js divergence |
|---|---|---|---|---|---|---|
| Mn SOD | Arabidopsis | 35 | His | 24 | 0 | 0.92 |
| 87 | His | 24 | 0 | 0.92 | ||
| 136 | Trp | 19 | 0.71 | 0.75 | ||
| 169 | Asp | 24 | 0 | 0.92 | ||
| 171 | Trp | 20 | 0.65 | 0.95 | ||
| 173 | His | 24 | 0 | 0.92 | ||
|
| ||||||
| Soybean | 51 | His | 24 | 0 | 0.92 | |
| 103 | His | 24 | 0 | 0.92 | ||
| 152 | Trp | 21 | 0.68 | 0.95 | ||
| 203 | Asp | 24 | 0 | 0.85 | ||
| 205 | Trp | 19 | 0.7 | 0.95 | ||
| 207 | His | 24 | 0 | 0.92 | ||
|
| ||||||
| Fe SOD | Arabidopsis | 55 | His | 24 | 0 | 0.92 |
| 103 | His | 24 | 0 | 0.90 | ||
| 155 | Trp | 20 | 0.61 | 0.95 | ||
| 192 | Asp | 24 | 0 | 0.85 | ||
| 194 | Trp | 22 | 0.49 | 0.95 | ||
| 196 | His | 24 | 0 | 0.92 | ||
|
| ||||||
| Soybean | 64 | His | 25 | 0 | 0.92 | |
| 112 | His | 25 | 0 | 0.90 | ||
| 201 | Asp | 25 | 0 | 0.85 | ||
| 205 | His | 25 | 0 | 0.92 | ||
|
| ||||||
| Cu/Zn SOD | Arabidopsis | 125 | His | 25 | 0 | 0.91 |
| 142 | His | 25 | 0 | 0.92 | ||
| 145 | Asp | 25 | 0 | 0.84 | ||
|
| ||||||
| Soybean | 113 | His | 25 | 0 | 0.91 | |
| 121 | His | 25 | 0 | 0.91 | ||
| 130 | His | 25 | 0 | 0.92 | ||
| 133 | Asp | 25 | 0 | 0.84 | ||
Table 3.
Heterogens present in predicted binding sites.
| Protein | Plant | Heterogen | Count |
|---|---|---|---|
| Mn SOD | Arabidopsis | Fe | 22 |
| Fe2 | 3 | ||
| Soybean | Fe | 22 | |
| Fe2 | 3 | ||
|
| |||
| Fe SOD | Arabidopsis | Fe | 19 |
| Fe2 | 5 | ||
| Soybean | Fe | 19 | |
| Fe2 | 5 | ||
|
| |||
| Cu/Zn SOD | Arabidopsis | Zn | 25 |
| Soybean | Zn | 25 | |
3D structure analysis
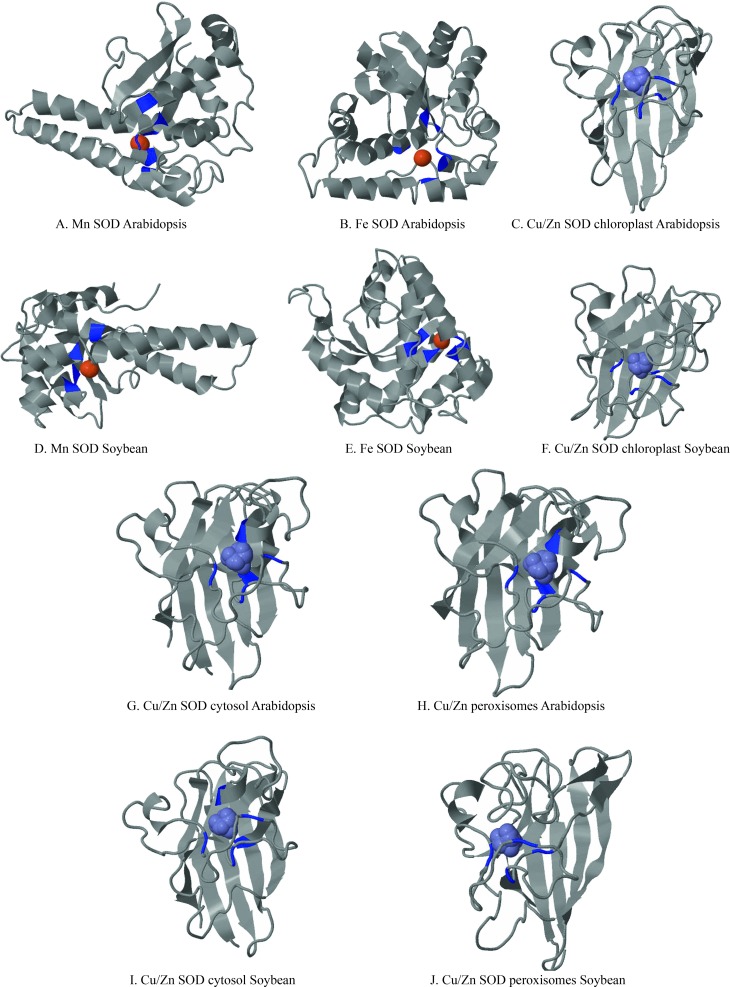
Proteins are complex chemical entities with a large number of variable atoms and a convoluted topology that make their description complicated (Ingale and Chikhale, 2010). The ‘indescribable nature’ of proteins also makes the quality of an experimentally determined protein structure very difficult to assess. The rapid increase in the number of genomes being sequenced and in the number of genes being deposited in databases means there is a need to identify the protein functions involved in protein interactions that form the basis of defining protein groups. In this study, three-dimensional models of soybean and Arabidopsis Cu/Zn, Mn and Fe SOD proteins were predicted using the software 3D LigandSite. The resulting models displayed excellent global and local stereochemical properties (Figure 4). Blue colored residues were predicted to be part of the binding. Residue conservation was calculated using the Jensen-Shannon divergence score (Capra and Singh, 2008). The ligands that formed the cluster were used to predict the metal ions shown in the space-filling format (Wass et al., 2010). There was a marked distinction between the metal binding sites and normal sites without space filling that enabled us to locate the coding regions exactly. The structural symmetry of the Cu/Zn SOD groups was identical.
Figure 4.
Predicted secondary structure and binding sites of Arabidopsis and soybean SOD. Identical structures are placed below each other to facilitate comparison.
Quaternary structural analysis
Quaternary structure plays an important role in defining protein function by facilitating allosterism and cooperativity in the regulation of ligand binding (Matthew et al., 2001). In this study, the quaternary structures of soybean and Arabidopsis SOD proteins were predicted using PISA by considering the assembly that provided the maximum structure size with good stability as being the best (Table 4). Our results indicated that soybean and Arabidopsis chloroplast Cu/Zn SODs were tetramers, whereas peroxisomal and cytosolic Cu/Zn SODs were dimers; Mn SOD was a tetramer and Fe SOD was a monomer. The Biomol stability value for chloroplast Cu/Zn SOD was predicted to be 9 while that for Mn SOD was 1. All of the predicted structures were stable because of their positive ΔGDiss values. There were more surface area values than buried surface values for all of the structures, indicating that these proteins had fewer folds. There was considerable similarity in the gene pattern of the soybean and Arabidopsis SOD enzymes, particularly with respect to protein structure. This similarity indicated a uniform evolutionary gene bank that was largely undisturbed (few mutations), as seen in our preliminary protein structural analysis.
Table 4.
Quaternary structure analysis of Arabidopsis and soybean SOD proteins.
| Protein | Size (mm) | Formula | Composition | Id | Biomol R350 | Stability | Surface area (Sq A) | Buried area (Sq A) | ΔGint (kcal/mol) | ΔGDiss (kcal/mol) |
|---|---|---|---|---|---|---|---|---|---|---|
| Mn SOD Ara tetramer | 4 | A4a6 | A2C2[SO4]6 | 1 | 1 | Stable | 32660 | 8600 | −115.4 | 17.1 |
| 0 | A | [Mn] | 2 | - | Stable | 120 | 0 | 0 | 0 | |
|
| ||||||||||
| Mn SOD Soy tetramer | 4 | A4 | ABCD | 1 | 1 | Stable | 30950 | 8300 | −40.6 | 12.6 |
| 0 | a | [Mn] | 2 | - | Stable | 120 | 0 | 0 | 0 | |
|
| ||||||||||
| Fe SOD Ara monomer | 2 | A2 | X2 | 1 | - | Stable | 18610 | 1740 | −12.5 | 4.3 |
| 0 | A | [Fe] | 2 | - | Stable | 140 | 0 | 0 | 0 | |
|
| ||||||||||
| Fe SOD Soy monomer | 2 | A2 | X2 | 1 | - | Stable | 18610 | 1740 | −12.5 | 5.3 |
| 0 | a | [Fe] | 2 | - | Stable | 140 | 0 | 0 | 0 | |
|
| ||||||||||
| Cu/Zn Ara chloroplast tetramer | 2 | A2a | AB[Cu] | 1 | - | Stable | 13920 | 1420 | −11.5 | 2.9 |
| 2 | A2a | CD[Cu] | 1 | - | Stable | 13690 | 1490 | −23.6 | 2.5 | |
|
| ||||||||||
| Cu/Zn Soy chloroplast tetramer | 2 | A2 | QR | 1 | 9 | Stable | 13640 | 1340 | −12.2 | 3.2 |
| 2 | A2 | MN | 1 | 7 | Stable | 13610 | 1320 | −12.1 | 3.1 | |
| 2 | A2 | IJ | 1 | 5 | Stable | 13620 | 1310 | −12.0 | 2.9 | |
| 2 | A2 | KL | 1 | 6 | Stable | 13680 | 1300 | −11.9 | 2.9 | |
| 2 | A2 | ST | 1 | 10 | Stable | 13700 | 1290 | −11.8 | 2.8 | |
| 2 | A2 | WX | 1 | 12 | Stable | 13570 | 1310 | −11.7 | 2.7 | |
| 2 | A2 | UV | 1 | 11 | Stable | 13720 | 1280 | −11.7 | 2.7 | |
| 2 | A2 | OP | 1 | 8 | Stable | 13640 | 1300 | −11.7 | 2.6 | |
Despite similarities in the secondary structures of cytosolic and peroxisomal Cu/Zn SOD there were many differences between the corresponding genes in both plants. The amino acid patterns were identical in Cu/Zn SOD compared to Mn and Fe SOD. The Fe SOD structure contained more helices, as indicated by the quality index, with more omega aberrations. Cu/Zn SODs showed more homology compared to other models with no helices in their structures. Model evaluation revealed the accuracy of the predicted models and suggested possible errors that were trivial when compared to the overall quality of the proposed structure. Quaternary structural analysis showed that all of the structures are thermodynamically stable, with dissociation energies > 0.
Model evaluation
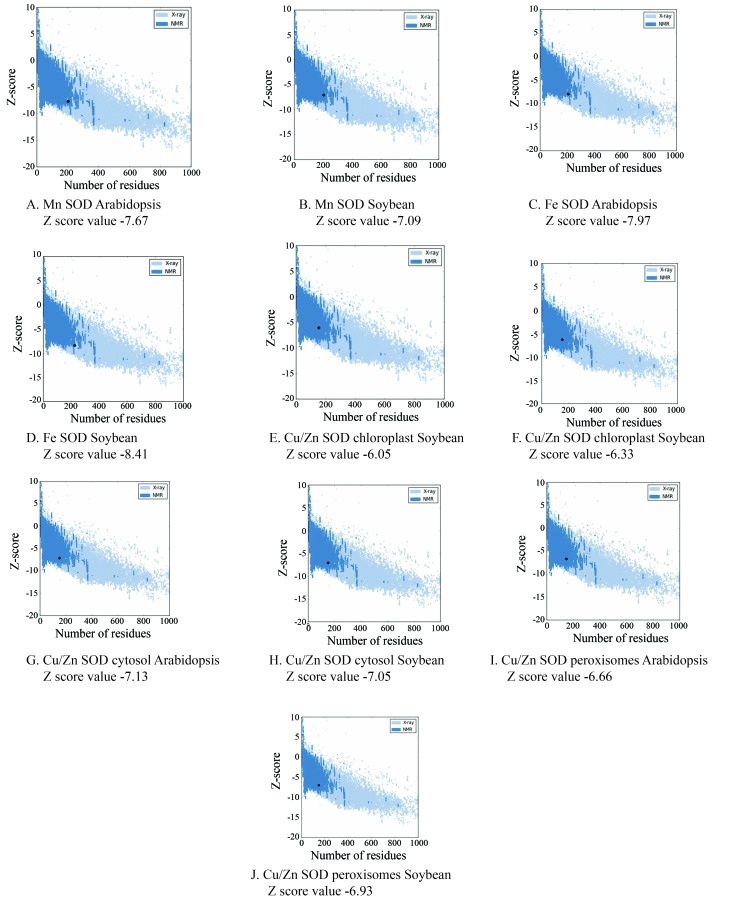
The Z-score value, a measure of model quality that predicts the total energy of the structure (Wiederstein and Sippl, 2007), was predicted for soybean and Arabidopsis SODs using the PROSA server (Figure 5). The Z-score values for chloroplast, cytosolic and peroxisomal Cu/Zn SODs were −6.33, −7.05 and −6.93, respectively; the corresponding values for Mn SOD and Fe SOD were −7.59 and −7.92, respectively.
Figure 5.
ProSA-web z-score chimeric protein plot. The z-score indicates overall model quality. The ProSA-web z-scores of all protein chains in PDB were determined by X-ray crystallography (light blue) or NMR spectroscopy (dark blue) with respect to their length. The plot shows results with a z-score ≤ 10. The z-score for SOD is highlighted as a large dot. The value is within the range of native conformations.
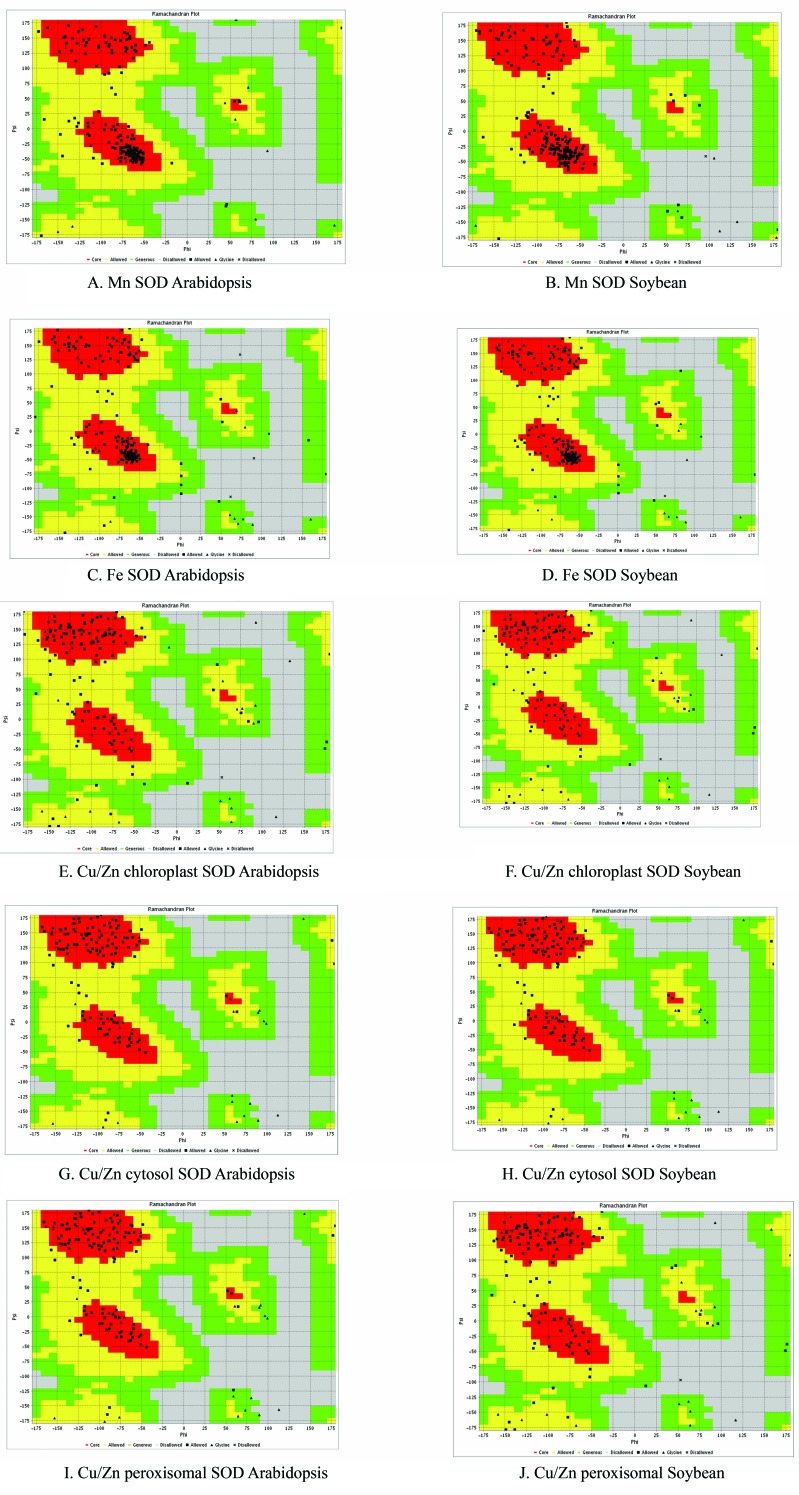
The stereochemical quality and exactness of the predicted soybean and Arabidopsis SOD proteins were analyzed using residue-by-residue geometry and the overall geometry of the protein structures was analyzed with Ramachandran plots (Ramachandran et al., 1963). These plots help visualize the dihedral angles φ vs. ψ of amino acid residues in proteins. In a polypeptide, the main chain N-C α and C α-C bonds are relatively free to rotate. These rotations are represented by the torsion angles ϕ and ψ, respectively. Figure 6 shows the quantitative evaluation of soybean and Arabidopsis protein structures done using Ramachandran plots provided by the VADAR web server. Soybean and Arabidopsis Mn SODs shared > 90% structural similarity with an equal number of residues in favored, allowed and outlier regions. There was little variation in the general and proline residue numbers in the αR, αL and β regions of both structures. The prominence of residues in the α R and β regions suggested that the structure was rigid with more right helices. Soybean chloroplast Cu/Zn SOD showed higher quality compared to the Arabidopsis protein, with fewer residues in the outlier region and more residues in the allowed region. The absence of residues in the αL region in both structures was an interesting feature of this protein and indicated that the structure had no left helices. Chloroplast Cu/Zn SOD of both plants had 86% of residues in the favored region (this value was lower than in previously reported SOD structures). More residues were observed in the allowed region of soybean (9%) and Arabidopsis (8.5%) SOD. There were more outliers in the Arabidopsis structure (5%) than in soybean (4%). Cytosolic Cu/Zn SODs from both plants had no residues in their outlier regions. These soybean and Arabidopsis SODs also had an equal number of residues in the favored and allowed regions (95% and 4.5%, respectively). In both structures, three proline residues were distributed in the αR and β regions. There was a subtle difference in the sparsely populated αL region, where Arabidopsis had one general and one proline while in soybean both of the residues were generally in the core region. All of the Cu/Zn structures had fewer residues in the αR region compared to the β region. The Fe SOD and Mn SOD structures had good clustering of residues and a greater number of helices. The structural quality of chloroplast Cu/Zn SOD of both plants was lower than in the remaining structures. In all of the structures, the αL region was less much less populated, i.e., few or no residues.
Figure 6.
Validation of SOD structures using Ramchandran plots. The Ramachandran plots revealed that > 90% of SOD amino acid residues from the modeled Arabidopsis structure were incorporated in the favored regions of the plot.
The soybean Fe SOD structure had 95% of its residues in expected regions and a negligible proportion (1.3%) in the outlier region; the corresponding values for Arabidopsis were 93% and 2.4%, respectively. However, Arabidopsis had 5% of its residues in allowed regions whereas soybean had 3.6%. Soybean peroxisomal Cu/Zn SOD had < 89% of its residues in the favored region. The number of residues in allowed and outlier regions was also high, indicating structural aberrations whereas in Arabidopsis no residues are observed in the outlier region and ∼94% of residues were in the favorable region, indicating the quality of the structure. Similar modeling and Ramachandran plot analyses to those described here have been used in the structural and functional analysis of spinach antioxidant proteins and the models were evaluated by computational tools (Sahay and Shakya, 2010).
Conclusion
Proteins are ubiquitous molecules that are involved in numerous crucial functions in organisms. Proteins accomplish their functions by positioning specific amino acids at target sites. Knowledge of the structural arrangement of amino acids is very important for understanding the molecular mechanisms by which proteins perform their functions. SOD is an important antioxidant enzyme that provides the first line of defense against ROS toxicity. The accurate and reliable molecular structural analysis of SOD isoenzymes is important for understanding their function in response to oxidative stress. In this study, structural models of soybean Cu/Zn, Mn and Fe SOD were analyzed and compared with those for Arabidopsis. These analyses provided insights into the molecular function of SOD isoenzymes with respect to their interactions with different cellular organelles. Further studies are in progress to understand the possible SOD gene interactions that may improve our understanding of the role of SODs in minimizing ROS toxicity.
Acknowledgments
The project was supported by the Research Center, College of Science, King Saud University, Saudi Arabia.
Footnotes
Associate Editor: Adriana S. Hemerly
References
- Aiyar A. The use of CLUSTAL W and CLUSTAL X for multiple sequence alignment. Meth Mol Biol. 2000;132:221–241. doi: 10.1385/1-59259-192-2:221. [DOI] [PubMed] [Google Scholar]
- Altschul SF, Madden TL, Schäffer AA, Zhang J, Zhang Z, Miller W, Lipman DJ. Gapped BLAST and PSI-BLAST: A new generation of protein database search programs. Nucleic Acids Res. 1997;25:3389–3402. doi: 10.1093/nar/25.17.3389. [DOI] [PMC free article] [PubMed] [Google Scholar]
- Balasubramanian J, Shahul Hammed MK, Tamilselvan R, Vijayakumar N. Artificial neural network: A forecast in pharmaceutical science. Nerve. 2012;1:7–12. [Google Scholar]
- Blokhina O, Virolainen E, Fagerstedt KV. Antioxidants, oxidative damage and oxygen deprivation stress: A review. Ann Bot. 2003;91:179–194. doi: 10.1093/aob/mcf118. [DOI] [PMC free article] [PubMed] [Google Scholar]
- Bowler C, Van Camp W, Van Montagu M, Inze D. Superoxide dismutases in plants. Crit Rev Plant Sci. 1994;13:199–213. [Google Scholar]
- Capra J, Singh M. Characterization and prediction of residues determining protein functional. Bioinformatics. 2008;24:1473–1480. doi: 10.1093/bioinformatics/btn214. [DOI] [PMC free article] [PubMed] [Google Scholar]
- Chaitanya KV, Spandana MS, Srinivas D, Kumar AL. Antioxidative responses of soybean (Glycine max. L) seedlings to salinity stress. J Plant Biol. 2009;36:83–87. [Google Scholar]
- Emanuele L, Yi L, McQueen-Mason SJ. Phylogenetic analysis of the plant endo-β-1,4-glucanase gene family. J Mol Evol. 2004;58:506–515. doi: 10.1007/s00239-003-2571-x. [DOI] [PubMed] [Google Scholar]
- Fink RC, Scandalios JG. Molecular evolution and structure-function relationships of the superoxide dismutase gene families in angiosperms and their relationship to other eukaryotic and prokaryotic superoxide dismutases. Arch Biochem Biophys. 2002;399:19–36. doi: 10.1006/abbi.2001.2739. [DOI] [PubMed] [Google Scholar]
- Garcia-Hernández M, Berardini TZ, Chen G, Crist D, Doyle A, Huala E, Knee E, Lambrecht M, Miller N, Mueller LA, et al. TAIR: A resource for integrated Arabidopsis data. Funct Integr Genomics. 2002;2:239–253. doi: 10.1007/s10142-002-0077-z. [DOI] [PubMed] [Google Scholar]
- Hassan M, Farrokh D, Jahanfar D, Ghorban N, Davood H. Effects of water deficit stress on seed yield and anti-oxidants content in soybean (Glycine max L.) cultivars. Afr J Agric Res. 2011;6:1209–1218. [Google Scholar]
- Henrissat B, Coutinho PM, Davies GJ. A census of carbohydrate-active enzymes in the genome of Arabidopsis thaliana. Plant Mol Biol. 2001;47:55–72. [PubMed] [Google Scholar]
- Ingale AG, Chikhale NJ. Prediction of 3D structure of paralytic insecticidal toxin (ITX-1) of Tegenaria agrestis (hobo spider) J Data Mining Genom Proteom. 2010;1:102–104. [Google Scholar]
- Kwang-Hyun B, Daniel ZS, Peng L, Xianming C. Molecular structure and organization of the wheat genomic manganese superoxide dismutase gene. Genome. 2006;49:209–218. doi: 10.1139/g05-102. [DOI] [PubMed] [Google Scholar]
- Matthew DG, Mark SH. Quaternary structure of rice non-symbiotic hemoglobin. J Biol Chem. 2001;276:6834–6839. doi: 10.1074/jbc.M009254200. [DOI] [PubMed] [Google Scholar]
- Min-Lang C, Li-Jen L, Jia-Hong L, Zin-Huang L, Yuan-Ting H, Tse-Min L. Modulation of antioxidant defense system and NADPH oxidase in Plucheaindica leaves by water deficit stress. Bot Stud. 2012;53:45–54. [Google Scholar]
- Myouga F, Hosoda C, Umezawa T, Iizumi H, Kuromori T, Motohashi R, Shono Y, Nagata N, Ikeuchi M, Shinozaki K. A heterocomplex of iron superoxide dismutases defends chloroplast nucleoids against oxidative stress and is essential for chloroplast development in Arabidopsis. Plant Cell. 2008;20:3148–3162. doi: 10.1105/tpc.108.061341. [DOI] [PMC free article] [PubMed] [Google Scholar]
- Pallavi S, Rama Shankar D. Lead toxicity in plants. Braz J Plant Physiol. 2005;17:35–52. [Google Scholar]
- Pallavi S, AmbujBhushan J, Rama Shanker D, Pessarakli M. Reactive oxygen species, oxidative damage, and anti-oxidative defense mechanism in plants under stressful conditions. J Botany. 2012. 217037.
- Ramachandran GN, Ramakrishnan C, Sasisek-haran V. Stereochemistry of polypeptide chain configurations. J Mol Biol. 1963;7:95–99. doi: 10.1016/s0022-2836(63)80023-6. [DOI] [PubMed] [Google Scholar]
- Renu KC, Sabarinath S. Heat-stable chloroplastic Cu/Zn superoxide dismutase in Chenopodiummurale. Biochem Biophys Res Commun. 2004;320:1187–1192. doi: 10.1016/j.bbrc.2004.06.071. [DOI] [PubMed] [Google Scholar]
- Sahay A, Shakya M. In silico analysis and homology modeling of antioxidant proteins of spinach. J Proteomics Bioinfo. 2010;3:148–154. [Google Scholar]
- Smith MW, Doolittle RF. A comparison of evolutionary rates of the 2 major kinds of superoxide-dismutase. J Mol Evol. 1992;34:175–184. doi: 10.1007/BF00182394. [DOI] [PubMed] [Google Scholar]
- Tamura K, Dudley J, Nei M, Kumar S. MEGA4: Molecular Evolutionary Genetics Analysis (MEGA) software ver. 4.0. Mol Biol Evol. 2007;24:1596–1599. doi: 10.1093/molbev/msm092. [DOI] [PubMed] [Google Scholar]
- Vincentz M, Bandeira-Kobarg C, Gauer L, Schlogl P, Leite A. Evolutionary pattern of angiosperm bZIP factors homologous to the maize Opaque2 regulatory protein. J Mol Evol. 2003;56:105–116. doi: 10.1007/s00239-002-2386-1. [DOI] [PubMed] [Google Scholar]
- Wass MN, Kelley LA, Sternberg MJ. 3DLigandSite: Predicting ligand-binding sites using similar structures. Nucleic Acids Res. 2010;38:469–473. doi: 10.1093/nar/gkq406. [DOI] [PMC free article] [PubMed] [Google Scholar]
- Wiederstein, Sippl MJ. ProSA-web: Interactive web service for the recognition of errors in three-dimensional structures of proteins. Nucleic Acids Res. 2007;35:407–410. doi: 10.1093/nar/gkm290. [DOI] [PMC free article] [PubMed] [Google Scholar]
- Youxiong Q, Jinxian L, Liping X, Jinrong G, Rukai C. Molecular cloning and expression analysis of an Mn superoxide dismutase gene in sugarcane. Afr J Biotechnol. 2012;11:552–560. [Google Scholar]
Internet Resources
- Basic Local Alignment Search Tool (BLAST), http://compbio.dfci.harvard.edu/cgi-bin/tgi/Blast/index.cgi (January 4, 2012).
- Boxshade (version 3.21, written by K. Hofmann and M. Baron), http://www.ch.embnet.org/software/BOX_form.html (January 4, 2012).
- Boxshade: For multiple sequence analysis. http://sourceforge.net/projects/boxshade/ (January 5, 2012).
- Dompred, Server designed to predict putative protein domains http://bioinf.cs.ucl.ac.uk/dompred (January 5, 2012).
- 3D LigandSite, Prediction of ligand binding sites: http://www.sbg.bio.ic.ac.uk/3dligandsite/ (January 5, 2012).
- Expasy Translation of a nucleotide (DNA/RNA) sequence: http://web.expasy.org/translate/ (January 7, 2012).
- Open Reading Frame Finder (ORF Finder), http://www.ncbi.nlm.nih.gov/projects/gorf/ (January 5, 2012).
- Protein Interfaces, Surfaces and Assemblies (PISA), http://www.ebi.ac.uk/msd-srv/prot_int/cgi-bin/piserver (January 5, 2012).
- Protein Structure Prediction Server (PSIPRED), http://bioinf.cs.ucl.ac.uk/psipred/ (January 14, 2012).
- Protein Structure Analysis (ProSA), https://prosa.services.came.sbg.ac.at/prosa.php (January 18, 2012).
- Volume, Area, Dihedral Angle Reporter (VADAR), http://redpoll.pharmacy.ualberta.ca/vadar (January 18, 2012).


