

Abstract
The CYP2E1 gene, whose protein product plays an important role in the metabolism of various carcinogens, exhibits two polymorphisms recognized by the restriction enzymes RsaI and PstI in its transcriptional regulatory region that have been previously implicated in cancer susceptibility. In this study, we have examined these polymorphisms to elucidate CYP2E1 allelic haplotype, examining the prevalence of these CYP2E1 alleles in Caucasians and African Americans and their potential role in risk for oral cancer. In addition to the cl (RsaI[+]/PstI[−]) and c2 (RsaI[−]/PstI[+]) alleles reported in previous studies, we have identified two new alleles, c3 (RsaI[+]/PstI[+]) and c4 (RsaI[−]/PstI[−]). The prevalence of the c2 and c3 alleles differs between racial groups, with African Americans exhibiting a lower prevalence of the c2 allele (0.003) but a higher prevalence of the c3 allele (0.049) than Caucasians (0.031 for c2 and 0.004 for c3). Of the 570 subjects screened in this study, the c4 allele was observed in one subject, a Caucasian case with the (c4/c4) genotype. A significant increase in the CYP2E1 (cl/cl) genotype was observed in oral cancer cases as compared to frequency-matched controls in subjects who smoked ≤ 24 pack-years (P = 0.033). No association was observed between CYP2E1 genotype and risk for oral cancer in the heavy-smoking group (i.e. > 24 pack-years). Similar trends were observed for both Caucasians and African Americans. These data suggest that the cl allele may contribute to increased risk for oral cancer.
Keywords: CYP2E1, Cytochrome P450, Oral cancer risk, Genetic susceptibility, Polymorphisms
1. Introduction
Oral cancer is the fifth most common incident cancer in the world and comprises 6.5% of all cancer deaths. The estimated number of oral cancer cases (including oral cavity and larynx) worldwide in 1996 was 765,000, accounting for 7.4% of all new cancer cases [1]. Since the major risk factors for oral cancer are tobacco use and alcohol consumption, polymorphic genes that code for tobacco carcinogen- and alcohol-metabolizing enzymes may play a role in oral cancer susceptibility.
P4502E1 is a metabolizing enzyme that is expressed in cultured human oral epithelial cells as well as in rat oral mucosa and tongue [2, 3]. In addition to metabolizing potentially important carcinogens such as benzene, butadiene, carbon tetrachloride, vinyl chloride, and low-molecular weight nitrosamines [4], P4502E1 is induced by ethanol [5–7] and plays a role in the activation of the tobacco-specific nitrosamine, 4-(methylnitrosamino)-l-(3-pyridyl)-l-butanone [8].
The CYP2E1 gene contains two polymorphisms at nucleotides −1259 and −1019 upstream of the CYP2E1 transcriptional start site which are detectable by PstI or RsaI restriction enzyme digestion, respectively [6]. Based upon the presence or absence of RsaI or PstI recognition sequences at these polymorphic sites, two alleles have been postulated to exist, the common “wild-type” allele (RsaI[+]/PstI[−]) referred to as cl, and the variant allele (RsaI[−]/PstI[+]) known as c2. The prevalence of the c2 allele was shown to be 2–8% in both Caucasians and African Americans, but higher in Asian populations [9, 10]. The RsaI polymorphism is present in a putative HNF-1 binding site and has been suggested to play a role in the regulation of CYP2E1 transcription and subsequent protein expression [6, 11]. In vitro studies have suggested that the regulatory region of the rare c2 homologous allele exhibited significant increases in transcriptional activity when cloned upstream of the chloramphenicol acetyltransferase reporter gene as compared to the 5′ regulatory region from the more common cl allele [6, 11].
Studies examining the role of the CYP2E1 RsaI/PstI polymorphism in susceptibility to upper aerodigestive tract cancer are inconclusive. No association between CYP2E1 RsaI/PstI genotype and risk for upper aerodigestive tract cancer was observed in either Japanese [12] or Caucasian [13, 14] subjects or in a study of alcoholics with or without upper aerodigestive tract cancer [15]. However, in a small Taiwanese study focusing on oral cancer, an association between the c2 allele and increased cancer risk was observed in non-betel quid chewing males, a relationship unaffected by alcohol consumption [16]. In addition, in a Taiwanese study of nasopharyngeal cancer [17], the CYP2E1 (c2/c2) genotype was found to be associated with increased cancer risk, an effect most pronounced in non-smokers. This variability in results may be due to the possibility that all CYP2E1 allelic variants have not been fully elucidated, with studies focusing on individual CYP2E1 polymorphic sites rather than CYP2E1 haplotype. In addition, tobacco use and alcohol consumption were not entered as variables for logistic regression or stratification analysis in some of these studies, potentially obscuring CYP2E1-dependent effects on cancer risk.
To better assess the role of the CYP2E1 5′ regulatory RsaI/PstI polymorphisms in susceptibility to oral cancer, we elucidated CYP2E1 RsaI/PstI allelic variants and examined their allelic frequencies in both Caucasians as well as African Americans. The importance of CYP2E1 5′ regulatory allelic variants in risk for oral cancer was then assessed in case/control studies with genotype-associated disease risk examined in terms of potential associations with exposure to environmental risk factors for oral cancer including tobacco use and alcohol consumption.
2. Subjects and methods
2.1. Study populations and sample processing
All cases (n = 171) were Caucasian or African American patients diagnosed with primary oral cancer, including cancers of the oral cavity (gingiva, floor of mouth, inner lip, soft palate, buccal mucosa, and tongue), tonsil, oropharynx, and larynx, and were identified between 1994 and 1997 from three institutes: Temple University Hospital (Philadelphia, PA), Memorial Sloan-Kettering Cancer Center (New York, NY), and The New York Eye and Ear Infirmary (New York, NY). All cases were diagnosed within 1 year prior to recruitment into the study. All case diagnoses were histologically confirmed by the pathology departments at each of the respective institutes. Ninety-eight percent of cases that were asked to participate in the study consented.
Controls (n = 399) were comprised of both in- and out-patients treated at participating hospitals for conditions unrelated to tobacco smoke and were without any prior diagnosis of cancer. Exclusions for controls were heart disease (including congestive heart failure, angina, coronary artery disease, myocardial infarction, and peripheral vascular disease), emphysema, and chronic obstructive pulmonary disease. Potential controls were recruited by either screening of hospital admission rosters for in-patients, or recruiting of outpatients visiting head and neck or dental clinics. The eligible control pool was restricted to African American and Caucasian subjects with the same age at diagnosis (± 5 years) and similar sex distribution as the cases, with a case/control ratio of 1:2 for Caucasians and 1:3 for African Americans. Ninety-five percent of controls that were asked to participate in the study consented.
For cases, buccal cell samples (n = 104), collected post-surgery at a follow-up examination, or archived non-tumor oral tissue isolated at the time of surgery during tumor resection (n = 67) were used for the analysis of polymorphic genotypes, while buccal cells were collected for the analysis of controls (n = 399). Protocols involving the analysis of buccal cell specimens were approved by the institutional review boards at each of the collaborating hospitals and informed consent was obtained from all subjects.
A questionnaire was administered to all subjects that contained questions on demographics, life-long smoking habits, and alcohol consumption. Tobacco use was categorized into pack-years (py) for smokers of cigarettes (1 pack/day for 1 year = 1 py), cigars (4 cigars/day for 1 year = l py), and pipe tobacco (5 pipes/day for 1 year = 1 py) according to the criteria described by Benhamou et al [18]. Individuals using other forms of tobacco (i.e. snuff or chewing tobacco) were not included in the tobacco correlation analysis due to insufficient subject numbers. Smokers were classified as never-smokers (< 100 cigarettes lifetime), light-smokers (100 cigarettes lifetime — 20 py), moderate smokers (20.1–40 py) and heavy smokers (> 40 py). Maximal levels of alcohol consumption (consumed over a minimum of 10 years) were calculated as shots per day, where one shot = 12.9 g of 43% alcohol, which is roughly equivalent to 1 oz of 86-proof hard liquor, one 3.6 oz glass of wine, or one 12 oz can of beer. Subjects were defined as drinkers of alcohol if they had been drinking a minimum of 1 shot/week for a minimum of 10 years. Subjects were classified as either never-drinkers (≤ 1 shot/week), light-drinkers (0.15–1.0 shots/day), moderate-drinkers (1.1– 4.0 shots/day), or heavy-drinkers (> 4 shots/day).
Buccal cell samples were collected and processed as previously described [19]. DNA was isolated by incubation overnight with proteinase K (0.1 mg/ml) in 1% sodium dodecyl sulfate at 50°C, extraction with phenol/chloroform, and ethanol precipitation as previously described [19]. Normal oral tissue from cases was immediately frozen at −70°C after surgery until snap-cooled in liquid nitrogen and homogenized in buffer prior to the addition of proteinase K as described earlier.
To prevent contamination and cross-contamination between samples, careful attention was given during DNA purification and isolation. The purification of DNA samples was performed in a location distant from the workstation where the polymerase chain reaction (PCR) amplifications were performed. All equipment utilized for tissue blending and homogenization were washed in a bath of concentrated chromic/sulfuric acid, rinsed three times in autoclaved double distilled water and once in 70% ethanol, air-dried, and autoclaved after each tissue sample was processed.
2.2. Genotyping assays
Cases and controls were screened for the presence of the CYP2E1 RsaI and PstI polymorphisms by PCR-restriction fragment length polymorphism (RFLP) analysis using sense (‘2Els’: 5-CCAGTCGAGTCTA-CATTGTCA-3′) and antisense (‘2Elas’: 5′-TTCATTC-TGTCTTCTAACTGG-3′) primers flanking the RsaI and PstI polymorphic sites in the 5′ regulatory region located upstream of the CYP2E1 transcriptional start site as previously described [6]. A 412 bp fragment was generated by PCR in a 50-ul reaction volume containing 50 ng of purified genomic DNA, 10 mM Tris-HCl (pH 8.3), 50 mM KCl, 1.5 mM MgCl2, 0.2 mM of each of deoxynucleotide trisphosphates, 50 ng of each of the primers, and 2.5 units of Taq DNA polymerase (Boeh-ringer Mannheim, Indianapolis, IN). The reaction mixtures underwent the following incubations in a GeneAmp 9600 thermocycler (Perkin Elmer, Foster City, CA): 1 cycle of 94°C for 2 min, 35 cycles of 94°C for 30 seconds, 55°C for 30 seconds, and 72°C for 45 seconds, followed by a final cycle of 10 min at 72°C. Differences in RFLP patterns were detected after combined or single restriction enzyme digestion with RsaI and/or PstI (Promega Corp., Madison, WI) as indicated in the text. Twenty percent of all PCR amplifications were electrophoresed on 8% native Polyacrylamide gels after restriction enzyme incubation, stained with ethidium bromide, and examined and photographed over UV light. This analysis was repeated for at least 20% of the specimens analyzed in this study for confirmation of genotyping results. Selected PCR-amplified DNA samples (as indicated in the text) were examined by dideoxy DNA sequencing [20] to confirm CYP2E1 RsaI/PstI polymorphism RFLP results.
2.3. Statistical analysis
The risk of oral cancer in relation to CYP2E1 genotype was estimated using conditional logistic regression to calculate odds ratios (ORs) and 95% confidence intervals (CIs). The logistic regression analysis was performed using categorical variables for both smoking and alcohol consumption as described earlier. For the logistic analysis of CYP2E1 genotypes, variant CYP2E1 genotypes [(cl/c2), (cl/c3), (c2/c3), and (c4/c4)] were combined into one group and compared with the (cl/cl) genotype. Gene-smoking interactions were evaluated with smoking status stratified at the median py for ever-smoking (i.e. ≥ 100 cigarettes lifetime) controls (24 py). Gene-smoking, gene-alcohol, and gene-gene interactions were evaluated by the likelihood ratio test to compare the goodness of fit of the model with and without the various interaction terms. The chi-squared or Fisher’s exact test was utilized as appropriate for comparison of genotype and allelic frequencies between groups. The Student’s t-test was used for comparing continuous variable such as age and smoking between cases and controls. All P values presented are two-sided. The statistical computer software SPSS (ver. 10.0, 2000) was used to perform all statistical analysis.
3. Results
A total of 113 Caucasian and 58 African American oral cancer cases as well as 226 Caucasian and 173 African American frequency-matched controls were entered into this study (Table 1). The mean age of cases and controls was 62 and 60, respectively, for Caucasians, and 59 and 60, respectively, for African Americans. Between 28 and 38% of subjects were female in cases and controls for both racial groups. For Caucasians, approximately 87% of cases and 57% of controls were ever-smokers (≥ 100 cigarettes lifetime), while 95% of cases and 64% of controls were ever-smokers in the African American group. The mean smoking dose (in py) was 49 for Caucasian cases and 21 for Caucasian controls, and 42 for African American cases and 20 for African American controls. As expected, cases had a significantly higher level of cigarette consumption than controls for both racial groups (P < 0.001 for both Caucasians and African Americans). A significantly higher percentage of cases were heavy drinkers as compared with controls for both African Americans (43% of cases versus 21% of controls, P < 0.001) and Caucasians (32% of cases versus 8% of controls, P < 0.001).
Table 1.
Distribution of oral cancer cases and controls according to demographic characteristics
| n | Mean age, year (range) | Sex (female/male) | Smoking, mean ± S.D. (py) | ||
|---|---|---|---|---|---|
| Caucasians | Cases | 113 | 62.0 (28–91) | 33/80 | 49.0 ± 40.7a |
| Controls | 226 | 59.9 (25–91) | 80/146 | 20.8 ± 34.8b | |
| African Americans | Cases | 58 | 58.6 (39–84) | 16/42 | 42.2 ± 29.0 |
| Controls | 173 | 59.6 (34–88) | 66/107 | 20.4 ± 33.6c |
One subject was not included in mean smoking calculations due to incomplete smoking information.
Two subjects were not included in mean smoking calculations due to incomplete smoking information.
Five subjects were not included in mean smoking calculations due to incomplete smoking information.
To screen for different CYP2E1 alleles and haplotypes, we employed PCR-RFLP methodologies utilizing single restriction enzyme digestions with RsaI and PstI added to different reaction mixtures as well as dual digestions with both RsaI and PstI added to the same reaction mixtures (see Fig. 1 for expected RFLP banding patterns). As shown in Fig. 2B, the expected banding pattern of 351 and 61 bp was observed for subjects with both CYP2E1 alleles exhibiting a (RsaI[+]/PstI[−]) haplotype, indicative of the (cl/cl) genotype (lane 1). This genotype was confirmed by single restriction enzyme digestion analysis with either RsaI or PstI added individually to PCR-RFLP reactions (see Fig. 2A, lanes 1 and 2). For the CYP2E1 (cl/c2) genotype, we expected bands of 351,294, 118 and 61 bp after combined RsaI/PstI digestion. Although a similar pattern was observed in a subset of subjects (15 controls and 7 cases, see Tables 2 and 3), an additional band of 412 bp was also observed for these specimens (lane 2, Fig. 2B). The appearance of this unexpected 412 bp band may be due to heteroduplex formation during PCR amplification of DNA samples from subjects exhibiting a heterozygous genotype, i.e. the mixing and re-annealing of individual PCR-amplified DNA strands from each of the heterozygous alleles (e.g. cl and c2 for CYP2E1). Since restriction enzyme digestion of PCR heteroduplexes is likely to be inefficient, we expect that for (RsaI[+]/PstI[−])/(RsaI[−]/PstI[+]) PCR-amplified CYP2E1 DNA heteroduplexes, an undigested 412 bp band would be observed for subjects with the (cl/c2) genotype after double digestion with RsaI and PstI since only one strand of the heteroduplex would contain either of the restriction enzyme cut sites. The possibility that this RFLP pattern is indicative of the (cl/c2) genotype was confirmed by single restriction enzyme digestion analysis with either RsaI or PstI alone in the restriction enzyme digestion reaction. As shown in Fig. 2A, subjects who exhibited the postulated (cl/c2) genotype after dual restriction enzyme digestion exhibited the expected patterns of 412, 294, and 118 bp after digestion with PstI alone (lane 3) or 412 and 351 bp after digestion with RsaI alone (lanes 4). This is similar to the pattern reported for the (cl/c2) genotype in previous studies [21–23].
Fig. 1.
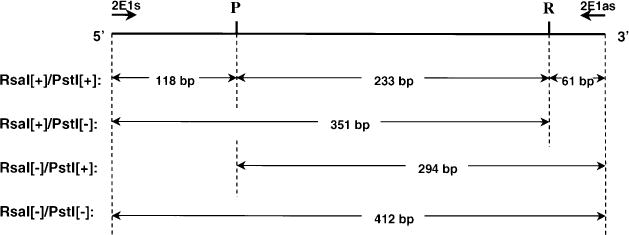
Schematic representation of potential CYP2E1 RsaI/PStI alleles and PCR-RFLP band sizes. ‘2Els’ and ‘2Elas’ are sense and antisense oligonucleotides, respectively, used in PCR amplifications of the CYPE1 5′ regulatory region. P, PstI;, R, RsaI restriction enzyme sites.
Fig. 2.
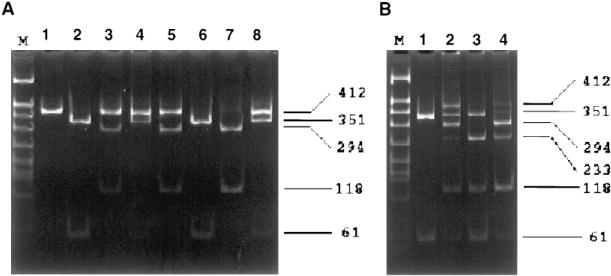
RFLP analysis of CYP2E1 Rsal/Pstl genotypes. Representative CYP2E1 PCR-RFLP analysis using purified buccal cell DNA from four study subjects. Twenty percent of each PCR, digested with RsaI and/or PstI, was electrophoresed on an 8% Polyacrylamide gel, stained with ethidium bromide, and photographed over UV light. Panel A, PCR-RFLP analysis performed by digesting CYP2E1 PCR product with RsaI or PstI in individual digestion reactions. Lane M: DNA marker; lanes 1,3,5,7: PstI-digested products; lanes 2,4,6,8: RsaI/-digested products. Panel B, CYP2E1 PCR-RFLP analysis performed using combined digestion with RsaI and PstI in the same digestion reaction. Lane M: DNA marker; lanes 1–4: RsaI/PstI-digested products. Numbers on right indicate PstI/RsaI-digested CYP2E1 PCR-RFLP band sizes.
Table 2.
Prevalence of informative CYP2E1 genotypes and alleles in controls stratified by race
| Caucasians | African Americans | |
|---|---|---|
| CYP2E1 genotype | ||
| (cl/cl) | 210 (93)a | 155 (89) |
| (cl/c2)b | 14 (6) | 1 (1) |
| (cl/c3)c | 2 (1) | 17 (10) |
| CYP2E1 allelic prevalence | ||
| c1 | 0.965 | 0.948 |
| c2b | 0.031 | 0.003 |
| c3c | 0.004 | 0.049 |
Numbers in parenthesis denote percentages.
Prevalence of the CYP2E1 c2 allele and (cl/c2) genotype was significantly higher (P < 0.005) in Caucasian controls as compared to African American controls.
Prevalence of the CYP2E1 c3 allele and (cl/c3) genotype was significantly higher (P < 0.001) in African American controls as compared to Caucasian controls.
Table 3.
CYP2E1 genotypes and oral cancer risk by race
| CYP2E1 genotype
|
||||||
|---|---|---|---|---|---|---|
| cl/cl | cl/c2 | cl/c3 | c2/c3 | c4/c4 | ||
| Caucasians | Cases | 105 (92.9)a | 7 (6.2) | 0 | 0 | 1 (0.9) |
| Controls | 210 (92.9) | 14 (6.2) | 2 (0.9) | 0 | 0 | |
|
|
|
|||||
| OR (95% CI)b | 1.0 | 0.49 (0.14–1.67) | ||||
| African Americans | Cases | 55 (90.2) | 0 | 5 (8.2) | 1 (1.6) | 0 |
| Controls | 155 (89.6) | 1 (0.6) | 17 (9.8) | 0 | 0 | |
|
|
|
|||||
| OR (95% CI)b | 1.0 | 0.86 (0.24–3.08) | ||||
| Combined | Cases | 160 (92.0) | 7 (4.0) | 5 (2.9) | 1 (0.6) | 1 (0.6) |
| Controls | 365 (91.4) | 15 (3.8) | 19 (4.8) | 0 | 0 | |
|
|
|
|||||
| OR (95% CI)C | 1.0 | 0.51 (0.22–1.20) | ||||
Numbers in parenthesis denote percentages.
ORs and 95% CIs were calculated after adjusting for sex, age, site of subject recruitment, tobacco use and alcohol consumption.
ORs and 95% CIs were calculated after adjusting for race, sex, age, site of subject recruitment, tobacco use and alcohol consumption.
In addition to RFLP banding patterns corresponding to the (cl/cl) and (cl/c2) genotypes, three additional RFLP banding patterns were observed in our case/control cohort after combined RsaI/PstI digestion. A total of 24 subjects (five cases and 19 controls, see Tables 2 and 3) exhibited a CYP2E1 RFLP banding pattern consisting of 351, 233, 118, and 61 bp (see Fig. 2B, lane 3), a pattern consistent with a genotype where the alleles are cl (RsaI[+]/PstI[−]) and a newly-identified allele (RsaI[+]/PstI[+]) designated c3. This cl/c3 genotype was confirmed by single restriction enzyme digestion with either RsaI or PstI alone in the restriction enzyme digestion reaction (Fig. 2A, lanes 5 and 6). An RFLP pattern consistent with that of the (c2/c3) genotype was also observed in our cohort, with a banding pattern of 294, 233, 118, and 61 bp observed after combined RsaI/PstI digestion (see Fig. 2B, lane 4). Similar to that observed for other CYP2E1 genotypes, the RFLP banding pattern observed after single restriction enzyme digestion was consistent with that expected for the (c2/c3) genotype (Fig. 2A, lanes 7 and 8). Finally, a fourth allele was identified in this cohort, designated c4. Out of the 570 subjects screened in this study, one exhibited a CYP2E1 PCR RFLP pattern that was resistant to digestion with either RsaI or PstI alone or in combination (results not shown), indicative of a subject with a (RsaI[−]/PstI[−])/(RsaI[−]/PstI[−]) or c4/c4 genotype. This and all other genotypes identified in this study were confirmed by direct dideoxy sequencing of representative specimens (results not shown).
Informative PCR amplifications were available for both CYP2E1 polymorphisms in 113 cases and 226 controls for Caucasians, and 61 cases and 173 controls for African Americans. Differences in CYP2E1 genotype and allelic frequencies were observed between control groups. A significantly (P < 0.005) higher frequency of both the CYP2E1 (cl/c2) genotype (0.06) and CYP2E1 c2 allele (0.03) was observed for Caucasians as compared to African Americans (0.01 for genotype and 0.003 for allele; see Table 2). The prevalence of the CYP2E1 (cl/c3) genotype and CYP2E1 c3 allele were significantly (P < 0.001) lower in Caucasians (0.01 and 0.004, respectively) as compared to African Americans (0.10 for genotype and 0.05 for allele). The prevalence of the cl allele was virtually the same (approximately 0.95) in both racial groups. The c4 allele, observed in one homozygous case, was not observed in any of the controls screened in this study. In controls, the prevalence of the RsaI [+] polymorphism was 0.97 (Caucasians) and 0.99 (African Americans) while the prevalence of the PstI [+] polymorphism was 0.035 (Caucasians) and 0.052 (African Americans).
No significant difference in CYP2E1 allelic or genotype prevalence was observed between cases and controls for either Caucasians or African Americans (Table 3). No association between CYP2E1 genotype and oral cancer risk was observed when logistic regression analysis was performed comparing the (cl/cl) genotype with other CYP2E1 genotypes combined [(cl/c2) + (cl/c3) + (c2/c3) + (c4/c4); OR (95% CI) = 0.51 (0.22–1.20) for total cohort) or individually (results not shown). Potential associations between CYP2E1 genotype and cancer risk could not be assessed for individual oral sites due to the relatively low prevalence of the c2 and c3 alleles in this cohort.
Although a test for interaction between CYP2E1 genotype and smoking was not significant in our regression model for oral cancer risk, a potential association between CYP2E1 genotype and oral cancer risk was further examined after stratification of subjects by smoking dose. Subjects were categorized into two groups based upon lifetime smoking history divided at the median number of pack-years for ever-smoking controls (24 py; Table 4). Of the 50 total cases in the low-smoking dose group (i.e. ≤ 24 py), 18 were never-smokers (< 100 cigarettes smoked lifetime). In this low-smoking group, all of the cases exhibited the (cl/cl) genotype, with the prevalence of this genotype significantly higher (P < 0.05) in cases as compared to controls. A similar trend was observed in both Caucasians, for whom c2 is the major CYP2E1 allelic variant, and African Americans, for whom c3 is the major variant CYP2E1 allele. However, a true assessment of attributable risk associated with the (cl/cl) genotype at low smoking doses could not be made in this study due to the fact that none of the cases in this smoking group had a “variant” CYP2E1 allele. No association between CYP2E1 genotype and oral cancer risk was observed in subjects in the higher smoking dose group (i.e. > 24 py). This was observed when comparing the (c1/c1) genotype with all other CYP2E1 genotypes combined [(cl/c2) + (cl/c3) + (c2/c3) + (c4/c4); OR (95% CI) = 0.70 (0.26−1.84); see Table 4) or when comparing subjects based upon homozygous versus heterozygous PstI [+] [i.e. (cl/cl)+ (c4/c4) versus (cl/c2) + (cl/c3) + (c2/c3); OR (95% CI) = 0.48 (0.20−1.15)] or RsaI[+][i.e. (cl/cl) + (cl/c3) versus (cl/c2) + (c4/c4); OR (95% CI) = 0.68 (0.22−2.15)] genotypes.
Table 4.
Prevalence of CYP2E1 genotypes in smokers stratified by smoking dose
| Smoking | CYP2E1 genotype
|
||||||
|---|---|---|---|---|---|---|---|
| dose (py) | cl/cl | cl/c2 | cl/c3 | c2/c3 | c4/c4 | ||
| Caucasians | ≤ 24 | Cases | 35 | 0 | 0 | 0 | 0 |
| Controls | 142 | 11 | 1 | 0 | 0 | ||
|
|
|||||||
| OR (95% CI) | undefined (P = 0.127)a | ||||||
| > 24 | Cases | 69 | 7 | 0 | 0 | 1 | |
| Controls | 66 | 3 | 1 | 0 | 0 | ||
|
|
|
||||||
| OR (95% CI)b | 1.0 | 0.59 (0.15–2.40) | |||||
| African Americans | ≤ 24 | Cases | 15 | 0 | 0 | 0 | 0 |
| Controls | 112 | 1 | 10 | 0 | 0 | ||
|
|
|||||||
| OR (95% CI) | undefined (P = 0.598)a | ||||||
| > 24 | Cases | 37 | 0 | 5 | 1 | 0 | |
| Controls | 38 | 0 | 7 | 0 | 0 | ||
|
|
|
||||||
| OR (95% CI)b | 1.0 | 0.69 (0.19–2.46) | |||||
| Combined | ≤ 24 | Cases | 50 | 0 | 0 | 0 | 0 |
| Controls | 254 | 12 | 11 | 0 | 0 | ||
|
|
|||||||
| OR (95% CI) | undefined (P = 0.033)a | ||||||
| > 24 | Cases | 106 | 7 | 5 | 1 | 1 | |
| Controls | 104 | 3 | 8 | 0 | 0 | ||
|
|
|
||||||
| OR (95% CI)c | 1.0 | 0.70 (0.26–1.84) | |||||
A test for interaction between CYP2E1 genotype and drinking was not significant in our regression model for oral cancer risk. No significant differences in allelic or genotype prevalence were observed in cases as compared to controls and no association between CYP2E1 genotype and oral cancer risk was observed when stratifying subjects based upon drinking levels (results not shown).
4. Discussion
In this study, we describe the presence of two new CYP2E1 alleles, the (RsaI[+]/PstI[+]) c3 allele and the (RsaI[−]/PstI[−]) c4 allele. The c3 allele is most common in African Americans but is rare in Caucasians while the c4 allele appears to be rare in both groups. As in previous studies, we demonstrate that the (RsaI[+]/PstI[−]) cl allele is the most prevalent CYP2E1 allele found in people, with an allelic prevalence of approximately 0.95 in both Caucasians and African Americans. Our studies suggest that, converse to the pattern observed for c3, the previously-described (RsaI[−]/PstI[+]) c2 allele is most prevalent in Caucasians but is rare in African Americans. These results differ from the higher c2 allelic prevalence observed previously for African Americans [10], a difference likely resulting from the fact that the c3 allele was interpreted to be as the c2 allele in previous studies.
In the present study, the (cl/cl) genotype prevalence was significantly higher in oral cancer patients as compared to controls in subjects exposed to low-negligible levels of tobacco smoke. None of the 50 cases in this group (including 18 never-smokers) exhibited a CYP2E1 allele other than cl. Potentially, there is an interaction between CYP2E1 genotype and exposure to non-tobacco carcinogens metabolized by CYP2E1, an effect that may be diluted out in heavier smokers. Although these data suggest that the (cl/cl) genotype may confer increased risk for oral cancer, attributable risk must be assessed in a significantly larger cohort of cases exposed to low or negligible levels of tobacco smoke.
While the prevalence of the PstI [−] cl allele was significantly higher in cases as compared to controls in the low-smoking group, neither of the PstI[+] alleles (i.e. c2 and c3) were observed in cases from this group. This suggests that the PstI site may play an important role in CYP2E1-induced oral cancer risk. The RsaI site appears to be less important in terms of oral cancer risk since significant differences in the RsaI [−] c2 and RsaI [+] c3 allelic prevalence were not observed in any group at any smoking dose. These results are consistent with previous studies suggesting an association between the cl allele and increased risk for aerodigestive tract cancer [23–29]. Additional studies have suggested either no association between CYP2E1 RsaI/PstI genotype and risk for aerodigestive tract cancer [12, 13, 15, 30–34] or increased risk associated with the c2 allele [16, 17]. This variation in results is likely due to differences in the CYP2E1 polymorphic sites and haplotypes studied. In studies where the polymorphic RsaI restriction enzyme site was examined, the RsaI[+] cl and c3 alleles are combined into one group. As shown in the present study, the cl allele may confer different levels of risk as compared to the c3 allele. Therefore, in case/control studies where the two alleles are combined into one group, a potential effect associated with the cl allele may not be discernable. By contrast, in studies where CYP2E1 genotype was assessed by analyzing the polymorphic PstI restriction enzyme site without assessing the RsaI site, the PstI[+] c2 and c3 alleles are combined into one group. As shown in the present study, the c2 and c3 alleles are similar in that they both do not appear to confer attributable risk for oral cancer. In the only two large case/control studies of aerodigestive tract cancer in which only the polymorphic PstI restriction enzyme site was examined [23, 26], the cl allele was associated with increased risk for aerodigestive tract cancer, a pattern consistent with that of the present study.
The mechanism by which the polymorphic PstI restriction enzyme site plays a role in altering CYP2E1-induced cancer susceptibility is not yet clear. Results from in vitro studies have suggested that the RsaI polymorphism and not the PstI polymorphism plays a role in the regulation of CYP2E1 transcription and subsequent protein expression [6, 11]. However, whether the RsaI polymorphism has an effect on the expression of the CYP2E1 gene in vivo remains to be firmly established. Results from two separate studies suggest that there is no difference in CYP2E1 activity in human liver microsomal specimens from subjects with different CYP2E1 RsaI genotypes [35, 36], although the Vmax for CYP2E1 activity in the microsomal sample from a putative (c2/c2) subject was 50% that of (cl/cl) subjects [36]. Similar results were described when CYP2E1 RsaI[+] alleles were examined by in vivo assessment of 6-hydroxylation of the CYP2E1 metabolite, chlorzoxozone, in uninduced individuals [37]. In addition, the oral clearance of chlorzoxozone was significantly lower in subjects with the putative (c2/c2) genotype as compared to subjects with the putative (cl/cl) genotype [38]. CYP2E1 mRNA expression was shown to be three-fold higher in liver biopsy specimens from subjects with the putative heterozygous mutant (C1/C2) genotype as compared to subjects with the putative homozygous wild-type (C1/C2) genotype [39, 40], but the effects of alcohol consumption as a potential confounder were not taken into account in these studies. Similarly, a twofold increase in expression was observed in lymphocytes from alcohol-drinking subjects with the putative heterozygous mutant genotype as compared to non-alcohol-drinking subjects with the putative homozygous wild-type genotype [11], an effect potentially due to differences in alcohol-induced over-expression of CYP2E1. In addition, the c3 allele was not assessed in these studies, increasing the potential for bias in these studies.
The possibility exists that the PstI polymorphism is genetically linked to activity- or expression-altering alleles in CYP2E1 or perhaps other genes. In recent studies, the half-life of the CYP2E1 substrate, acet-ominophen, was found to be shortest in individuals with the homozygous variant genotype, suggesting either increased gene expression or higher CYP2E1 protein activity is associated with the variant CYP2E1 allele [41]. Two CYP2E1 amino acid-altering polymorphisms have recently been described, but their prevalence appears to be low in the population [42]. Previous studies have shown the existence of other CYP2E1 5′ regulatory region polymorphisms, but these polymorphisms have either not been linked to functional differences in expression [43] or their prevalence has not yet been examined in a large population [44]. The possibility of whether such polymorphisms are linked to the 5′ regulatory region PstI polymorphism remains to be elucidated.
In summary, we have identified two common RsaI/PstI CYP2E1 allelic variants in addition to the wild-type c1 allele, with the RsaI [−]/PstI [+] c2 allele the most common variant in Caucasians and the RsaI[+]/PstI[+] c3 allele the most common variant in African Americans. An increased prevalence of the CYP2E1 (cl/cl) genotype in never-light smoking oral cancer cases as compared to corresponding controls suggests that the cl allele may play a role in oral cancer risk. Further studies are required to better assess the attributable risk associated with this genotype.
Acknowledgments
This study was supported by NIH Grants CA73173 (JYP), CA59917 (PL), and DE12206 (PL).
References
- 1.AICR. Food, nutrition and the prevention of cancer: a global perspective. Washington, D.C.: American Institute for Cancer Research; 1997. [DOI] [PubMed] [Google Scholar]
- 2.Shimizu M, Lasker JM, Tsutumi M, Lieber CS. Immunohisto-chemical localization of ethanol-inducible P450IIE1 in the rat alimentary tract. Gastroenterology. 1990;99:1044–53. doi: 10.1016/0016-5085(90)90625-b. [DOI] [PubMed] [Google Scholar]
- 3.Farin FM, Bigler LG, Oda D, McDougall JK, Omiecinski CJ. Expression of cytochrome P450 and microsomal epoxide hydrolase in cervical and oral epithelial cells immortalized by human papillomavirus type 16 E6/E7 genes. Carcinogenesis. 1995;16:1391–101. doi: 10.1093/carcin/16.6.1391. [DOI] [PubMed] [Google Scholar]
- 4.Lieber CS. Cytochrome P-4502E1: its physiological and pathological role. Physiol Rev. 1997;77:517–44. doi: 10.1152/physrev.1997.77.2.517. [DOI] [PubMed] [Google Scholar]
- 5.Kawajiri K, Nakachi K, Imai K, Yoshii A, Shinoda N, Wata-nabe J. Identification of genetically high risk individuals to lung cancer by DNA polymorphism of the cytochrome P450 1A1 gene. FEBS Lett. 1990;263:131–3. doi: 10.1016/0014-5793(90)80721-t. [DOI] [PubMed] [Google Scholar]
- 6.Hayashi S-I, Watanabe J, Kawajiiri K. Genetic polymorphisms in the 5′-flanking region change transcriptional regulation of the human cytrchrome P450IIE1 gene. J Biochem. 1991;110:559–65. doi: 10.1093/oxfordjournals.jbchem.a123619. [DOI] [PubMed] [Google Scholar]
- 7.Uematsu F, Kikuchi H, Motomiya M, Abe T, Sagami I, Ohma-chi T. Association between restriction fragment length polymorphism of the human cytochrome P450 1A1 gene. Jpn J Cancer Res. 1991;82:254–6. doi: 10.1111/j.1349-7006.1991.tb01838.x. [DOI] [PMC free article] [PubMed] [Google Scholar]
- 8.Hecht SS. Biochemistry, biology, and carcinogenicity of tobacco-specific N-nitrosamines. Chem Res Toxicol. 1998;11:559–603. doi: 10.1021/tx980005y. [DOI] [PubMed] [Google Scholar]
- 9.Kato S, Shields PG, Caporaso NE, Hoover RN, Trump BF, Sugimura H, et al. Cytochrome P450IIE1 genetic polymorphisms, racial variation, and lung cancer risk. Cancer Res. 1992;52:6712–5. [PubMed] [Google Scholar]
- 10.Stephens EA, Taylor JA, Kaplan N, Yang CH, Hsieh LL, Lucier GW, et al. Ethnic variation in the CYP2E1 gene: polymorphism analysis of 695 African-Americans, European-Americans and Taiwanese. Pharmacogenetics. 1994;4:185–92. doi: 10.1097/00008571-199408000-00002. [DOI] [PubMed] [Google Scholar]
- 11.Watanabe J, Hayashi Si, Kawajiri K. Different regulation and expression of the human CYP2E1 gene due to the RsaI polymorphism in the 5′-flanking region. J Biochem. 1994;116:321–6. doi: 10.1093/oxfordjournals.jbchem.a124526. [DOI] [PubMed] [Google Scholar]
- 12.Morita S, Yano M, Tsujinaka T, Akiyama Y, Taniguchi M, Kaneko K, et al. Genetic polymorphisms of drug-metabolizing enzymes and susceptibility to head-and-neck squamous-cell carcinoma. Int J Cancer. 1999;80:685–8. doi: 10.1002/(sici)1097-0215(19990301)80:5<685::aid-ijc9>3.0.co;2-w. [DOI] [PubMed] [Google Scholar]
- 13.Matthias C, Bockmiihl U, Jahnke V, Jones PW, Hayes JD, All-dersea J, et al. Polymorphism in cytochrome P450 CYP2D6, CYP1A1, CYP2E1 and glutathione S-transferase, GSTM1, GSTM3, GSTT1 and susceptibility to tobacco-related cancers: studies in upper aerodigestive tract cancers. Pharmacogenetics. 1998;8:91–100. [PubMed] [Google Scholar]
- 14.González MV, Alvarez V, Pello MF, Menéndez MJ, Suárez C, Coto E. Genetic polymorphism of N-acetyltransferase-2, glutathione S-transferase-M1, and cytochromes P450IIE1 and P450IID6 in the susceptibility to head and neck cancer. J Clin Pathol. 1998;51:294–8. doi: 10.1136/jcp.51.4.294. [DOI] [PMC free article] [PubMed] [Google Scholar]
- 15.Lucas D, Ménez C, Floch F, Gourlaouen Y, Sparfel O, Joannet I, et al. Cytochromes P4502E1 and P4501A1 genotypes and susceptibility to cirrhosis or upper aerodigestive tract cancer in alcoholic Caucasians. Alcohol Clin Exp Res. 1996;20:1033–7. doi: 10.1111/j.1530-0277.1996.tb01943.x. [DOI] [PubMed] [Google Scholar]
- 16.Hung H-C, Chuang J, Chien Y-C, Chern H-D, Chiang C-P, Kuo Y-S. Genetic polymorphisms of CYP2E1, GSTM1, and GSTT1; environmental factors and risk of oral cancer. Cancer Epidemiol Biomarkers Prev. 1997;6:901–5. [PubMed] [Google Scholar]
- 17.Hildesheim A, Anderson LM, Chen CJ, Cheng YJ, Brinton LA, Daly AK, et al. CYP2E1 genetic polymorphisms and risk of nasopharyngeal carcinoma in Taiwan. J Nat 1 Cancer Inst. 1997;89:1207–12. doi: 10.1093/jnci/89.16.1207. [DOI] [PubMed] [Google Scholar]
- 18.Benhamou S, Benhamou E, Flamant R. Lung cancer risk associated with cigar and pipe smoking. Int J Cancer. 1986;37:825–9. doi: 10.1002/ijc.2910370605. [DOI] [PubMed] [Google Scholar]
- 19.Park JY, Muscat JE, Ren Q, Schantz SP, Harwick RD, Stern JC, et al. CYP1A1 and GSTM1 polymorphisms and oral cancer risk. Cancer Epidemiol Biomarkers Prev. 1997;6:791–7. [PubMed] [Google Scholar]
- 20.Sanger F, Nicklen S, Coulson AR. DNA sequencing with chain-terminating inhibitors. Proc Natl Acad Sci USA. 1997;74:5463–7. doi: 10.1073/pnas.74.12.5463. [DOI] [PMC free article] [PubMed] [Google Scholar]
- 21.Maezawa Y, Yamauchi M, Toda G. Association between restriction fragment length polymorphism of the human cytochrome P450IIE1 gene and susceptibility to alcholic liver cirrhosis. Am J Gastroenterol. 1994;89:561–5. [PubMed] [Google Scholar]
- 22.Yu M-W, Gladek-Yarborough A, Chiamprasert S, Santella RM, Liaw Y-F, Chen C-J. Cytochrome P450 2E1 and glutathione S-transferase Ml polymorphisms and susceptibility to hepatocellular carcinoma. Gastroenterology. 1995;109:1266–73. doi: 10.1016/0016-5085(95)90587-1. [DOI] [PubMed] [Google Scholar]
- 23.Wu X, Shi H, Jiang H, Kemp B, Hong WK, Delclos GL, et al. Associations between cytochrome P4502E1 genotype, mutagen sensitivity, cigarette smoking and susceptibility to lung cancer. Carcinogenesis. 1997;18:967–73. doi: 10.1093/carcin/18.5.967. [DOI] [PubMed] [Google Scholar]
- 24.Persson I, Johansson I, Bergling H, Dahl ML, Seidegård J, Rylander R, et al. Genetic polymorphism of cytochrome P4502E1 in a Swedish population. Relationship to incidence of lung cancer. FEBS Lett. 1993;219:207–11. doi: 10.1016/0014-5793(93)80547-8. [DOI] [PubMed] [Google Scholar]
- 25.London SJ, Daly AK, Cooper J, Carpenter CL, Navidi WC, Ding L, Idle JR. Lung cancer risk in relation to the CYP2E1 Rse I genetic polymorphism among African-Americans and Caucasians in Los Angeles County. Pharmacogenetics. 1996;6:151–8. doi: 10.1097/00008571-199604000-00002. [DOI] [PubMed] [Google Scholar]
- 26.El-Zein R, Conforti-Froes N, Au WW. Interactions between genetic predisposition and environmental toxicants for development of lung cancer. Environ Mole Mutagen. 1997;30:196–204. doi: 10.1002/(sici)1098-2280(1997)30:2<196::aid-em12>3.0.co;2-8. [DOI] [PubMed] [Google Scholar]
- 27.Lin D-X, Tang Y-M, Peng Q, Lu S-X, Ambrosone CB, Kadlubar FF. Susceptibility to esophageal cancer and genetic polymorphisms in glutathione S-transferases Tl, PI, and Ml and cytochrome P450 2E1. Cancer Epidemiol Biomarkers Prev. 1998;7:1013–8. [PubMed] [Google Scholar]
- 28.Le-Marchand L, Sivaraman L, Pierce L, Seifried A, Lum A, Wilkens LR, et al. Associations of CYP1A1, GSTM1, and CYP2E1 polymorphisms with lung cancer suggest cell type specifications to tobacco carcinogens. Cancer Res. 1998;58:4858–63. [PubMed] [Google Scholar]
- 29.Wang SL, Lee H, Chen K-W, Tsai K-J, Chen C-Y, Lin P. Cytochrome P4502E1 genetic polymorphisms and lung cancer in a Taiwanese population. Lung Cancer. 1999;26:27–34. doi: 10.1016/s0169-5002(99)00070-7. [DOI] [PubMed] [Google Scholar]
- 30.Hamada GS, Sugimura H, Suzuki I, Nagura K, Kiyokawa E, Iwase T, et al. The heme-binding region polymorphism of cytochrome P450IA1 (CypIAl), rather than the Rsal polymorphism of IIE1 (CypIIEl), is associated with lung cancer in Rio de Janeiro. Cancer Epidemiol Biomarkers Prev. 1995;4:63–7. [PubMed] [Google Scholar]
- 31.Watanabe J, Yang J-P, Eguchi H, Hayashi S-i, Imai K, Nakachi K, et al. An Rsa I polymorphism in the CYP2E1 gene does not affect lung cancer risk in a Japanese population. Jpn J Cancer Res. 1995;86:245–8. doi: 10.1111/j.1349-7006.1995.tb03046.x. [DOI] [PMC free article] [PubMed] [Google Scholar]
- 32.Hori H, Kawano T, Endo M, Yuasa Y. Genetic polymorphisms of tobacco- and alcohol-related metabolizing enzymes and human esophogeal squamous cell carcinoma susceptibility. J Clin Gastroenterol. 1997;25:568–75. doi: 10.1097/00004836-199712000-00003. [DOI] [PubMed] [Google Scholar]
- 33.Morita S, Yano M, Shiozaki H, Tsujinaka T, Ebisui C, Mor-imoto T, et al. CYP1A1, CYP2E1 and GSTM1 polymorphisms are not associated with susceptibility to squamous-cell carcinoma of the esophagus. Int J Cancer. 1997;71:192–5. doi: 10.1002/(sici)1097-0215(19970410)71:2<192::aid-ijc11>3.0.co;2-k. [DOI] [PubMed] [Google Scholar]
- 34.Katoh T, Kaneko S, Kohshi K, Munaka M, Kitagawa K, Kunugita N, et al. Genetic polymorphisms of tobacco- and alcohol-related metabolizing enzymes and oral cavity cancer. Int J Cancer. 1999;83:606–9. doi: 10.1002/(sici)1097-0215(19991126)83:5<606::aid-ijc6>3.0.co;2-p. [DOI] [PubMed] [Google Scholar]
- 35.Carrière V, Berthou F, Baird S, Belloc C, Beaune P, deWaziers I. Human cytochrome P450 2E1 (CYP2E1): from genotype to phenotype. Pharmacogenetics. 1996;6:203–11. doi: 10.1097/00008571-199606000-00002. [DOI] [PubMed] [Google Scholar]
- 36.Powell H, Kitteringham NR, Pirmohamed M, Smith DA, Park BK. Expression of cytochrome P4502E1 (CYP2E1) in human liver: Assessment on mRNA genotype and phenotype. Pharmacogenetics. 1998;8:411–21. doi: 10.1097/00008571-199810000-00006. [DOI] [PubMed] [Google Scholar]
- 37.Lucas D, Ménez C, Girre C, Berthou F, Bodénez P, Joannet I, et al. Cytochrome P450 2E1 genotype and chlorzoxazone metabolism in healthy and alcoholic Caucasian subjects. Pharmacogenetics. 1995;5:298–304. doi: 10.1097/00008571-199510000-00005. [DOI] [PubMed] [Google Scholar]
- 38.Le Marchand L, Wilkinson GR, Wilkens LR. Genetic and dietary predictors of CYP2E1 activity: a phenotyping study in Hawaii Japanese using chlorzoxazone. Cancer Epidemiol Biomarkers Prev. 1999;8:495–500. [PubMed] [Google Scholar]
- 39.Tsutsumi M, Wang J-S, Takada A. Hepatic messenger RNA contents of cytochrome P4502E1 genotypes. Int Hepatol Commun. 1994;2:135. [PubMed] [Google Scholar]
- 40.Tsutsumi M, Wang J-S, Takase S, Takada A. Hepatic messenger RNA contents of cytochrome P4502E1 in patients with different P4502E1 genotypes. Alcohol Alcohol. 1994;29:29. [PubMed] [Google Scholar]
- 41.Ueshima Y, Tsutsumi M, Takase S, Matsuda Y, Kawahara H. Acetaminophen metabolism in patients with different cytochrome P-450IIE1 genotypes. Alcohol Clin Exp Res. 1996;20:25a. doi: 10.1111/j.1530-0277.1996.tb01722.x. [DOI] [PubMed] [Google Scholar]
- 42.Hu Y, Oscarson M, Johansson I, Yue Q-Y, Dahl M-L, Tabone M, et al. Genetic polymorphism of human CYP2E1, characterization of two variant alleles. Mol Pharmacol. 1997;51:370. [PubMed] [Google Scholar]
- 43.Hu Y, Hakkola J, Oscarson M, Ingelman-Sundberg M. Structural and functional characterization of the 5′-flanking region of the rat and human cytochrome P450 2E1 genes: identification of the polymorphic repeat in the human gene. Biochem Biophys Res Commun. 1999;263:286–93. doi: 10.1006/bbrc.1999.1362. [DOI] [PubMed] [Google Scholar]
- 44.Carr LG, Hartleroad JY, Liang Y, Mendenhall C, Moritz T, Thomasson H. Polymorphism at the P450IIE1 locus is not associated with alcoholic liver disease in Caucasion men. Alcohol Clin Exp Res. 1995;19:182–4. doi: 10.1111/j.1530-0277.1995.tb01489.x. [DOI] [PubMed] [Google Scholar]