

Abstract
The formation of new memories requires new information to be encoded in the face of proactive interference from the past. Two solutions have been proposed for hippocampal region CA1: (1) acetylcholine, released in novelty, selectively suppresses excitatory projections to CA1 from CA3 (mediating the products of retrieval), while sparing entorhinal inputs (mediating novel sensory information) and (2) encoding preferentially occurs at the pyramidal-layer theta peak, coincident with input from entorhinal cortex, and retrieval occurs at the trough, coincident with input from CA3, consistent with theta phase-dependent synaptic plasticity. We examined three predictions of these models: (1) in novel environments, the preferred theta phase of CA1 place cell firing should shift closer to the CA1 pyramidal-layer theta peak, shifting the encoding-retrieval balance toward encoding; (2) the encoding-related shift in novel environments should be disrupted by cholinergic antagonism; and (3) in familiar environments, cholinergic antagonism should shift the preferred theta firing phase closer to the theta trough, shifting the encoding-retrieval balance even further toward retrieval. We tested these predictions by recording from CA1 pyramidal cells in freely moving rats as they foraged in open field environments under the influence of scopolamine (an amnestic cholinergic antagonist) or vehicle (saline). Results confirmed all three predictions, supporting both the theta phase and cholinergic models of encoding versus retrieval dynamics. Also consistent with cholinergic enhancement of encoding, scopolamine attenuated the formation of distinct spatial representations in a new environment, reducing the extent of place cell “remapping.”
Introduction
Memory systems need to encode novel information in the face of interference from previously encoded associations (proactive interference). The hippocampus is crucial to memory (O'Keefe and Nadel, 1978; Squire, 1992; Eichenbaum and Cohen, 2001), thought to act as a comparator identifying novel from familiar information, with region CA1 playing a key role (Hasselmo et al., 1996; Vinogradova, 2001; Lisman and Grace, 2005). CA1 receives input from CA3, thought to convey retrieved information following recurrent collateral-mediated pattern completion (McNaughton and Morris, 1987; Treves and Rolls, 1994), and from the entorhinal cortex, which might convey feedforward sensory information. Two sets of models propose solutions to proactive interference.
The theta (4–12 Hz) oscillation has been related to the dynamics of memory function (O'Keefe and Nadel, 1978; Jones and Wilson, 2005; Buzsáki, 2006; Huxter et al., 2008; Tort et al., 2009; Jezek et al., 2011), and specifically to the interplay between encoding and retrieval (Hasselmo et al., 2002; Kunec et al., 2005). In theta-based models, the phase of ongoing theta oscillations temporally separates encoding and retrieval, and determines the different plasticity regimes that encoding and retrieval require. Encoding in CA1 occurs preferentially at the peak of pyramidal-layer theta, driven by entorhinal inputs, while CA3-driven retrieval preferentially occurs at the theta trough (Hasselmo et al., 2002). This is consistent with data regarding the timing of entorhinal and CA3 input (Brankack et al., 1993; Colgin et al., 2009; Mizuseki et al., 2009; Scheffer-Teixeira et al., 2012) and with theta phase-dependent synaptic plasticity (Huerta and Lisman, 1995; Hyman et al., 2003; Kwag et al., 2011).
Related models (Hasselmo et al., 1996; Meeter et al., 2004) emphasize acetylcholine's (ACh) role in biasing the encoding-retrieval balance toward encoding, by enhancing plasticity while dampening the recurrent CA3 activity mediating the retrieval of past associations. ACh presynaptically suppresses excitatory, retrieval-related CA3 inputs onto CA1, while excitatory entorhinal inputs mediating new associations are relatively preserved (Hasselmo and Schnell, 1994; Dasari and Gulledge, 2011). The increased cholinergic tone during exploration of novel environments (Thiel et al., 1998; Giovannini et al., 2001) would thus set encoding-retrieval dynamics toward encoding. Consistent with this, blockade of muscarinic receptors by scopolamine specifically impairs encoding and increases proactive interference (Rogers and Kesner, 2003; Atri et al., 2004; Antonova et al., 2011).
In these models, theta phase (subsecond timescale) and ACh (longer timescale) separate pro-encoding and pro-retrieval states, and schedule them for appropriate synaptic plasticity. We tested the conjoint predictions (Fig. 1) of these models as follows. Assuming that encoding-retrieval dynamics is biased toward encoding during novelty exposure, CA1-preferred firing phase should shift closer to the pyramidal-layer theta peak in novelty. Under the ACh model, scopolamine (a muscarinic antagonist) would disrupt this shift and further favor retrieval of intrinsic inputs over encoding of extrinsic inputs, even during exploration of a familiar environment. Thus, scopolamine should shift preferred firing phases closer to the pyramidal-layer theta trough. The present study confirms these predictions, supporting a combination of both models of encoding versus retrieval scheduling in CA1.
Figure 1.

Diagram of four predictions regarding the preferred theta phase of firing of CA1 pyramidal cells under manipulations of environmental novelty and/or muscarinic cholinergic blockade. DATA (from experimental literature): hippocampal ACh levels are higher in novelty (Thiel et al., 1998; Giovannini et al., 2001), and ACh selectively suppresses excitatory input from CA3 pyramidal cells onto CA1 pyramidal cells (Hasselmo and Schnell, 1994). The preferred firing phase (i.e., circular mean phase) of CA1 pyramidal cells occurs after the trough of CA1 pyramidal-layer theta in a familiar environment (baseline; black vertical line). Prediction 1: the phase in this familiar environment should not be affected by saline (FAM + SAL; control condition). Prediction 2: in a novel environment under saline (NOV + SAL), preferred theta phase shifts later, closer to the pyramidal-layer theta peak (blue vertical bar), reflecting increased levels of entorhinal-driven encoding. Prediction 3: scopolamine, a muscarinic cholinergic antagonist, antagonizes ACh's presumed role in novelty-elicited suppression of CA3 excitatory input to CA1, and thus disrupts the later-theta-phase-in-novelty-effect (resulting mean phase suggested as no change from baseline). Prediction 4: scopolamine shifts preferred phase earlier, closer to the theta trough (red vertical bar), by removing baseline cholinergic suppression of the CA3 projections onto CA1.
Materials and Methods
Animals
Six naive adult male Lister Hooded rats weighing 330–400 g at the time of surgery were maintained on a 12 h light/dark schedule, lights off at 2:00 P.M. After surgery, they were housed individually and kept at 85% free-feeding bodyweight. All procedures complied with the Animals (Scientific Procedures) Act 1986.
Surgery
Under deep anesthesia, rats were chronically implanted with microdrives above dorsal CA1, one per hemisphere. Each microdrive allowed a bundle of four movable tetrodes to be vertically lowered through the brain after surgery. Tetrodes were constructed from four twisted 25 μm HM-L-coated platinum/iridium (90%/10%) wire (California Fine Wire). The implants were positioned at 3.0–4.5 mm behind bregma, and 1.8–3.0 mm lateral to the midline.
Drugs
Saline solution (SAL; 0.9% NaCl) and scopolamine hydrobromide (SCOP; 0.4 mg/kg bodyweight; Sigma-Aldrich) were injected intraperitoneally at a volume of 1 mg/kg. Similar doses of scopolamine have been shown to reliably impair cognition (e.g., encoding, attention, spatial memory) with relatively minor effects on locomotion (for review, see Klinkenberg and Blokland, 2010; Deiana et al., 2011).
Experimental apparatus and procedure
All recording took place in a dimly lit room containing one of three possible environments. Each environment was positioned on top of a 32 cm high table. The first environment is referred to as “familiar” (FAM) because the rats were exposed to it during all the recording sessions. It was a black, wooden, square-walled box (60 × 60 × 50 cm) placed on a black Perspex floor (60 × 60 cm). Two cue cards (different visual patterns) were displayed on the room walls. The two other environments were novel (NOV) because the animals were exposed to each of them only once over the entire experiment. One consisted of a white cylinder (77 cm diameter, 50 cm height). The floor was made of white-painted wood, and the wall made of metal covered by white masking tape. A large cue card with a different pattern than the two familiar ones was displayed on a different wall. The other NOV environment was a large open square platform made of a transparent Plexiglas sheet (82 × 82 cm); no cue card was used. In between trials and during the entire screening period, the animals were placed in a holding box situated next to the environment.
The recording sessions, one per day, were distributed over three consecutive blocks A–C (Fig. 2). Testing time was similar for all rats, the first trial starting at approximately 2:00 P.M.
Figure 2.

Experimental design. Experiment is divided into three blocks, A–C. In blocks A and B, after familiarization to a single environment, rats are exposed to a novel environment (trials T4 and T5) interleaved between trials in the familiar environment (trials T1–3, T6). On this novelty exposure day, rats receive either SAL or SCOP injection after trial T3. In block C, run at least 5 d after the end of block B, all trials are in the familiar environment, and SCOP or SAL is injected after trial T3.
Block A comprised 5 consecutive days. On the first 4 d, rats were exposed to four trials (T1–4) in the FAM environment (walled black square). After this familiarization, the fifth day consisted of six trials (T1–6), the first three (T1–3) again conducted in the FAM environment, while the novel white cylinder (NOV) was introduced in the probe trials T4–5. Trial T6 reverted to the FAM environment. Thus the rats had 19 exposures over 5 d before exposure to the novel environment. Time of injection (SAL or SCOP) was always after the end of trial T3. At the beginning of each trial, rats were placed in the center of the environment, always facing the same direction. They were allowed to forage for grains of sweetened rice randomly thrown in the environment approximately every 30 s. They were then removed from the recording environment and placed in the holding box during the intertrial interval. Each trial lasted 15 min and started 20–25 min after the previous trial. The floor of the environment was cleaned between each trial using 5% alcohol solution.
Block B followed block A, after a 1 d resting period. It was identical in procedure to block A, except that the open square platform was the novel environment on trials T4–5 of the fifth day, and a rat was injected with scopolamine if saline was injected in block A, and vice versa. Four rats experienced the novel square in the NOV + SAL session and the novel cylinder in the NOV + SCOP session, and two rats experienced the novel cylinder in the NOV + SAL session and the novel square in the NOV + SCOP session.
In block C, two sessions were run in the familiar environment only to test the effect of injecting scopolamine (FAM + SCOP) and saline (FAM + SAL). Both sessions were run at least 5 d after the end of block B. Four rats were run in a four-trial FAM + SAL session, and four rats in a six-trial FAM + SCOP session (three of whom were tested in the FAM + SAL session one or more days previously). Other procedures were similar to those of Blocks A and B, with scopolamine or saline injected after trial T3.
Data acquisition
From approximately 1 week after surgery, tetrodes were gradually lowered over days and weeks toward the CA1 pyramidal layer. Once ripples were observed, tetrodes were not lowered by >25 μm a day. Electrophysiological screening took place while the rat was on a holding platform within the testing laboratory. Before recording sessions, screening sessions identified electrodes suitable for pyramidal-layer theta referencing. Electrophysiological recording was performed as described by (Lever et al., 2009). Briefly, electrical signals were acquired at 250 Hz (local field potentials; LFPs) and 50 kHz (single cells) via a 32-channel system (Axona). They were bandpass filtered at 0.34–500 Hz for LFPs and at 300 Hz to 7 kHz for single cells, after having, respectively, been amplified 3000–8000 and 10,000–20,000 times. Position data were sampled at 50 Hz using LEDs. Speeds >2 m/s were discarded, likely due to head movement or light reflection.
Histology
Rats were killed with an overdose of sodium pentobarbital and perfused transcardially with saline solution followed by 4% paraformaldehyde (PFA) solution. Brains were stored in 4% PFA until 2 d before sectioning, and then transferred to a 30% sucrose solution. Brains were sliced coronally into 40-μm-thick sections, which were mounted and stained using cresyl violet solution.
Data selection and analyses
Theta-phase and spatial correlates of place cell firing were analyzed after manual off-line discrimination between recorded cells using Tint software (Axona). Several criteria were used to isolate a place cell cluster, mainly the peak-to-trough amplitude and interval, and the 40 ms autocorrelogram. To be included in the analysis, an isolated cell had to fire ≥30 spikes with a peak firing rate ≥1 Hz in the locational field (after smoothing) in at least one trial.
Theta-phase analyses
The timing of place cell firing with respect to the theta oscillation was investigated at two levels: the spike ensemble level (i.e., all spikes recorded from neighboring tetrodes, or “multi-unit activity”) and the single cell level. The spike ensemble level may represent CA1 population activity from the perspective of downstream neurons. The single cell level is typical for analysis of spatial coding and theta-phase precession.
Assigning spikes with a theta phase.
All the spikes were referenced to an LFP ≤ 500 μm away. We refer to all the spikes from neighboring tetrodes (i.e., ≤500 μm away, same hemisphere) as an ensemble. Typically, more than one LFP reference was available, so there was more than one LFP plus spike-ensemble combination available per rat (see below, LFP plus spike ensemble for selection of the most appropriate one). For brevity, in the Results section, we refer to a given LFP plus spike-ensemble simply as an “ensemble.” The recorded LFP signal was filtered using a 6–12 Hz, 251-tap, Blackman windowed, bandpass sinc (sine cardinal) filter. An analytic signal was then constructed using the Hilbert transform, which takes the form: sa(tk) = s(tk) + iH [s(tk)], where H specifies the Hilbert transform, s(tk) is the filtered LFP signal and tk = kΔ where k = 1,…,K and Δ is the inverse of the sampling rate. The phase of the analytic signal, ϕ(tk), gives the phase of the LFP at time tk and each spike was assigned the phase ϕ(tk), if it occurred in the interval [tk −Δ/2, tk +Δ/2]. The positive theta peak was assigned the 0°/360° phase, and the theta trough, the 180° phase. The analytic signal was filtered to remove periods of low quality LFP by discarding those regions with low signal amplitude. Average amplitude was calculated for each cycle in the analytic signal, where the start of each cycle was defined by those points with analytic phase differences below −π. Cycles with amplitude below the 15th percentile in each trial and the spikes falling within them were discarded.
Theta-power ratio.
The LFP theta-power ratio score was calculated as follows. First, data from each trial were divided into runs where the rat ran at a speed >5 cm/s for at least 0.5 s. For this theta-power analysis only, data were excluded such that all trials had the same median speed (Jeewajee et al., 2008). Then, LFP from all runs in a trial were concatenated, zero padded to 219 elements, and Fourier transformed after the mean was subtracted from the LFP signal for each run. The square modulus of each Fourier frequency coefficient represents the signal power at that frequency. The zero padding produces an interpolated discrete Fourier transform that artificially increases the frequency resolution but does not change the spectral content of the signal in any way. The LFP theta-power ratio score was calculated as the ratio of average signal power in a 2 Hz band centered on the peak in the power spectrum in the 6–12 Hz theta frequency range, to the average signal power in the entire spectrum. Since running produces good theta, and trials are speed normalized by the median-speed procedure above, the theta-power ratio score should identify theta sensitivity of an LFP electrode in an unbiased way.
Pyramidal-layer theta referencing.
In our previous study of phase change (Lever et al., 2010), LFP-recording tetrodes were not consistently located across rats, but were located in different layers. In the present study, we took care to ensure that as far as possible CA1 place cell spikes were consistently referenced to theta recorded from the pyramidal layer. First, during screening before recording sessions, we assigned LFP-recording channels to electrodes on which high-amplitude ripples were seen. Second, we sought to establish the range of preferred theta phases characteristic of spike ensembles referenced to the pyramidal layer. We did this by selecting, for each rat experimental session, an LFP from a tetrode with good theta-power ratio from which a high number of place cell spikes were recorded. All the spikes recorded from the same tetrode as the LFP and from neighboring tetrodes were referenced to that LFP, and the preferred phase of the LFP-plus-spike-ensemble combination was calculated. After removal of one obvious outlier (from a session with, unusually, only one assigned LFP channel), the mean preferred phase of all the selected LFP-plus-spike-ensemble combinations in the premanipulation baseline trial (T3) was 229° ± 28° (mean ± SD, n = 19 combinations). (For this analysis, a single LFP plus spike ensemble combination was taken from each rat from the four experimental testing conditions, with the 19 combinations comprising: four from FAM + SAL, six from NOV + SAL, four from FAM + SCOP, and five from NOV + SCOP). This range was very consistent with previous studies careful to record theta from the CA1 pyramidal layer, which observed mean CA1 place cell preferred phases of 210–250°, i.e., 30—70° after the pyramidal-layer trough (Csicsvari et al., 1999; Mizuseki et al., 2009; Mizuseki et al., 2011).
Finally, then, LFP plus spike ensemble combinations were classified as pyramidal layer-referenced or not depending on whether their baseline trial (T3) preferred phase fell within or outside the range of the above-mentioned mean ± 2 SDs (229° ± 56°).
LFP-plus-spike-ensemble selection.
Given that LFPs might be recorded from up to four neighboring tetrodes, it was necessary to have a rule to select the best LFP-plus-spike-ensemble combination available from a given rat or hemisphere. Our aim was to analyze the LFP-plus-spike-ensemble combinations with robust theta recorded from the pyramidal layer, whose spike ensembles showed strong modulation by theta phase. Accordingly, the best LFP-plus-spike-ensemble combination was thus selected from each rat or hemisphere, depending on the dataset required (see below), using the following rule. Averaging over the trials T2–5 (T3–4 for FAM + SAL), we ranked all potential LFP-plus-spike-ensemble combinations for a given rat or hemisphere according to (1) the mean number of spikes recorded from the LFP tetrode; (2) the mean theta-phase concentration of the spike ensemble (i.e., length of the mean vector r); and (3) the mean theta-power ratio of the LFP. First we discarded any LFP trace where the spike count on that tetrode was <75% of the highest, then any LFP-plus-spike-ensemble combination whose phase concentration was <75% of the highest. If there was still a choice to be made, the LFP reference with the highest theta-power ratio was selected.
All selected ensembles were significantly theta modulated (Rayleigh test p < 0.001), so their respective preferred phase (i.e., circular mean phase) was used to summarize the ensemble phase distribution in a trial.
Phase changes at the ensemble level were investigated using three overlapping datasets, the largest of which equated to the entire set of spikes from all rats in all conditions. From conservative to liberal, these datasets comprised the following: (1) the selected pyramidal layer-referenced ensembles from each rat (i.e., maximum one ensemble per rat), this dataset is called “best pyramidal layer-referenced”; (2) all the selected pyramidal layer-referenced ensembles (i.e., maximum two ensembles per rat, one from each hemisphere), this dataset is called “all pyramidal layer-referenced”; (3) all the ensembles selected when nonpyramidal layer-referenced ensembles were permitted (i.e., maximum two ensembles per rat, one from each hemisphere), this dataset is called “no exclusions.” Table 1 provides a comprehensive summary of the results for each testing condition using the three overlapping datasets.
Table 1.
Ensemble-level analyses of preferred theta-phase changes for the four testing conditions
| Ensembles |
Distribution of ensemble preferred phases |
|||||||||||
|---|---|---|---|---|---|---|---|---|---|---|---|---|
| Included (up to 2 per rat; 1 per hemisphere) | n | Cells (% total) | Spike count T3 + T4 (% total) | Length of mean vector (r) |
Reliability of mean (Rayleigh p) |
Mean phase ± SEM |
Phase change | Paired-samples Moore test T3 versus T4 | ||||
| T3 | T4 | T3 | T4 | T3 | T4 | |||||||
| FAM + SAL | Best pyr. layer-referenced | 4 | 47 (72%) | 80,245 (79%) | 0.87 | 0.88 | 0.037 | 0.032 | 224° ± 24° | 225° ± 23° | +1° | 0.9>p >0.5 |
| Four rats | All pyr. layer-referenced | 7 | 65 (100%) | 101,611 (100%) | 0.84 | 0.82 | 0.003 | 0.004 | 231° ± 16° | 232° ± 17° | +1° | 0.95>p >0.90 |
| No exclusion | 7 | 65 (100%) | 101,521 (100%) | 0.74 | 0.72 | 0.015 | 0.020 | 233° ± 21° | 233° ± 22° | 0° | 0.95>p >0.90 | |
| NOV + SAL | Best pyr. layer-referenced | 6 | 150 (68%) | 118,738 (69%) | 0.93 | 0.79 | 0.001 | 0.017 | 243° ± 12° | 291° ± 21° | +48° | p < 0.005 |
| Six rats | All pyr. layer-referenced | 9 | 181 (83%) | 149,684 (87%) | 0.91 | 0.60 | <0.001 | 0.036 | 240° ± 10° | 278° ± 21° | +38° | p < 0.05 |
| No exclusion | 11 | 219 (100%) | 170,818 (100%) | 0.69 | 0.52 | 0.003 | 0.047 | 243° ± 15° | 282° ± 23° | +39° | p < 0.05 | |
| FAM + SCOP | Best pyr. layer-referenced | 4 | 91 (72%) | 79,447 (66%) | 0.88 | 0.96 | 0.032 | 0.013 | 224° ± 23° | 190° ± 13° | −34° | p < 0.01 |
| Four rats | All pyr. layer-referenced | 7 | 111 (88%) | 106,949 (89%) | 0.88 | 0.95 | 0.001 | <0.001 | 239° ± 14° | 184° ± 9° | −55° | p < 0.001 |
| No exclusion | 8 | 126 (100%) | 119,655 (100%) | 0.65 | 0.94 | 0.029 | <<0.001 | 233° ± 20° | 185° ± 9° | −48° | p < 0.005 | |
| NOV + SCOP | Best pyr. layer-referenced | 5 | 102 (50%) | 81,116 (46%) | 0.90 | 0.33 | 0.009 | N.S. (0.61) | 224° ± 17° | 146° ± 134° | −78° | 0.1>p >0.05 |
| Six rats | All pyr. layer-referenced | 8 | 121 (59%) | 96,626 (55%) | 0.89 | 0.54 | <0.001 | N.S. (0.10) | 231° ± 12° | 133° ± 27° | −98° | p < 0.005 |
| No exclusion | 11 | 206 (100%) | 176,555 (100%) | 0.62 | 0.29 | 0.012 | N.S. (0.41) | 231° ± 12° | 101° ± 59° | −130° | p < 0.01 | |
Change of the spike-ensemble preferred theta phases for each testing condition was analyzed using three overlapping datasets (the largest of which is the entire dataset) as follows. Best pyr. layer-referenced, the best LFP-plus-spike-ensemble combination from each rat, where the LFP tetrode recorded pyramidal-layer theta; all pyr. layer-referenced, the best LFP-plus-spike-ensemble combination from each hemisphere of a rat (thus maximum two per rat), where the LFP tetrode recorded pyramidal-layer theta; and no exclusions, the best LFP-plus-spike-ensemble combination from each hemisphere of a rat, regardless of the LFP tetrode's location. This dataset thus includes all the recorded spike ensembles. (See Materials and Methods, LFP-plus-spike ensemble selection for more details.) Each analysis is described in terms of the number of ensembles (n), cells, and spikes it includes. Changes in preferred phase between baseline T3 and probe T4 trials were analyzed using paired-sample Moore tests. Reliability of mean preferred phase for a given trial is tested by Rayleigh test for nonuniform circular distribution. Note that the value of the mean preferred phase in the NOV + SCOP condition is consistently unreliable in the probe trial (T4), though it is reliable in the baseline trial (T3). This indicates that changes in preferred phase induced by the combination of novelty and scopolamine were not coherent across the different rats.
The potential importance of using a common theta reference across conditions and rats is suggested by studies showing that the theta-phase separation angle between two vertically separated electrodes can vary. For instance, importantly, Leung (1984) showed that theta-phase separation between an electrode located in the alveus (same phase as pyramidal-layer theta) and an electrode located in the stratum radiatum was not constant but varied according to the balance, as summarized by Leung, between atropine-sensitive and atropine-resistant inputs. This is an important finding relevant to the present study since novelty with respect to familiarity, and by definition scopolamine with respect to saline, will change the balance between atropine-sensitive and atropine-resistant inputs. More recently, Montgomery et al. (2009) showed that the theta-phase separation angle between electrodes in the CA1 pyramidal layer versus the CA1 radiatum layer, and in the CA1 pyramidal layer versus the CA3 pyramidal layer were not constant across the different regions of the maze in an alternation task. The varying phase separation in the central arm relative to other maze regions in that study could reflect the greater need for memory retrieval in the central arm. A reason for consistently using pyramidal-layer theta, as opposed to another standard reference, is that it is a simple way of ensuring a common theta reference across a dataset and across studies, given that tetrodes need to be close to the pyramidal layer to record pyramidal cells and that pyramidal-layer theta phase is at the same phase as theta in the alveus and oriens. In summary, given our state manipulations (novel vs familiar, undrugged vs anticholinergic drugged), it is sensible to report results using a consistently pyramidal layer-referenced theta across the rats and conditions. We also report results using all the data, when cells/ensembles not referenced to pyramidal-layer theta are also included.
As far as we could tell from tetrode-bundle movement records, changes in electrode positioning across testing conditions were generally minimal. Relative to the NOV + SAL condition, average tetrode-bundle movement up or down was as follows (FAM + SAL: mode: 0 μm change, mean ± SEM: 14 ± 11 μm above, n = 7 ensembles; FAM + SCOP: mode = 0 μm change, mean 20 ± 12 μm below, n = 8 ensembles; NOV + SCOP: mode: 0 μm change, mean 10 ± 22 μm below, n = 11 ensembles). Each testing condition likely contains a minority of cells sampled in other testing conditions.
Cell-by-cell analysis.
Phase changes at the cell level were investigated using two overlapping datasets: (1) all the available cells that were referenced to pyramidal-layer theta, this dataset is called “all pyramidal layer-referenced” and (2) all the available cells regardless of referencing, this dataset is called “no exclusions.” Thereafter, various selection criteria were applied to create four categories of analysis, ranging from using all cells through to applying a minimum-spikes threshold and theta-modulation threshold (Rayleigh p < 0.05). Table 2 provides a comprehensive summary of the results for each testing condition using the two overlapping datasets and four categories of analysis.
Table 2.
Single cell level analysis of preferred theta-phase changes for the four testing conditions
| Cell selection |
Cell count |
Length of mean vector (r) |
Mean preferred phase ± SEM |
Phase change significance T3 vs T4 | ||||||
|---|---|---|---|---|---|---|---|---|---|---|
| Spikes | Theta-mod. | Samples | T3 | T4 | T3 | T4 | T3 | T4a | ||
| FAM + SAL | ||||||||||
| All pyr. layer-referenced | No threshold | Independent | 64 | 64 | 0.68 | 0.70 | 225° ± 6° | 223° ± 6° | p = 0.81 (W–W) | |
| ≥20 | / | Independent | 64 | 63 | 0.68 | 0.72 | 225° ± 6° | 224° ± 6° | p = 0.92 (W–W) | |
| ≥50 | p < 0.05 | Independent | 58 | 59 | 0.70 | 0.73 | 225° ± 6° | 225° ± 6° | p = 0.93 (W–W) | |
| ≥50 | p < 0.05 | Paired | 57 | 57 | 0.71 | 0.74 | 227° ± 6° | 224° ± 6° | p = 0.30 (Hotelling) | |
| 0.5 > p > 0.1 (Moore) | ||||||||||
| No exclusion | No threshold | Independent | 64 | 64 | 0.64 | 0.68 | 225° ± 7° | 222° ± 6° | p = 0.79 (W–W) | |
| ≥20 | / | Independent | 64 | 63 | 0.64 | 0.69 | 225° ± 7° | 224° ± 6° | p = 0.89 (W–W) | |
| ≥50 | p < 0.05 | Independent | 58 | 59 | 0.69 | 0.71 | 226° ± 6° | 225° ± 6° | p = 0.90 (W–W) | |
| ≥50 | p < 0.05 | Paired | 57 | 57 | 0.69 | 0.72 | 227° ± 7° | 224° ± 6° | p = 0.30 (Hotelling) | |
| 0.5 > p > 0.1 (Moore) | ||||||||||
| NOV + SAL | ||||||||||
| All pyr. layer-referenced | No threshold | Independent | 180 | 178 | 0.48 | 0.38 | 231° ± 6° | 263° ± 8° | p < 0.001 (W–W) | |
| ≥20 | / | Independent | 139 | 137 | 0.55 | 0.45 | 232° ± 6° | 261° ± 7° | p < 0.001 (W–W) | |
| ≥50 | p < 0.05 | Independent | 114 | 104 | 0.62 | 0.49 | 234° ± 5° | 266° ± 8° | p < 0.001 (W–W) | |
| ≥50 | p < 0.05 | Paired | 60 | 60 | 0.69 | 0.58 | 234° ± 6° | 268° ± 8° | p < 0.001 (Hotelling) | |
| p < 0.001 (Moore) | ||||||||||
| No exclusion | No threshold | Independent | 218 | 215 | 0.42 | 0.26 | 230° ± 6° | 270° ± 10° | p < 0.001 (W–W) | |
| ≥20 | / | Independent | 168 | 169 | 0.47 | 0.27 | 229° ± 6° | 266° ± 11° | p < 0.001 (W–W) | |
| ≥50 | p < 0.05 | Independent | 136 | 131 | 0.53 | 0.30 | 232° ± 6° | 275° ± 11° | p < 0.001 (W–W) | |
| ≥50 | p < 0.05 | Paired | 76 | 76 | 0.54 | 0.37 | 230° ± 8° | 273° ± 12° | p < 0.001 (Hotelling) | |
| p < 0.001 (Moore) | ||||||||||
| FAM + SCOP | ||||||||||
| All pyr. layer-referenced | No threshold | Independent | 111 | 111 | 0.53 | 0.68 | 228° ± 7° | 190° ± 5° | p < 0.001 (W–W) | |
| ≥20 | / | Independent | 100 | 108 | 0.54 | 0.69 | 231° ± 7° | 191° ± 5° | p < 0.001 (W–W) | |
| ≥50 | p < 0.05 | Independent | 82 | 82 | 0.63 | 0.74 | 232° ± 6° | 190° ± 5° | p < 0.001 (W–W) | |
| ≥50 | p < 0.05 | Paired | 65 | 65 | 0.70 | 0.80 | 233° ± 6° | 196° ± 5° | p < 0.001 (Hotelling) | |
| p < 0.001 (Moore) | ||||||||||
| No exclusion | No threshold | Independent | 126 | 126 | 0.45 | 0.67 | 227° ± 8° | 190° ± 5° | p < 0.001 (W–W) | |
| ≥20 | / | Independent | 114 | 123 | 0.45 | 0.68 | 230° ± 8° | 190° ± 5° | p < 0.001 (W–W) | |
| ≥50 | p < 0.05 | Independent | 93 | 97 | 0.52 | 0.73 | 231° ± 7° | 188° ± 5° | p < 0.001 (W–W) | |
| ≥50 | p < 0.05 | Paired | 76 | 76 | 0.56 | 0.77 | 234° ± 8° | 193° ± 5° | p < 0.001 (Hotelling) | |
| p < 0.001 (Moore) | ||||||||||
| NOV + SCOP | ||||||||||
| All pyr. layer-referenced | No threshold | Independent | 115 | 120 | 0.42 | 0.28 | 234° ± 9° | 120° ± 13°*** | p < 0.001 (W-W) | |
| ≥20 | / | Independent | 99 | 108 | 0.44 | 0.26 | 235° ± 9° | 124° ± 16°*** | p < 0.001 (W–W) | |
| ≥50 | p < 0.05 | Independent | 72 | 69 | 0.55 | 0.32 | 239° ± 8° | 132° ± 15°*** | p < 0.001 (W–W) | |
| ≥50 | p < 0.05 | Paired | 40 | 40 | 0.43 | 0.28 | 242° ± 14° | 114° ± 23°* | p < 0.001 (Hotelling) | |
| p < 0.001 (Moore) | ||||||||||
| No exclusion | No threshold | Independent | 197 | 205 | 0.27 | 0.18 | 247° ± 11° | 77° ± 16°*** | p < 0.001 (W–W) | |
| ≥20 | / | Independent | 167 | 181 | 0.30 | 0.17 | 253° ± 10° | 75° ± 18°** | p < 0.001 (W–W) | |
| ≥50 | p < 0.05 | Independent | 126 | 129 | 0.40 | 0.15 | 255° ± 9° | 65° ± 23°* | p < 0.001 (W–W) | |
| ≥50 | p < 0.05 | Paired | 80 | 80 | 0.32 | 0.24 | 269° ± 14° | 50° ± 19°* | p < 0.001 (Hotelling) | |
| p < 0.001 (Moore) | ||||||||||
For each testing condition, phase change was investigated at the cell level using all available cells (no exclusions) or all available cells that could be referenced to pyramidal-layer theta (All pyr. layer-referenced). For each of these datasets, four analyses are presented using different cell selection criteria. Cell selection becomes more conservative according to the following: (1) minimum number of spikes fired during a trial; (2) minimum theta-modulation (Rayleigh p threshold p = 0.05); 3) whether spike and theta-modulation criteria are met in either one of T3 and T4 (independent samples) or in both trials T3 and T4 (paired samples). The overall distribution of the preferred theta -phases of cells were strongly clustered around the “&lquote;mean preferred phase” in all conditions (Rayleigh test ps < 0.001) except in the probe trial (T4) in the NOV + SCOP condition where, relative to the other three testing conditions, some distributions were not that far below the significance threshold for the Rayleigh test for nonuniformity (asterisks). For paired samples, both the nonparametric paired-samples Moore test and the parametric Hotelling test were applied, with similar results.
aAll p values for T4 Rayleigh test indicating reliability of mean preferred phase in T4 were p < 0.001 except *** p ≤ 0.001, ** p < 0.01, * p < 0.05.
Statistical testing
Preferred phases in the first probe trial (T4) were compared with those in the baseline trial (T3) using the nonparametric paired-samples Moore test for circular means (Moore, 1980; Zar, 1999) or a Watson–Williams F test (W–W) for circular means of independent samples (Fisher, 1993), as appropriate. Preferred phase changes were considered to be coherent when the distribution of the preferred phases in each trial was sufficiently concentrated around the respective mean, as tested by the Rayleigh test for nonuniformity (p < 0.05). Phase analyses were conducted using the statistical software program Oriana 4 (Kovach Computing Services). Regarding circular paired-samples testing, the Moore test was preferred to the Hotelling test because the latter gave unreliable results with small, unevenly distributed samples of real and simulated data (i.e., those characteristic of baseline ensemble preferred phases). Accordingly, the Hotelling test was only used as a supplement to the Moore's test for cell-level testing, where samples had higher n and were more distributed (see Table 2 for similar results using both Hotelling and Moore's tests).
Linear t tests (e.g., for rate changes) were independent except where indicated (paired t). ANOVA tests were across-subjects, except where indicated (ANOVARM). For t tests and ANOVA, where variances were unequal, unequal variance correction was applied. Results were similar to those under assumptions of equal variance. Where Mauchly's test indicated that the sphericity assumption was violated, Greenhouse–Geisser correction was applied, as indicated by correction to the degrees of freedom. Results were similar to those under assumptions of sphericity.
Spatial firing analyses
Spatial information was calculated in bits/spike according to the formula in Skaggs et al. (1993) after applying the PxD maximum-likelihood correction procedure for inhomogeneity of sampling (Burgess et al., 2005). Directional bins were 15° in size, and locational bins were 2.5 × 2.5 cm in size. Boxcar smoothing was applied, using three directional bins centered on the current bin for directional smoothing, and 5 × 5 locational bins centered on the current bin for locational smoothing. To analyze remapping, locational firing rate maps for the novel environments were first transformed to the size and shape of the familiar environment as in Wills et al. (2005), then population vector analysis (Leutgeb et al., 2004; Kjelstrup et al., 2008) was used to provide a measure of the similarity of spatial firing rate maps between pairs of trials.
Results
Multiple single units were recorded simultaneously with LFPs from the dorsal CA1 pyramidal layer of six freely foraging rats. After familiarization to a familiar environment (FAM; at least 4 d of four 15 min trials), they were tested in four separate sessions: in the familiar environment after saline injection (FAM + SAL); in a novel environment after saline injection (NOV + SAL); in the familiar environment after scopolamine injection (FAM + SCOP); and in a novel environment after scopolamine injection (NOV + SCOP), see Materials and Methods.
All test sessions began with three trials (T1–3) in the FAM environment, and intraperitoneal injection was always given after T3. This was followed by either a trial (T4) in the FAM environment (FAM + SAL session) or three trials (T4–6) in the FAM environment (FAM + SCOP session) or two trials (T4–5) in a NOV environment and a trial (T6) in the FAM environment (NOV + SAL and NOV + SCOP sessions).
In total, 616 CA1 place cells were recorded from the four test conditions as follows: FAM + SAL (n = 65, 4 rats); NOV + SAL (n = 219, 6 rats); FAM + SCOP (n = 126, 4 rats); and NOV + SCOP (n = 206, 6 rats). The timing of place cell firing with respect to the theta oscillation was investigated at two levels: the spike ensemble level (i.e., all spikes recorded from neighboring tetrodes, or multi-unit activity) and the single cell level. The spike ensemble level may represent CA1 population activity from the perspective of downstream neurons. The single cell level is typical for analysis of spatial coding and theta-phase precession. We first describe illustrative ensembles from individual rats in each of the four test conditions and then proceed to across-rat summary analyses.
Theta-phase analyses
CA1 ensemble firing theta phase is stable in a familiar environment before and after saline injection
Ensembles were referenced to CA1 pyramidal-layer theta (360/0° = peak, 180° = trough). Figure 3A shows a portion of raw (blue line) and filtered (gray line) theta from one rat recorded during a baseline trial. Two cycles from the above filtered theta LFP are used to illustrate the phase reference (Fig. 3B). Figure 3, C and D, shows, for two rats, the phase distribution of the spike ensembles, with preferred theta phase occurring at ∼210–250° in the familiar environment (baseline; black line). The phase distribution is clearly unaffected by saline injection (brown line).
Figure 3.

CA1 ensembles show later preferred firing phases in novelty, an effect disrupted by scopolamine, and show earlier firing phases under scopolamine in familiarity. Examples of the firing phase distributions of CA1 ensembles in individual rats. A, Raw (blue) and filtered (6–12 Hz; gray) LFP trace recorded from CA1 pyramidal-layer showing approximately six theta cycles. B, Two theta cycles from trace in A are shown for illustrative purposes as the theta reference for the spike phase distributions below. C, D, The preferred phase is very stable in the familiar environment before and after saline injection (FAM + SAL). E, F, Novelty (NOV + SAL) elicits a later preferred phase compared with the baseline familiar trial T3 (FAMPre), but the distribution reverts to baseline on return to the familiar environment (FAMPost). G, H, Scopolamine elicits an earlier preferred phase in the familiar environment (FAM + SCOP), then the phase progressively approaches baseline phase as drug wears off over three (G) or six (H) sessions. I, J, Scopolamine blocks the novelty-induced later firing phase (NOV + SCOP).
CA1 ensemble firing shifts closer to the pyramidal-layer theta peak in a novel environment
Figure 3, E and F, illustrates the “later-theta-phase-in-novelty effect” in two rats. As in the FAM + SAL session, the preferred theta phase of an ensemble of CA1 place cell spikes typically occurred at ∼210–250° in the familiar environment (black line). Upon exposure to a novel environment, the distribution of spikes (blue line) shifted to a later phase, closer to the pyramidal-layer theta peak (e.g., preferred phase of 281° in Fig. 3E, and 350° in Fig. 3F). The phase distribution of spikes upon re-exposure to the familiar environment (gray line) closely resembles that seen in the baseline trial (black line). This later-theta-phase-in-novelty effect occurred whether the novel environment elicited very similar (Fig. 3E) or fewer (Fig. 3F) numbers of spikes compared with the familiar environment.
CA1 ensemble firing in a familiar environment shifts closer to the pyramidal-layer theta trough under scopolamine
Figure 3G illustrates how scopolamine injection shifts the phase distribution of spike firing in a familiar environment to an earlier phase, closer to the pyramidal-layer theta trough. The preferred phase in the trial immediately following scopolamine injection (FAM + SCOP1) was 209°, compared with 252° in the baseline trial. As scopolamine wore off, the preferred phase gradually approached that of the baseline trial (FAM + SCOP2: 216°; FAM + SCOP3: 244°). Figure 3H shows similar results in another rat, where the session was extended by another three trials. The preferred phase was 193° in the trial immediately following scopolamine injection (FAM + SCOP1), compared with 245° in the baseline trial, and progressively approached that of the baseline trial (FAM + SCOP3: 211°; FAM + SCOP6: 231°). The gradual return toward baseline in this rat following the scopolamine-induced shift to an earlier phase is usefully visualized in Figure 4, which displays absolute preferred phase values for each of trials T3–T9.
Figure 4.

Example of scopolamine eliciting earlier preferred phase in the familiar environment, and progressive return toward baseline phase as drug wears off. In one rat (rat 22, see also Fig. 3H), the FAM + SCOP session was extended by three trials (i.e., 9 trials in total), permitting observation of the drug effect wearing off. Preferred phase following scopolamine injection (T4, T5) is >50° earlier than baseline (T3) phase, then incrementally approaches (T6–T9) the baseline phase.
The shift of ensemble firing phase in a novel environment is disrupted by scopolamine
Figure 3, I and J, illustrates how scopolamine disrupts the later-theta-phase-in-novelty effect. Despite the exposure to novelty, the preferred phase did not shift later in the theta cycle. In fact, for these two rats, the preferred phase is earlier than in the familiar environment. However, preferred phase in this condition is rather variable across rats (see below and Fig. 5).
Figure 5.

Ensemble-level analyses show a later firing phase in novelty, which is disrupted by scopolamine, and an earlier firing phase under scopolamine in familiarity. To simplify visualizing all testing conditions together, the absolute value of each ensemble's preferred phase is normalized to premanipulation baseline trial (T3), by rotating ensemble-preferred phases for each session/rat such that preferred phase in T3 = 0°. In each trial, the across-rat mean of the preferred phases is shown, if reliable (i.e., Rayleigh test p < 0.05), by an arrow whose length represents r, the concentration of the distribution around the mean (i.e., length of the mean vector; circle radius = 1). A, Saline in the familiar environment did not elicit a change in the preferred phase of firing (FAM + SAL: T3 vs T4: +2°; Rayleigh T4: p < 0.01). B, Environmental novelty induced a coherent later preferred phase of firing (NOV + SAL: T3 vs T4: +46°; Rayleigh T4: p < 0.01). C, Scopolamine in the familiar environment had an opposite effect to novelty: it induced a coherent earlier phase of firing (FAM + SCOP: T3 vs T4: −34°; Rayleigh T4: p = 0.01). D, The novelty-induced shift to a later phase was disrupted by scopolamine (NOV + SCOP); there was no coherent change associated with the combination of novelty and scopolamine (Rayleigh T4: p = 0.35).
Ensemble analyses confirm the later firing phase in novelty, its disruption by scopolamine, and the earlier phase under scopolamine in familiarity
We tested the reliability of the above effects over the whole dataset by using the paired-samples Moore test (Moore, 1980; Zar, 1999). We focused on the comparison between the baseline trial T3 and the first probe trial T4. In the ensemble-level analysis, each trial's theta-phase distribution of spikes was represented by the ensemble's preferred phase (all Rayleigh ps<0.001). For simplicity, the results described below are for the best pyramidal layer-referenced analysis. Table 1 comprehensively documents the similar results obtained under less conservative analyses.
In the familiar environment, saline injection did not significantly shift ensembles' preferred phase (nonsignificant net phase change: +1°: mean ± SEM: T3: 224° ± 24°, T4: 225° ± 23°; n = 4 rats; Moore: R′ = 0.26, 0.9>p > 0.5; phase concentration: T3: p = 0.037, T4: p = 0.032, Rayleigh test). However, exposure to a novel environment under saline shifted the mean preferred phase of the ensembles later, that is, toward the pyramidal-layer theta peak (significant coherent phase change: +48°: T3: 243° ± 12°, T4: 291° ± 21°; n = 6 rats; Moore: R′ = 1.29, p < 0.005; phase concentration: T3: p = 0.001, T4: p = 0.017). In contrast, scopolamine injection in a familiar environment shifted the ensemble mean preferred phase earlier, toward the pyramidal-layer theta trough (significant coherent phase change: −34°: T3: 224° ± 23°, T4: 190° ± 13°; n = 4 rats; Moore: R′ = 1.20, p < 0.01; phase concentration: T3: p = 0.032, T4: p = 0.013). Finally, when injected before exposure to novelty, scopolamine disrupted the shift to a later theta phase observed under novelty (nonsignificant, noncoherent net phase change: −78°: T3: 224° ± 17°, T4: 146° ± 134°; n = 5 rats; Moore: R′ = 1.02; 0.1>p > 0.05; phase concentration: T3: p = 0.009, T4: p = 0.61).
Importantly, differences in preferred theta phase were not due to changes in phase concentration. We calculated a concentration change index as [T4 − T3]/[T3 + T4] for r, the length of the mean vector. Concentration change values were rather similar across manipulations (all available rats/sessions: mean ± SEM: FAM + SAL: −0.013 ± 0.021; NOV + SAL: −0.097 ± 0.116; FAM + SCOP: −0.023 ± 0.124; NOV + SCOP: −0.006 ± 0.228; ANOVA: F(3,15) = 0.09, p = 0.97; four rats common to all noncontrol conditions: NOV + SAL: −0.003 ± 0.058, FAM + SCOP: −0.023 ± 0.124, NOV + SCOP: −0.079 ± 0.280; ANOVARM: F(1.02,3.05) = 0.11, p = 0.77).
The effects of the four manipulations in the whole dataset may be best visualized by plotting the preferred theta phase of each ensemble in each trial with respect to the baseline trial (T3), as shown in Figure 5. Ensemble preferred phases are normalized to 0° in baseline T3, and those in trials T2–6 are rotated accordingly (rotated preferred phases, see Lever et al., 2010). (Thus, a preferred phase near 0° in this figure does not correspond to maximal firing at the pyramidal-layer theta peak, but indicates similarity to the baseline trial phase.) Figure 5A shows that the ensemble-preferred theta phases in the familiar environment were remarkably stable across the premanipulation baseline trials (T2–3), and clearly unaffected by saline injection (nonsignificant net change: +2° in T4; phase concentration: T4: p = 0.008, Rayleigh test). However, in the novel environment under saline, ensemble firing phases shifted to a later theta phase (significant, coherent phase change: +46° in T4, +42° in T5; phase concentration T4: p = 0.008, T5: p = 0.011; Fig. 5B), and were remarkably stable across the premanipulation baseline trials (T2–3) and upon return to the familiar environment (T6). Figure 5C shows that ensemble-preferred firing phases in the familiar environment shifted to an earlier theta phase immediately following scopolamine injection (significant coherent phase change: −34° in T4; phase concentration T4: p = 0.012), and then approached the baseline phase as scopolamine wore off (−30° in T5, −16° in T6; phase concentration T5: p = 0.013, T6: p = 0.009). Ensemble phases were stable across the premanipulation baseline trials (T2–3). Figure 5D illustrates that ensemble-preferred firing phases under scopolamine did not shift to a later theta phase despite the exposure to novelty. In fact, the absolute preferred phase in novelty (T4, T5) was earlier but by a variable amount across rats (nonsignificant, noncoherent, net phase change: T4: −68°, phase concentration: p = 0.35; T5: −49°, phase concentration: p = 0.28). We discuss the potential cause for this variability (see Discussion). Here, we note that one ensemble's preferred phases across the premanipulation baseline trials (T2–3) were not as stable as those seen in the three other testing conditions. The distribution of phases upon return to the familiar environment (T6) appeared bimodal, with three rats showing a return to the baseline phase, and two rats showing an earlier phase, perhaps reminiscent of the incomplete wearing off of scopolamine in the FAM + SCOP condition (Fig. 3G,H).
Referencing ensemble phase to the premanipulation baseline trial (T3) enabled us to specifically compare the effect of the novelty manipulation under saline to that under scopolamine. Here, putting to one side the issue of the variability of the novelty plus scopolamine responses, we directly compared the normalized T4 ensemble preferred phase values for the two novelty conditions. This confirmed that scopolamine disrupted the later-phase-in-novelty effect characteristic of the undrugged state (T4–T3: NOV + SAL: +46° ± 18°, n = 6 rats; NOV + SCOP: −68° ± 45°, n = 5 rats; W–W test: F(1,9) = 8.48, p = 0.017). This disruption is also seen with more liberal ensemble inclusion criteria (W–W test: all pyramidal layer-referenced: p = 0.001; no exclusions: p = 0.005).
Single cell analyses confirm the later firing phase in novelty, its disruption by scopolamine, and the earlier phase under scopolamine in familiarity
Analysis of spiking activity with respect to theta in individual cells showed similar results to those at the ensemble level. Below, we report results for all cells with theta-modulated firing (Rayleigh p ≤ 0.05) and with ≥50 spikes in trial T3 or T4 provided they were from an ensemble referenced to a pyramidal-layer LFP. Results were similar with other criteria (see Table 2). Figure 6 shows, for each session, the distribution of preferred theta phases of individual cells in the premanipulation baseline trial (T3, FAM) and first probe (T4) trials. In all four sessions, the mean preferred firing phase in the baseline trial was in the 220–240° range (i.e., 40–60° after the pyramidal-layer theta trough), consistent with previous reports of the preferred phase of CA1 pyramidal cells (Csicsvari et al., 1999; Mizuseki et al., 2009; Mizuseki et al., 2011).
Figure 6.
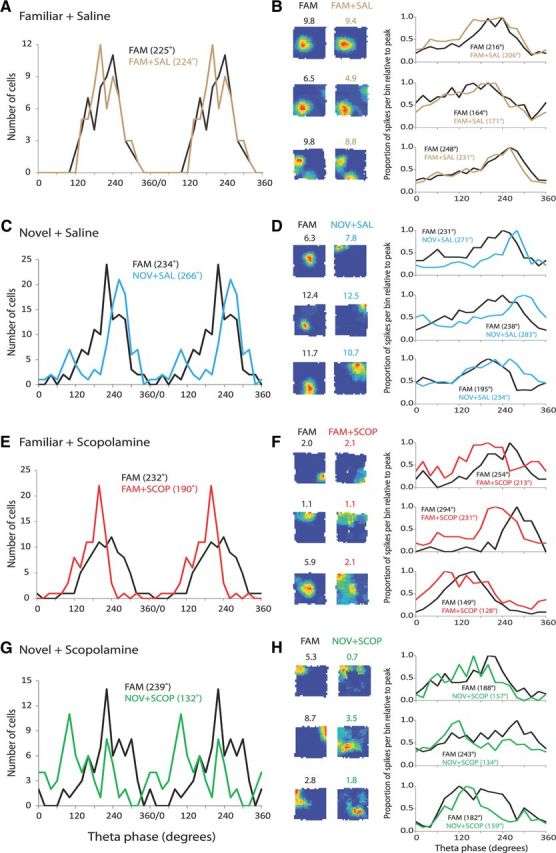
Distribution of each cell's mean theta phase of firing shows: a later phase in novelty, which is disrupted by scopolamine, and an earlier phase under scopolamine in familiarity. Left columns A, C, E, G, Distribution of mean theta phase for all selected cells (≥50 spikes and theta modulated). B, D, F, H, Left columns show firing rate maps (maps from the novel environments transformed to match the shape and size of the familiar environment; spatial peak rate in Hz shown above each plot); right columns show spike phase distributions, for both baseline and probe trials for three representative cells in each session.
Figure 6A illustrates that saline injection in the familiar environment did not change cells' preferred phase (nonsignificant net change: −1°: T3: 225° ± 6°, n = 58; T4: 224° ± 6°, n = 59; W–W test: F(1,115) = 0.01, p = 0.93; phase concentration T3: p ≪ 0.001, T4: p ≪ 0.001, Rayleigh tests). Figure 6B shows examples of three individual cells. In contrast, environmental novelty under saline (Fig. 6C) shifted the preferred theta phase of cells later, that is, toward the pyramidal-layer theta peak (significant coherent phase change: +32°: T3: 234°± 5°, n = 114; T4: 266° ± 8°, n = 104; W–W test: F(1,216) = 13.38, p < 0.001; phase concentration: T3: p ≪ 0.001, T4: p ≪ 0.001; Fig. 6D shows examples). Figure 6E illustrates that in a familiar environment, scopolamine injection shifted preferred phase earlier, toward the pyramidal-layer theta trough (significant coherent phase change: −42°: T3: 232°± 6°, n = 82; T4: 190°± 5°, n = 82; W–W test: F(1,162) = 28.28, p < 0.001; phase concentration: T3: p ≪ 0.001, T4: p ≪ 0.001; Fig. 6F shows examples). When administered before exposure to novelty, scopolamine clearly disrupted the coherent shift to a later theta phase in novelty characteristic of the undrugged state. This combined manipulation resulted in a multipeaked distribution of preferred phases (Fig. 6G), with an earlier phase overall (significant coherent phase change: −107°; T3: 239° ± 8°, n = 72; T4: 132° ± 15°, n = 69; W–W test: F(1,139) = 53.83, p < 0.001; phase concentration: T3: p ≪ 0.001, T4: p < 0.001; Fig. 6H shows examples).
The between-condition differences in theta-phase preference as a result of the manipulations were not driven by differences in spike phase concentration of the cells. We analyzed this in two ways by using a concentration change index of the means for trials T3 and T4 ([T4 − T3]/[T3 + T4]) at the cell level or rat level. First, phase concentration change indices at the cell level did not differ across the three conditions (mean ± SEM for NOV + SAL: 0.00 ± 0.03, n = 60; FAM + SCOP: −0.09 ± 0.03, n = 65; NOV + SCOP: 0.00 ± 0.04, n = 40; ANOVA: F(2,164) = 2.21, p = 0.11). Second, the phase concentration change indices were not significantly different when compared at the rat level (for the four rats tested in all three noncontrol testing conditions) when considering cells that were theta modulated and fired ≥50 spikes in both trials T3 and T4 (mean ± SEM for NOV + SAL: −0.04 ± 0.05; FAM + SCOP: −0.11 ± 0.06; NOV + SCOP: −0.02 ± 0.09; ANOVARM: F(2,6) = 0.54; p = 0.61) or all the cells (mean ± SEM for NOV + SAL: 0.02 ± 0.04; FAM + SCOP: −0.17 ± 0.05; NOV + SCOP: −0.12 ± 0.15; ANOVARM: F(2,6) = 1.85, p = 0.24).
In summary, cell-level analyses showed a similar pattern of results to the ensemble-level analyses. Novelty elicited a later theta phase of firing, an effect disrupted by scopolamine. This result was consistent with scopolamine eliciting an earlier theta phase in the familiar environment, that is, producing an effect opposite to the effect of novelty.
Additional analyses: firing rate and running speed do not account for the phase changes
Firing rate has been hypothesized by some to explain theta-phase precession, with higher firing rates presumed to drive an earlier phase under some models (Harris et al., 2002; Mehta et al., 2002). Other studies indicate an independence of phase and rate, or at least no simple direct relationship (Hirase et al., 1999; Huxter et al., 2003; Allen et al., 2012; Royer et al., 2012). We investigated if the later-phase-in-novelty (NOV + SAL) and the earlier-phase-under-scopolamine (FAM + SCOP and NOV + SCOP) effects could simply be explained by changes in firing rate. We examined global mean rate and spatial peak rate for theta-modulated cells firing ≥50 spikes in the baseline and probe trial.
The global firing rate did not differ across the baseline and probe trials (T3 vs T4) in any of the three testing conditions: pyramidal layer-referenced: NOV + SAL (T3: 0.78 ± 0.08 Hz, n = 114; T4: 0.64 ± 0.07 Hz, n = 104; t(216) = 1.40, p = 0.16), FAM + SCOP (T3: 0.75 ± 0.09 Hz, n = 82; T4: 0.63 ± 0.08 Hz, n = 82; t(162) = 1.03, p = 0.31) and NOV + SCOP (T3: 0.76 ± 0.11 Hz, n = 72; T4: 0.53 ± 0.07 Hz, n = 69; t(139) = 1.80, p = 0.07); no exclusions: NOV + SAL: (T3: 0.73 ± 0.07 Hz, n = 134; T4: 0.60 ± 0.06 Hz, n = 131; t(263) = 1.55, p = 0.12; FAM + SCOP (T3: 0.75 ± 0.08 Hz, n = 93; T4: 0.59 ± 0.07 Hz, n = 97; t(188) = 1.46, p = 0.15); NOV + SCOP (T3: 0.79 ± 0.08 Hz, n = 126; T4: 0.60 ± 0.06 Hz, n = 129; t(253) = 1.92, p = 0.06). Though there was some trend toward reduction, it was common to all three testing conditions as shown by comparing the average per rat rate change across the three conditions (pyramidal layer-referenced: NOV + SAL: −0.16 ± 0.09 Hz, n = 6; FAM + SCOP: −0.13 ± 0.11 Hz, n = 4; NOV + SCOP: −0.36 ± 0.10 Hz, n = 5; ANOVA: F(2,15) = 1.56, p = 0.25; no exclusions: NOV + SAL: −0.14 ± 0.09 Hz, n = 6; FAM + SCOP: −0.15 ± 0.09 Hz, n = 4; NOV + SCOP: −0.34 ± 0.11 Hz, n = 6; ANOVA: F(2,16) = 1.64, p = 0.23). Accordingly, changes in global mean rate cannot explain the three different patterns of preferred phase changes caused by the three experimental manipulations.
The average spatial peak rate of the theta-modulated cells firing ≥50 spikes in trials T3 or T4 was reduced by the manipulation (T3 vs T4), an effect that reached significance in the FAM + SCOP (T3: 6.3 ± 0.6 Hz, n = 82; T4: 4.4 ± 0.4 Hz, n = 82; t(142) = 2.64, p = 0.01) and NOV + SCOP (T3: 5.7 ± 0.5 Hz, n = 72; T4: 3.6 ± 0.4 Hz, n = 69; t(134) = 2.30, p = 0.02) conditions, but not in the NOV + SAL testing condition (T3: 6.7 ± 0.5 Hz, n = 114; T4: 5.7 ± 0.4 Hz, n = 104; t(216) = 1.68, p = 0.09). Direct comparison of the three testing conditions, by comparing the average per rat rate reduction of the above cells showed that the drop in spatial peak rate was not significantly different between them (NOV + SAL: −1.2 ± 0.8 Hz, n = 6; FAM + SCOP: −2.3 ± 0.5 Hz, n = 4; NOV + SCOP: −2.0 ± 0.7 Hz, n = 5; ANOVA: F(2,15) = 0.96, p = 0.41).
Nevertheless, we considered the potential confound of spatial peak rate differences as follows. We reanalyzed the cell-level data restricting analysis to those cells that fired robustly (≥50 spikes, theta modulated) in both the baseline (T3) and first probe trial (T4). Then, cells were ranked by their change of spatial peak rate from baseline to probe trial (rate change index = [T4 − T3]/[T3 + T4]). The change in spatial peak rate was then equalized to zero (0.0) between the three testing conditions by removing cells with the strongest peak rate reduction. For each testing condition, we describe results using cells from the all pyramidal layer-referenced ensembles, and those obtained using all available cells (no exclusions). Results were similar to the main analyses summarized above and shown in Table 2.
Novelty elicited a significant coherent phase change to a phase ∼40–45° later than baseline (all pyramidal layer-referenced: 9 cells removed, n = 51 remaining; T3: 233° ± 7°, T4: 270° ± 8°; Moore: R′ = 2.36, p < 0.001; Rayleigh: T3: p ≪ 0.001, T4: P≪0.001; no exclusions: 7 cells removed, n = 69 remaining; T3: 231° ± 8°, T4: 276° ± 11°; Moore: R′ = 2.54, p < 0.001; phase concentration T3: p ≪ 0.001, T4: p < 0.001, Rayleigh test). In the familiar environment, scopolamine induced a significant coherent phase change to a phase ∼45–50° earlier than baseline (all pyramidal layer-referenced: 22 cells removed, n = 43 remaining; T3: 243° ± 7°, T4: 198° ± 6°; Moore: R′ = 2.46, p < 0.001; phase concentration T3: p ≪ 0.001, T4: p ≪ 0.001; no exclusions: 27 cells removed, n = 49 remaining; T3: 248° ± 10°, T4: 197° ± 6°; Moore: R′ = 2.59, p < 0.001; phase concentration T3: p ≪ 0.001, T4: p ≪ 0.001). The distribution of cells' preferred phases was different across the baseline trial and the novel environment under scopolamine, but there was no coherent change in phase: phase distribution in the novelty-plus-scopolamine trial did not differ from a uniform distribution (all pyramidal layer-referenced: 13 cells removed, n = 27 remaining; T3: 254° ± 17°, T4: 134° ± 36°; Moore: R' = 1.46, p < 0.005; phase concentration T3: p = 0.005, T4: p = 0.29; ‘no exclusions’: 29 cells removed, n = 51 remaining; T3: 274° ± 14°, T4: 3° ± 34°; Moore: R′ = 1.73, p < 0.001; phase concentration T3: p < 0.001, T4: p = 0.24).
In sum, the drop in spatial peak firing rate that occurs under both novelty and scopolamine is unlikely to explain the bidirectional phase changes elicited by these manipulations, nor the disruption by scopolamine of the coherent shift to a later phase in environmental novelty characteristic of the undrugged state.
The effect of running speed on phase was also investigated because higher running speeds tend to drive higher firing rates (Hirase et al., 1999; Geisler et al., 2007), and thus might be thought, under some models (Harris et al., 2002; Mehta et al., 2002), to drive earlier phases. However, the earlier phase in the familiar environment under scopolamine accompanied speed reduction (T3: 20.9 ± 1.4 cm/s; T4: 13.4 ± 1.8 cm/s; paired t(3) = 6.12, p = 0.009), contrary to such an expectation. Further, the phase in the novel environment under saline was later despite no change in speed (T3: 18.9 ± 1.4 cm/s; T4: 19.1 ± 1.7 cm/s; paired t(5) = 0.12, p = 0.91). Under scopolamine, novelty induced a nonsignificant speed reduction (T3: 19.1 ± 1.5 cm/s; T4: 16.8 ± 1.6 cm/s; paired t(4) = 0.86, p = 0.44) while phase change was variable and if anything earlier. In summary, neither firing rate nor running speed is likely to account for the observed bidirectional phase changes.
Scopolamine impairs the encoding of novel spatial representations
What kind of changes in spatial firing patterns accompanied the observed firing phase changes? ACh-based models of encoding versus retrieval scheduling predict that scopolamine impairs encoding. Applied to spatial representations, the prediction is thus that scopolamine should impair the emergence of a distinct spatial map in a novel environment (i.e., scopolamine should reduce levels of novelty-elicited remapping). We used population vector analysis of spatial firing rate maps to calculate a “spatial similarity score” for the place cell ensembles. We first describe results using cells from the best pyramidal layer-referenced ensembles, then summarize very similar results obtained using all available cells. Figure 7A shows that spatial firing patterns across the two premanipulation baseline trials (T2 vs T3) were very stable, and nearly identically so, in the four sessions (all four session T2 vs T3 r values between 0.92 ± 0.01 and 0.94 ± 0.01), providing a good baseline against which to measure changes.
Figure 7.

Scopolamine attenuates the formation of distinct representations of new environments. A, The four testing conditions differentially affect place cells' environmental representations. Representations are very stable across premanipulation baseline trials T2 and T3 for all four sessions, and do not change after saline injection in the familiar environment (FAM + SAL). Novelty induces strong remapping (i.e., low population-vector spatial similarity scores across T3 and T4) in the undrugged state (NOV + SAL), but this is attenuated by scopolamine (NOV + SCOP). Scopolamine in the familiar environment (FAM + SCOP) does not induce remapping but modestly reduces spatial stability. For illustrative purposes, SEM error bars indicate the variance due to the condition (T2 vs T3 or T3 vs T4); variance due to individual differences has been removed, as in Cousineau (2005). B, Scopolamine reduces the amount of novelty-elicited remapping (difference between spatial similarity scores [T2 vs T3] and [T3 vs T4]) in each of the five rats tested in both environmental novelty sessions.
Saline injection in the familiar environment did not have a significant effect on spatial map stability (Fig. 7A; T3 vs T4: 0.93 ± 0.01; T2 vs T3 vs T3 vs T4, paired t(3) = 1.71, p = 0.19): the place fields in the familiar environment remained very similar before and after saline. Scopolamine in the familiar environment modestly reduced spatial reproducibility (Fig. 7A; T3 vs T4: 0.74 ± 0.04; T2 vs T3 vs T3 vs T4, paired t(3) = 5.90, p = 0.01), in line with previous observations (Brazhnik et al., 2003, 2004). Of particular interest here was the effect of novelty. As expected, the novelty manipulation under saline elicited strong remapping (Fig. 7A; T4 vs T3: 0.38 ± 0.06; T2 vs T3 vs T3 vs T4, paired t(5) = 10.88, p < 0.001). Interestingly, novelty also elicited remapping under scopolamine, but to a lesser extent (Fig. 7A; T4 vs T3: 0.52 ± 0.04; T2 vs T3 vs T3 vs T4: paired t(4) = 10.32, p < 0.001). We quantified the differences between the three noncontrol manipulations that reduced spatial similarity (i.e., excluding FAM + SAL) by calculating the baseline-to-probe spatial similarity reduction (i.e., spatial similarity score of T2 vs T3 minus spatial similarity score of T3 vs T4) for the four rats tested in all three testing conditions. The reduction in spatial similarity was strongest for novelty under saline (0.55 ± 0.07), moderate for novelty under scopolamine (0.39 ± 0.05), and minor for scopolamine in the familiar environment (0.18 ± 0.03), with each condition significantly different from each other (ANOVARM: F(1.02,3.06) = 37.36, p = 0.008; ps ≤0.01 for all post hoc LSD comparisons). As Figure 7B shows, the amount of novelty-elicited remapping was lower under scopolamine in each of the five rats tested in both novelty conditions (paired t(4) = 4.58, p = 0.01).
[Similar results were seen in analyses when all cells were included: (1) all rats, condition-by-condition: FAM + SAL (T2 vs T3: 0.92 ± 0.002, T3 vs T4: 0.92 ± 0.01; paired t(3) = 0.49, p = 0.66); FAM + SCOP (T2 vs T3: 0.92 ± 0.01, T3 vs T4: 0.75 ± 0.07; paired t(3) = 5.99, p = 0.009); NOV + SAL (T2 vs T3: 0.92 ± 0.01; T3 vs T4: 0.34 ± 0.04; paired t(5) = 14.15, p ≪ 0.001); NOV + SCOP (T2 vs T3: 0.92 ± 0.01, T3 vs T4: 0.49 ± 0.06; paired t(4) = 7.43, p = 0.001); (2) reduction in spatial similarity for four rats common to noncontrol conditions: NOV + SAL (0.60 ± 0.06); NOV + SCOP (0.39 ± 0.08), FAM + SCOP (0.17 ± 0.03); ANOVARM: F(2,6) = 39.76, p < 0.001; ps ≤0.04 for all post hoc LSD comparisons; and (3) reduction in spatial similarity for rats tested in both novelty conditions: NOV + SAL: 0.58 ± 0.04; NOV + SCOP: 0.43 ± 0.06; paired t(5) = 3.2, p = 0.02.)
In summary, upon exposure to novel environments, scopolamine significantly attenuated the distinctiveness of the spatial code for the new environment compared with the code for the familiar environment. This is clearly consistent with models of ACh's role in biasing encoding versus retrieval dynamics toward new encoding (Hasselmo et al., 1996; Meeter et al., 2004), and muscarinic cholinergic blockade antagonizing this effect.
Spatial information was reduced under scopolamine but this was not linked to impaired remapping in the novel environment
The results reported in the section above showed that, relative to saline injection, scopolamine injection decreased spatial reproducibility in the familiar environment and increased spatial reproducibility in the novel environment. We considered if this could be linked to scopolamine reducing the spatial locational information carried by the cells. For instance, it could be that more out-of-field firing under scopolamine would lower spatial reproducibility in the familiar environment and increase spatial reproducibility in the novel environment (assuming novelty-elicited remapping). This hypothesized link makes two directional predictions. The first prediction is that in the familiar-to-familiar environment condition (FAM + SCOP), the degradation in spatial information (T3 − T4 values) will be negatively correlated with spatial reproducibility. The second prediction is that in the familiar-to-novel environment condition (NOV + SCOP), T3 −T4 spatial information will be positively correlated with spatial reproducibility. If the second prediction is met, this would cast some doubt on the theoretical interpretation that ACh dampens novelty-elicited encoding.
We first tested if scopolamine reduces spatial information. We calculated spatial (locational) information in bits per spike in firing rate maps corrected for inhomogeneous sampling (Burgess et al., 2005). Saline did not significantly affect spatial information in either the familiar or novel environment (bits/spike: FAM + SAL: all cells: T3: 1.34 ± 0.07, n = 64, T4: 1.25 ± 0.09, n = 63, t(125) = 0.76, p = 0.45; theta-modulated cells ≥50 spikes: T3: 1.29 ± 0.07, n = 58, T4: 1.19 ± 0.08, n = 58, t(114) = 0.92, p = 0.36; NOV + SAL: all cells: T3: 1.62 ± 0.07, n = 196, T4: 1.80 ± 0.10, n = 193, t(340) = −1.48, p = 0.14; theta-modulated cells ≥50 spikes: T3: 1.28 ± 0.06, n = 130, T4: 1.13 ± 0.06, n = 124, t(252) = 1.92, p = 0.06).
In contrast, scopolamine did reduce spatial information in both familiar and novel environments (bits/spike: FAM + SCOP: all cells: T3: 1.55 ± 0.07, n = 122, T4: 0.88 ± 0.04, n = 121, t(194) = 8.22, p < 0.001; theta-modulated cells ≥50 spikes: T3: 1.37 ± 0.06, n = 93, T4: 0.86 ± 0.05, n = 95, t(171) = 6.61, p < 0.001; NOV + SCOP: all cells: T3: 1.48 ± 0.07, n = 188, T4: 1.09 ± 0.07, n = 180, t(366) = 3.77, p < 0.001; theta-modulated cells ≥50 spikes: T3: 1.15 ± 0.06, n = 124, T4: 0.84 ± 0.05, n = 121, t(243) = 4.02, p < 0.001). In summary, scopolamine did reduce, but saline did not reduce, spatial information in both the familiar and novel environments.
To quantify spatial reproducibility, we used the spatial reproducibility measure of Muller et al. (1987). It is less sensitive than the population vector method, but can be used on a cell-by-cell basis to test correlations between spatial information change and spatial reproducibility. The first prediction to be tested was that in the FAM + SCOP condition, T3 − T4 spatial information would be negatively correlated with spatial reproducibility. This directional prediction received some support (all cells, No exclusions: T3-T4 locational bits/spike vs T3 to T4 spatial reproducibility, r = −0.151, n = 118, one-tailed p = 0.05). This suggests that degradation in the locational firing signal from the baseline (T3) to the probe trial (T4) does contribute somewhat to lowering the spatial similarity of the spatial maps in the FAM + SCOP condition.
The second prediction to be tested was that in the NOV + SCOP condition, T3 − T4 spatial information would be positively correlated with spatial reproducibility. This prediction was not supported, r being nonsignificantly weakly negative (T3–T4 locational bits/spike vs T3 to T4 spatial reproducibility, r = −0.02, n = 164, two-tailed p = 0.79). Importantly, this suggests that degradation in the locational firing signal from the baseline (T3, familiar) to the probe trial (T4, novel) does not contribute to T3 to T4 spatial reproducibility across those trials in the NOV + SCOP condition. In other words, as far as we can tell, the increased spatial similarity of the spatial maps across the familiar and novel environment under scopolamine, relative to under saline, is probably not due to scopolamine-degraded spatial firing boosting spatial reproducibility. Rather, this increased spatial similarity appears to be due to scopolamine impairing the process of novelty-elicited remapping.
Discussion
The present study is the first to show bidirectional changes of the preferred theta phase of firing of CA1 pyramidal cells according to predicted changes in the balance between encoding and retrieval. Theta-phase models (Hasselmo et al., 2002; Kunec et al., 2005; Manns et al., 2007; Cutsuridis et al., 2010) imply that the preferred firing phase over a given period reflects the ratio of encoding and retrieval activity, with encoding preferentially occurring at the theta peak and retrieval, at the trough. Here, we specifically demonstrate, in line with these models, that the preferred firing phase shifts closer to the pyramidal-layer theta peak during novelty, when encoding should prevail. This extends a previous result (Lever et al., 2010), which did not use a consistent theta reference (see also Poe et al., 2000; Manns et al., 2007). Furthermore, we now show evidence for the ACh models (Hasselmo et al., 1996; Meeter et al., 2004) and their complementarity with theta-phase models. Hasselmo et al. (1996) specifically predicted that ACh would bias the encoding-retrieval dynamics toward encoding, while cholinergic blockade would bias the dynamics toward retrieval. This was shown in three effects, demonstrated here for the first time, of injecting the nonselective muscarinic antagonist scopolamine. Scopolamine attenuated the novelty-elicited formation of a new spatial map in a distinct environment, as shown by impaired place-cell remapping in the novel environments; it shifted the preferred firing phase in a familiar environment toward the theta trough, associated with retrieval; and it disrupted the coherent novelty-elicited shift of preferred phase toward the theta peak.
One limitation of the present study is that, while encoding likely prevails in novelty, and retrieval in familiarity, we have inferred, rather than directly measured, encoding and retrieval states. This caveat aside, our findings support predictions derived from both the theta-phase and ACh-based models of encoding versus retrieval scheduling and thus support their integration into a common framework (Barry et al., 2012; Easton et al., 2012; Hasselmo, 2012).
Novelty and neuromodulation
Our experiment specifically tested the contribution of ACh to the novelty response. Of course, other neuromodulators are released in novelty, such as dopamine (Lisman and Grace, 2005) and noradrenaline (Yu and Dayan, 2005). Thus, other neuromodulators than ACh may also play a role, and interact with ACh, in the responses to novelty observed here (preferred phase change, remapping). We note that preferred phase in the novel environments after scopolamine injection was somewhat variable, and that such variability was not seen in the familiar environment after scopolamine injection. Why? Importantly, we saw no evidence that theta-phase concentration was reduced by the novelty-plus-scopolamine probe relative to the other three conditions. Rather, the variability might result from the difficulty of standardizing the latency of a drug's peak effect in a specific brain area following intraperitoneal injections. The variability in phase change could arise from the variable latency of the scopolamine peak with respect to the introduction of environmental novelty, and thus with respect to the release of novelty-elicited neuromodulators. The variable relative latency of the scopolamine peak and neuromodulator-release peak may be critical as the interaction between neuromodulators can be quite complex. For example, acetylcholine and noradrenaline can have antagonistic interactions (Yu and Dayan, 2005). Their antagonistic action in the hippocampal response to novelty has been observed in rearing-on-hind-legs behavior (Lever et al., 2006). When muscarinic or β-adrenergic agonists are infused alone into the dentate gyrus, rearing substantially increases; however, when they are co-infused, rearing does not increase (Flicker and Geyer, 1982). In summary, muscarinic antagonism may have somewhat different effects when peaking before and after the novelty-elicited neuromodulator release peak.
Overall, however, despite some variability, a common result emerged from the novelty-plus-scopolamine condition; the later-theta-phase-in-novelty effect was clearly disrupted. Thus a conjoint prediction obtained from the theta-phase and ACh models was confirmed. ACh should shift the encoding-retrieval dynamics toward encoding (i.e., nearer pyramidal theta peak phase), and an anti-muscarinic drug should disrupt this shift toward encoding, as observed here.
Mechanisms underlying the later-theta-phase-in-novelty effect and its disruption
Together, our results demonstrate that ACh at least partly drives the later-theta-phase-in-novelty effect (i.e., the encoding-related shift of CA1 preferred phase toward the pyramidal-layer theta peak in novelty). This could be tested in future work by, for instance, enhancing cholinergic transmission in a familiar environment, and seeing if this elicits a later preferred theta phase of CA1 firing. Although the predictions of the ACh model (Hasselmo et al., 1996) confirmed in the present study were based specifically on ACh's presynaptic suppression of CA3's excitatory input onto CA1 pyramidal neurons (Hasselmo and Schnell, 1994), we cannot be certain of the neural sites underlying our effects, since we used systemic muscarinic blockade. Coordination of the later-theta-phase-in-novelty effect and thus encoding versus retrieval scheduling may also involve interneurons, which strongly influence the rhythmicity of pyramidal cells (Buzsáki, 2002; Freund and Katona, 2007; Klausberger and Somogyi, 2008). For example, parvalbumin-expressing interneurons influence pyramidal theta phase during phase precession (Royer et al., 2012) and some of these interneurons express muscarinic receptors (Hájos et al., 1998). ACh alters the coupling between pyramidal cells and interneurons (Pitler and Alger, 1992; Patil and Hasselmo, 1999; Brazhnik et al., 2003). Finally, changes of preferred theta phase in CA1 could also reflect upstream changes, such as in CA3. Interestingly, a theta phase-based modulation of afferent inputs to CA3 has been shown during novelty, an effect disrupted by cholinergic antagonism (Villarreal et al., 2007). These issues can be explored in future work using multisite recordings of principal cells and interneurons across entorhinal cortex, CA3, and CA1 (Mizuseki et al., 2009).
Place-cell remapping is a well established phenomenon and is related to encoding a representation of a new environment (Muller and Kubie, 1987; Kentros et al., 1998; Lever et al., 2002; Leutgeb et al., 2004; Wills et al., 2005; Fyhn et al., 2007; McHugh et al., 2007; Sava and Markus, 2008; Nakashiba et al., 2012). As our phase results with scopolamine suggest (shift toward theta trough in familiar environment and disruption of the later-phase-in-novelty effect), scopolamine may have reduced novelty-elicited remapping by setting the encoding-retrieval dynamics toward retrieval. This is compatible with results following selective lesion of the cholinergic input to the hippocampus (Ikonen et al., 2002), whereby place cells initially remapped in a novel environment, but converged over a few trials toward the patterns observed in the familiar environment. Our data are also consistent with the observation that scopolamine reduces hippocampal expression of immediate early genes following environmental novelty (Wirtshafter, 2005).
Functional implications: two complementary mechanisms of encoding versus retrieval scheduling
We refer to the theta-phase and ACh-based models of Meeter et al. (2004), Easton et al. (2012), and Hasselmo (2012) as models of encoding versus retrieval scheduling. Both sets of models instantiate solutions to proactive interference, a potentially ubiquitous problem occurring when a previous association with a cue interferes with encoding a new association with that cue. Broadly speaking, in both sets of models, appropriate synaptic plasticity regimes are scheduled for each state: long-term synaptic strengthening for encoding, but not for retrieval (Hasselmo, 2012), and encoding and retrieval states are separated so that retrieval of prior associations does not interfere with encoding new associations.
A potential limitation of ACh-based encoding versus retrieval scheduling is ACh's slow action, and thus the relatively slow transition between pro-encoding and pro-retrieval states. In the theta-based models, the alternation of these states occurs much more rapidly. It is likely adaptive that the hippocampus uses both mechanisms of encoding versus retrieval scheduling, with their different timescales of action. Our data are clearly consistent with both models, since we used these models to make the predictions supported here as follows: (1) preferred phase shifts closer to the pyramidal-layer theta peak in novelty, when encoding prevails; (2) this encoding-related shift is disrupted by scopolamine, suggesting that ACh partly drives it; (3) scopolamine in a familiar environment shifts preferred phase closer to the pyramidal-layer theta trough, consistent with low ACh levels biasing encoding-retrieval dynamics away from encoding toward retrieval; and (4) scopolamine reduces novelty-elicited remapping, consistent with low ACh levels biasing encoding-retrieval dynamics away from encoding. In summary, cholinergic-based and theta-based mechanisms are likely complementary means of biasing activity toward encoding or retrieval in the hippocampus.
There is direct evidence for encoding versus retrieval biasing at longer and shorter timescales. Briefly, longer timescale encoding versus retrieval biasing, consistent with cholinergic action, is seen by (Duncan et al., 2012), which showed that pattern separation (implying a pro-encoding bias) was enhanced if preceded by 0.5 s by a novel stimulus, but not by a familiar stimulus. Evidence for rapid, theta-paced encoding versus retrieval scheduling was seen in CA3 place cells flickering between distinct representations of two environments (Jezek et al., 2011). Transitions between representations tended to occur at a particular theta phase, and attractor-based retrieval activity appeared dominant in one-half of the theta cycle.
In summary, our results strongly suggest that both theta phase and ACh are involved in temporal scheduling of encoding versus retrieval in CA1, and form part of the neural mechanisms for counteracting proactive interference, a classic problem for memory.
Footnotes
This research was supported by grant funds from the Biotechnology and Biological Sciences Research Council, Royal Society, Wellcome Trust, Medical Research Council, and EU SpaceBrain, and a PhD studentship (V.D.) and research funds (C.L.) from the Institute of Psychological Sciences, University of Leeds. We thank Dr. Tom Wills (University College London) for additional MATLAB code, Dr. Caswell Barry for useful discussion, Charles Taylor (Leeds) for advice on circular statistics, and Sarah Simmonds for help with data processing.
The authors declare no competing financial interests.
References
- Allen K, Rawlins JN, Bannerman DM, Csicsvari J. Hippocampal place cells can encode multiple trial-dependent features through rate remapping. J Neurosci. 2012;32:14752–14766. doi: 10.1523/JNEUROSCI.6175-11.2012. [DOI] [PMC free article] [PubMed] [Google Scholar]
- Antonova E, Parslow D, Brammer M, Simmons A, Williams S, Dawson GR, Morris R. Scopolamine disrupts hippocampal activity during allocentric spatial memory in humans: an fMRI study using a virtual reality analogue of the Morris Water Maze. J Psychopharmacol. 2011;25:1256–1265. doi: 10.1177/0269881110379285. [DOI] [PubMed] [Google Scholar]
- Atri A, Sherman S, Norman KA, Kirchhoff BA, Nicolas MM, Greicius MD, Cramer SC, Breiter HC, Hasselmo ME, Stern CE. Blockade of central cholinergic receptors impairs new learning and increases proactive interference in a word paired-associate memory task. Behav Neurosci. 2004;118:223–236. doi: 10.1037/0735-7044.118.1.223. [DOI] [PubMed] [Google Scholar]
- Barry C, Heys JG, Hasselmo ME. Possible role of acetylcholine in regulating spatial novelty effects on theta rhythm and grid cells. Front Neural Circuits. 2012;6:5. doi: 10.3389/fncir.2012.00005. [DOI] [PMC free article] [PubMed] [Google Scholar]
- Brankack J, Stewart M, Fox SE. Current source density analysis of the hippocampal theta rhythm: associated sustained potentials and candidate synaptic generators. Brain Res. 1993;615:310–327. doi: 10.1016/0006-8993(93)90043-M. [DOI] [PubMed] [Google Scholar]
- Brazhnik ES, Muller RU, Fox SE. Muscarinic blockade slows and degrades the location-specific firing of hippocampal pyramidal cells. J Neurosci. 2003;23:611–621. doi: 10.1523/JNEUROSCI.23-02-00611.2003. [DOI] [PMC free article] [PubMed] [Google Scholar]
- Brazhnik E, Borgnis R, Muller RU, Fox SE. The effects on place cells of local scopolamine dialysis are mimicked by a mixture of two specific muscarinic antagonists. J Neurosci. 2004;24:9313–9323. doi: 10.1523/JNEUROSCI.1618-04.2004. [DOI] [PMC free article] [PubMed] [Google Scholar]
- Burgess N, Cacucci F, Lever C, O'Keefe J. Characterizing multiple independent behavioral correlates of cell firing in freely moving animals. Hippocampus. 2005;15:149–153. doi: 10.1002/hipo.20058. [DOI] [PMC free article] [PubMed] [Google Scholar]
- Buzsáki G. Theta oscillations in the hippocampus. Neuron. 2002;33:325–340. doi: 10.1016/S0896-6273(02)00586-X. [DOI] [PubMed] [Google Scholar]
- Buzsáki G. Rhythms of the brain. New York: Oxford UP; 2006. [Google Scholar]
- Colgin LL, Denninger T, Fyhn M, Hafting T, Bonnevie T, Jensen O, Moser MB, Moser EI. Frequency of gamma oscillations routes flow of information in the hippocampus. Nature. 2009;462:353–357. doi: 10.1038/nature08573. [DOI] [PubMed] [Google Scholar]
- Cousineau D. Confidence intervals in within-subject designs: a simpler solution to Loftus and Masson's method. Tutorials Quant Methods Psychol. 2005;1:75–78. [Google Scholar]
- Csicsvari J, Hirase H, Czurkó A, Mamiya A, Buzsáki G. Oscillatory coupling of hippocampal pyramidal cells and interneurons in the behaving Rat. J Neurosci. 1999;19:274–287. doi: 10.1523/JNEUROSCI.19-01-00274.1999. [DOI] [PMC free article] [PubMed] [Google Scholar]
- Cutsuridis V, Cobb S, Graham BP. Encoding and retrieval in a model of the hippocampal CA1 microcircuit. Hippocampus. 2010;20:423–446. doi: 10.1002/hipo.20661. [DOI] [PubMed] [Google Scholar]
- Dasari S, Gulledge AT. M1 and M4 receptors modulate hippocampal pyramidal neurons. J Neurophysiol. 2011;105:779–792. doi: 10.1152/jn.00686.2010. [DOI] [PMC free article] [PubMed] [Google Scholar]
- Deiana S, Platt B, Riedel G. The cholinergic system and spatial learning. Behav Brain Res. 2011;221:389–411. doi: 10.1016/j.bbr.2010.11.036. [DOI] [PubMed] [Google Scholar]
- Duncan K, Sadanand A, Davachi L. Memory's penumbra: episodic memory decisions induce lingering mnemonic biases. Science. 2012;337:485–487. doi: 10.1126/science.1221936. [DOI] [PMC free article] [PubMed] [Google Scholar]
- Easton A, Douchamps V, Eacott M, Lever C. A specific role for septohippocampal acetylcholine in memory? Neuropsychologia. 2012;50:3156–3168. doi: 10.1016/j.neuropsychologia.2012.07.022. [DOI] [PMC free article] [PubMed] [Google Scholar]
- Eichenbaum H, Cohen N. From conditioning to conscious recollection. New York: Oxford UP; 2001. [Google Scholar]
- Fisher NI. Statistical analysis of circular data. New York: Cambridge UP; 1993. [Google Scholar]
- Flicker C, Geyer MA. Behavior during hippocampal microinfusions. IV. Transmitter interactions. Brain Res. 1982;257:137–147. doi: 10.1016/0165-0173(82)90009-1. [DOI] [PubMed] [Google Scholar]
- Freund TF, Katona I. Perisomatic inhibition. Neuron. 2007;56:33–42. doi: 10.1016/j.neuron.2007.09.012. [DOI] [PubMed] [Google Scholar]
- Fyhn M, Hafting T, Treves A, Moser MB, Moser EI. Hippocampal remapping and grid realignment in entorhinal cortex. Nature. 2007;446:190–194. doi: 10.1038/nature05601. [DOI] [PubMed] [Google Scholar]
- Geisler C, Robbe D, Zugaro M, Sirota A, Buzsáki G. Hippocampal place cell assemblies are speed-controlled oscillators. Proc Natl Acad Sci U S A. 2007;104:8149–8154. doi: 10.1073/pnas.0610121104. [DOI] [PMC free article] [PubMed] [Google Scholar]
- Giovannini MG, Rakovska A, Benton RS, Pazzagli M, Bianchi L, Pepeu G. Effects of novelty and habituation on acetylcholine, GABA, and glutamate release from the frontal cortex and hippocampus of freely moving rats. Neuroscience. 2001;106:43–53. doi: 10.1016/S0306-4522(01)00266-4. [DOI] [PubMed] [Google Scholar]
- Hájos N, Papp EC, Acsády L, Levey AI, Freund TF. Distinct interneuron types express m2 muscarinic receptor immunoreactivity on their dendrites or axon terminals in the hippocampus. Neuroscience. 1998;82:355–376. doi: 10.1016/s0306-4522(97)00300-x. [DOI] [PubMed] [Google Scholar]
- Harris KD, Henze DA, Hirase H, Leinekugel X, Dragoi G, Czurk ó A, Buzsáki G. Spike train dynamics predicts theta-related phase precession in hippocampal pyramidal cells. Nature. 2002;417:738–741. doi: 10.1038/nature00808. [DOI] [PubMed] [Google Scholar]
- Hasselmo ME. How we remember: brain mechanisms of episodic memory. Cambridge, MA: MIT; 2012. [DOI] [Google Scholar]
- Hasselmo ME, Schnell E. Laminar selectivity of the cholinergic suppression of synaptic transmission in rat hippocampal region CA1: computational modeling and brain slice physiology. J Neurosci. 1994;14:3898–3914. doi: 10.1523/JNEUROSCI.14-06-03898.1994. [DOI] [PMC free article] [PubMed] [Google Scholar]
- Hasselmo ME, Wyble BP, Wallenstein GV. Encoding and retrieval of episodic memories: role of cholinergic and GABAergic modulation in the hippocampus. Hippocampus. 1996;6:693–708. doi: 10.1002/(SICI)1098-1063(1996)6:6<693::AID-HIPO12>3.0.CO;2-W. [DOI] [PubMed] [Google Scholar]
- Hasselmo ME, Bodelón C, Wyble BP. A proposed function for hippocampal theta rhythm: separate phases of encoding and retrieval enhance reversal of prior learning. Neural computation. 2002;14:793–817. doi: 10.1162/089976602317318965. [DOI] [PubMed] [Google Scholar]
- Hirase H, Czurkó A, Csicsvari J, Buzsáki G. Firing rate and theta-phase coding by hippocampal pyramidal neurons during ‘space clamping’. Eur J Neurosci. 1999;11:4373–4380. doi: 10.1046/j.1460-9568.1999.00853.x. [DOI] [PubMed] [Google Scholar]
- Huerta PT, Lisman JE. Bidirectional synaptic plasticity induced by a single burst during cholinergic theta oscillation in CA1 in vitro. Neuron. 1995;15:1053–1063. doi: 10.1016/0896-6273(95)90094-2. [DOI] [PubMed] [Google Scholar]
- Huxter J, Burgess N, O'Keefe J. Independent rate and temporal coding in hippocampal pyramidal cells. Nature. 2003;425:828–832. doi: 10.1038/nature02058. [DOI] [PMC free article] [PubMed] [Google Scholar]
- Huxter JR, Senior TJ, Allen K, Csicsvari J. Theta phase-specific codes for two-dimensional position, trajectory and heading in the hippocampus. Nat Neurosci. 2008;11:587–594. doi: 10.1038/nn.2106. [DOI] [PubMed] [Google Scholar]
- Hyman JM, Wyble BP, Goyal V, Rossi CA, Hasselmo ME. Stimulation in hippocampal region CA1 in behaving rats yields long-term potentiation when delivered to the peak of theta and long-term depression when delivered to the trough. J Neurosci. 2003;23:11725–11731. doi: 10.1523/JNEUROSCI.23-37-11725.2003. [DOI] [PMC free article] [PubMed] [Google Scholar]
- Ikonen S, McMahan R, Gallagher M, Eichenbaum H, Tanila H. Cholinergic system regulation of spatial representation by the hippocampus. Hippocampus. 2002;12:386–397. doi: 10.1002/hipo.1109. [DOI] [PubMed] [Google Scholar]
- Jeewajee A, Lever C, Burton S, O'Keefe J, Burgess N. Environmental novelty is signaled by reduction of the hippocampal theta frequency. Hippocampus. 2008;18:340–348. doi: 10.1002/hipo.20394. [DOI] [PMC free article] [PubMed] [Google Scholar]
- Jezek K, Henriksen EJ, Treves A, Moser EI, Moser MB. Theta-paced flickering between place-cell maps in the hippocampus. Nature. 2011;478:246–249. doi: 10.1038/nature10439. [DOI] [PubMed] [Google Scholar]
- Jones MW, Wilson MA. Theta rhythms coordinate hippocampal-prefrontal interactions in a spatial memory task. PLoS Biol. 2005:3. doi: 10.1371/journal.pbio.0030402. [DOI] [PMC free article] [PubMed] [Google Scholar]
- Kentros C, Hargreaves E, Hawkins RD, Kandel ER, Shapiro M, Muller RV. Abolition of long-term stability of new hippocampal place cell maps by NMDA receptor blockade. Science. 1998;280:2121–2126. doi: 10.1126/science.280.5372.2121. [DOI] [PubMed] [Google Scholar]
- Kjelstrup KB, Solstad T, Brun VH, Hafting T, Leutgeb S, Witter MP, Moser EI, Moser MB. Finite scale of spatial representation in the hippocampus. Science. 2008;321:140–143. doi: 10.1126/science.1157086. [DOI] [PubMed] [Google Scholar]
- Klausberger T, Somogyi P. Neuronal diversity and temporal dynamics: the unity of hippocampal circuit operations. Science. 2008;321:53–57. doi: 10.1126/science.1149381. [DOI] [PMC free article] [PubMed] [Google Scholar]
- Klinkenberg I, Blokland A. The validity of scopolamine as a pharmacological model for cognitive impairment: a review of animal behavioral studies. Neurosci Biobehav Rev. 2010;34:1307–1350. doi: 10.1016/j.neubiorev.2010.04.001. [DOI] [PubMed] [Google Scholar]
- Kunec S, Hasselmo ME, Kopell N. Encoding and retrieval in the CA3 region of the hippocampus: a model of theta-phase separation. J Neurophysiol. 2005;94:70–82. doi: 10.1152/jn.00731.2004. [DOI] [PubMed] [Google Scholar]
- Kwag J, McLelland D, Paulsen O. Phase of firing as a local window for efficient neuronal computation: tonic and phasic mechanisms in the control of theta spike phase. Front Hum Neurosci. 2011;5:3. doi: 10.3389/fnhum.2011.00003. [DOI] [PMC free article] [PubMed] [Google Scholar]
- Leung LS. Pharmacology of theta phase shift in the hippocampal CA1 region of freely moving rats. Electroencephalogr Clin Neurophysiol. 1984;58:457–466. doi: 10.1016/0013-4694(84)90142-1. [DOI] [PubMed] [Google Scholar]
- Leutgeb S, Leutgeb JK, Treves A, Moser MB, Moser EI. Distinct ensemble codes in hippocampal areas CA3 and CA1. Science. 2004;305:1295–1298. doi: 10.1126/science.1100265. [DOI] [PubMed] [Google Scholar]
- Lever C, Wills T, Cacucci F, Burgess N, O'Keefe J. Long-term plasticity in hippocampal place-cell representation of environmental geometry. Nature. 2002;416:90–94. doi: 10.1038/416090a. [DOI] [PubMed] [Google Scholar]
- Lever C, Burton S, O'Keefe J. Rearing on hind legs, environmental novelty, and the hippocampal formation. Rev Neurosci. 2006;17:111–133. doi: 10.1515/revneuro.2006.17.1-2.111. [DOI] [PubMed] [Google Scholar]
- Lever C, Burton S, Jeewajee A, O'Keefe J, Burgess N. Boundary vector cells in the subiculum of the hippocampal formation. J Neurosci. 2009;29:9771–9777. doi: 10.1523/JNEUROSCI.1319-09.2009. [DOI] [PMC free article] [PubMed] [Google Scholar]
- Lever C, Burton S, Jeewajee A, Wills TJ, Cacucci F, Burgess N, O'Keefe J. Environmental novelty elicits a later theta phase of firing in CA1 but not subiculum. Hippocampus. 2010;20:229–234. doi: 10.1002/hipo.20671. [DOI] [PMC free article] [PubMed] [Google Scholar]
- Lisman JE, Grace AA. The hippocampal-VTA loop: controlling the entry of information into long-term memory. Neuron. 2005;46:703–713. doi: 10.1016/j.neuron.2005.05.002. [DOI] [PubMed] [Google Scholar]
- Manns JR, Zilli EA, Ong KC, Hasselmo ME, Eichenbaum H. Hippocampal CA1 spiking during encoding and retrieval: relation to theta phase. Neurobiol Learn Mem. 2007;87:9–20. doi: 10.1016/j.nlm.2006.05.007. [DOI] [PubMed] [Google Scholar]
- McHugh TJ, Jones MW, Quinn JJ, Balthasar N, Coppari R, Elmquist JK, Lowell BB, Fanselow MS, Wilson MA, Tonegawa S. Dentate gyrus NMDA receptors mediate rapid pattern separation in the hippocampal network. Science. 2007;317:94–99. doi: 10.1126/science.1140263. [DOI] [PubMed] [Google Scholar]
- McNaughton BL, Morris RGM. Hippocampal synaptic enhancement and information-storage within a distributed memory system. Trends Neurosci. 1987;10:408–415. doi: 10.1016/0166-2236(87)90011-7. [DOI] [Google Scholar]
- Meeter M, Murre JM, Talamini LM. Mode shifting between storage and recall based on novelty detection in oscillating hippocampal circuits. Hippocampus. 2004;14:722–741. doi: 10.1002/hipo.10214. [DOI] [PubMed] [Google Scholar]
- Mehta MR, Lee AK, Wilson MA. Role of experience and oscillations in transforming a rate code into a temporal code. Nature. 2002;417:741–746. doi: 10.1038/nature00807. [DOI] [PubMed] [Google Scholar]
- Mizuseki K, Sirota A, Pastalkova E, Buzsáki G. Theta oscillations provide temporal windows for local circuit computation in the entorhinal-hippocampal loop. Neuron. 2009;64:267–280. doi: 10.1016/j.neuron.2009.08.037. [DOI] [PMC free article] [PubMed] [Google Scholar]
- Mizuseki K, Diba K, Pastalkova E, Buzsáki G. Hippocampal CA1 pyramidal cells form functionally distinct sublayers. Nat Neurosci. 2011;14:1174–1181. doi: 10.1038/nn.2894. [DOI] [PMC free article] [PubMed] [Google Scholar]
- Montgomery SM, Betancur MI, Buzsáki G. Behavior-dependent coordination of multiple theta dipoles in the hippocampus. J Neurosci. 2009;29:1381–1394. doi: 10.1523/JNEUROSCI.4339-08.2009. [DOI] [PMC free article] [PubMed] [Google Scholar]
- Moore BR. A modification of the Rayleigh test for vector data. Biometrika. 1980;67:175–180. doi: 10.1093/biomet/67.1.175. [DOI] [Google Scholar]
- Muller RU, Kubie JL. The effects of changes in the environment on the spatial firing of hippocampal complex-spike cells. J Neurosci. 1987;7:1951–1968. doi: 10.1523/JNEUROSCI.07-07-01951.1987. [DOI] [PMC free article] [PubMed] [Google Scholar]
- Nakashiba T, Cushman JD, Pelkey KA, Renaudineau S, Buhl DL, McHugh TJ, Rodriguez Barrera V, Chittajallu R, Iwamoto KS, McBain CJ, Fanselow MS, Tonegawa S. Young dentate granule cells mediate pattern separation, whereas old granule cells facilitate pattern completion. Cell. 2012;149:188–201. doi: 10.1016/j.cell.2012.01.046. [DOI] [PMC free article] [PubMed] [Google Scholar]
- O'Keefe J, Nadel L. The hippocampus as a cognitive map. Oxford, UK: Oxford UP; 1978. [Google Scholar]
- Patil MM, Hasselmo ME. Modulation of inhibitory synaptic potentials in the piriform cortex. J Neurophysiol. 1999;81:2103–2118. doi: 10.1152/jn.1999.81.5.2103. [DOI] [PubMed] [Google Scholar]
- Pitler TA, Alger BE. Cholinergic excitation of gabaergic interneurons in the rat hippocampal slice. J Physiol. 1992;450:127–142. doi: 10.1113/jphysiol.1992.sp019119. [DOI] [PMC free article] [PubMed] [Google Scholar]
- Poe GR, Nitz DA, McNaughton BL, Barnes CA. Experience-dependent phase-reversal of hippocampal neuron firing during REM sleep. Brain Res. 2000;855:176–180. doi: 10.1016/S0006-8993(99)02310-0. [DOI] [PubMed] [Google Scholar]
- Rogers JL, Kesner RP. Cholinergic modulation of the hippocampus during encoding and retrieval. Neurobiol Learn Mem. 2003;80:332–342. doi: 10.1016/S1074-7427(03)00063-7. [DOI] [PubMed] [Google Scholar]
- Royer S, Zemelman BV, Losonczy A, Kim J, Chance F, Magee JC, Buzsáki G. Control of timing, rate and bursts of hippocampal place cells by dendritic and somatic inhibition. Nat Neurosci. 2012;15:769–775. doi: 10.1038/nn.3077. [DOI] [PMC free article] [PubMed] [Google Scholar]
- Sava S, Markus EJ. Activation of the medial septum reverses age-related hippocampal encoding deficits: a place field analysis. J Neurosci. 2008;28:1841–1853. doi: 10.1523/JNEUROSCI.4629-07.2008. [DOI] [PMC free article] [PubMed] [Google Scholar]
- Scheffer-Teixeira R, Belchior H, Caixeta FV, Souza BC, Ribeiro S, Tort AB. Theta phase modulates multiple layer-specific oscillations in the CA1 region. Cereb Cortex. 2012;22:2404–2414. doi: 10.1093/cercor/bhr319. [DOI] [PubMed] [Google Scholar]
- Skaggs WE, McNaughton B, Gothard KM, Markus EJ. An information-theoretic approach to deciphering the hippocampal code. Adv Neural Inf Process Syst. 1993;5:1030–1037. [Google Scholar]
- Squire LR. Memory and the hippocampus: a synthesis from findings with rats, monkeys, and humans. Psychol Rev. 1992;99:195–231. doi: 10.1037/0033-295X.99.2.195. [DOI] [PubMed] [Google Scholar]
- Thiel CM, Huston JP, Schwarting RK. Hippocampal acetylcholine and habituation learning. Neuroscience. 1998;85:1253–1262. doi: 10.1016/S0306-4522(98)00030-X. [DOI] [PubMed] [Google Scholar]
- Tort AB, Komorowski RW, Manns JR, Kopell NJ, Eichenbaum H. Theta-gamma coupling increases during the learning of item-context associations. Proc Natl Acad Sci U S A. 2009;106:20942–20947. doi: 10.1073/pnas.0911331106. [DOI] [PMC free article] [PubMed] [Google Scholar]
- Treves A, Rolls ET. Computational analysis of the role of the hippocampus in memory. Hippocampus. 1994;4:374–391. doi: 10.1002/hipo.450040319. [DOI] [PubMed] [Google Scholar]
- Villarreal DM, Gross AL, Derrick BE. Modulation of CA3 afferent inputs by novelty and theta rhythm. J Neurosci. 2007;27:13457–13467. doi: 10.1523/JNEUROSCI.3702-07.2007. [DOI] [PMC free article] [PubMed] [Google Scholar]
- Vinogradova OS. Hippocampus as comparator: role of the two input and two output systems of the hippocampus in selection and registration of information. Hippocampus. 2001;11:578–598. doi: 10.1002/hipo.1073. [DOI] [PubMed] [Google Scholar]
- Wills TJ, Lever C, Cacucci F, Burgess N, O'Keefe J. Attractor dynamics in the hippocampal representation of the local environment. Science. 2005;308:873–876. doi: 10.1126/science.1108905. [DOI] [PMC free article] [PubMed] [Google Scholar]
- Wirtshafter D. Cholinergic involvement in the cortical and hippocampal Fos expression induced in the rat by placement in a novel environment. Brain Res. 2005;1051:57–65. doi: 10.1016/j.brainres.2005.05.052. [DOI] [PubMed] [Google Scholar]
- Yu AJ, Dayan P. Uncertainty, neuromodulation, and attention. Neuron. 2005;46:681–692. doi: 10.1016/j.neuron.2005.04.026. [DOI] [PubMed] [Google Scholar]
- Zar JH. Biostatistical analysis. Ed 4. Upper Saddle River, NJ: Prentice Hall; 1999. [Google Scholar]