Abstract
A reproducibility study of proton magnetic resonance spectroscopic imaging (1H-MRSI) of the human brain was conducted to evaluate the reliability of an automated 3D in vivo spectroscopic imaging acquisition and associated quantification algorithm. A PRESS-based pulse sequence was implemented using dualband spectral-spatial RF pulses designed to fully excite the singlet resonances of choline (Cho), creatine (Cre) and N-acetyl aspartate (NAA) while simultaneously suppressing water and lipids. 1% of the water signal was left to be used as a reference signal for robust data processing, and additional lipid suppression was obtained using adiabatic inversion recovery. Spiral k-space trajectories were used for fast spectral and spatial encoding yielding high-quality spectra from 1 cc voxels throughout the brain with a 13 minute acquisition time. Data were acquired with an 8-channel phased-array coil and optimal SNR for the combined signals was achieved using a weighting based on the residual water signal. Automated quantification of the spectrum of each voxel was performed using LCModel. The complete study consisted of 8 healthy adult subjects to assess inter-subject variations and two subjects scanned six times each to assess intra-subject variations. The results demonstrate that reproducible whole-brain 1H-MRSI data can be robustly obtained with the proposed methods.
Keywords: magnetic resonance spectroscopic imaging, metabolite maps, region of interest, reproducibility
Introduction
Brain 1H-MRSI has become an important clinical tool in diagnosis, treatment planning, and recovery assessment. Although widely used, most brain MRSI sequences suffer from drawbacks including limited spatial coverage, insufficient water and lipid suppression, long scan times, low SNR and lack of robust and automated spectral quantification.
In 1H-MRSI, water suppression is most commonly achieved with CHEmical Shift Selective (CHESS) (1) pulses in which magnetization from water protons is repeatedly rotated into the transverse plane and spoiled using associated dephasing gradients. This method, though effective, provides limited control of the suppression factor across the field-of-view (FOV), preventing the use of the residual water to serve as reference signals for phasing and quantification.
The most widely used techniques to suppress subcutaneous lipids are Position RESolved Spectroscopy (PRESS) (2) and STimulated Echo Acquisition Mode (STEAM) (3) localization methods, both of which excite a rectangular volume wholly inscribed within the skull. Although highly effective and robust, the assessment of cortical gray matter near the skull is typically compromised. To achieve whole-brain coverage, both lipid signal extrapolation (4) and Short Tau Inversion Recovery (STIR) (5) techniques have been used albeit at the expense of high sensitivity to noise for the k-space extrapolation techniques and metabolite signal losses due to non-selective inversion recovery at 1.5T when using STIR.
The use of conventional phase-encoding for spatial localization typically results in long MRSI scan times, particularly for 3D studies. To effectively encode spatial and spectral information, fast encoding schemes using time-varying readout gradients have been proposed and implemented including echo-planar methods (6, 7), having straightforward gradient waveform designs, and spiral based k-space trajectories, gaining in popularity due to the efficient use of the gradient systems (8).
A challenge for all clinical spectroscopy applications is the low SNR from small metabolite concentrations and limited scan time. One way to improve SNR is to use multiple coils for data acquisition, and phased-array head coils are now widely available with significant SNR improvements reported (9).
In this paper, we assessed the reliability and reproducibility of a fast 3D whole-brain 1.5T MRSI sequence with efficient and robust water and lipid suppression, spiral k-space readout trajectories, and an 8-channel phased-array coil targeting the three major brain metabolites (NAA, Cr, Cho). A computer program was implemented to automatically phase the spectrum from each voxel and coil before combining the signals for optimal SNR. LCModel software (10, 11) was then used to analyze the combined spectra from each voxel in order to generate metabolite intensity and ratio maps.
Methods
MRSI Acquisition and Data Processing
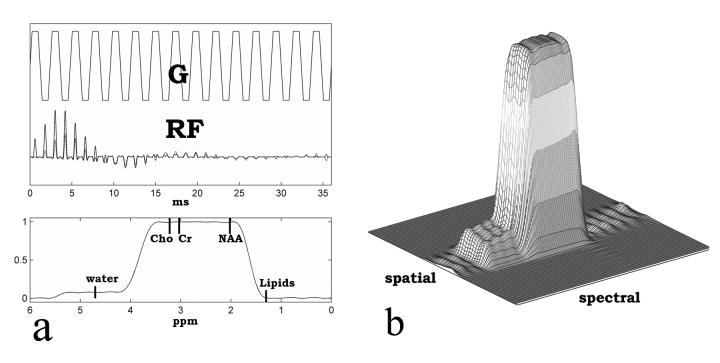
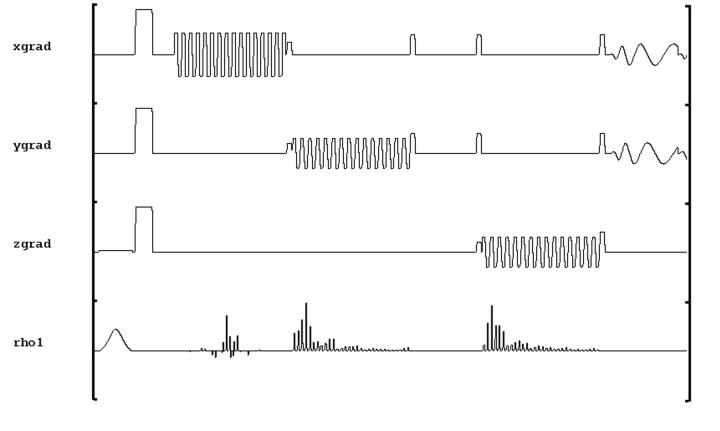
The schematic of the MRSI sequence is shown in Figure 1. A spectral-spatial 90 degree RF pulse and two identical dualband spectral-spatial 180 degree RF pulses were incorporated into a PRESS sequence. This excitation scheme was proposed by Schricker et al. (12), for prostate MRSI. For human brain applications, the spectral-spatial 90 degree pulse was designed to fully excite water, Cho, Cr and NAA. The dualband 180 degree pulse was designed to fully excite a frequency band that spans from Cho (3.2ppm) to NAA (2.02ppm) and partially excite water while suppress lipids below 1.4ppm. To have sharp transition bands, we chose to use a minimum phase RF pulse design. The two identical dualband spectral-spatial 180 degree RF pulses compensate the inherent nonlinear phase induced each other (13), resulting in a spin echo. The RF pulse was synthesized using the Shinnar-le Roux algorithm (14). The spectral profile and the mesh plot of the spectral-spatial profile of the dualband spectral-spatial 180 degree RF pulse are shown in Figure 2. Water resonance was centered at the 10% partial pass band to have attenuated water signal. With two identical dualband 180 degree pulses, 1% of water signal was refocused at the echo time.
Figure 1.
The schematic of the volumetric spiral 1H-MRSI pulse sequence. The sequence starts with an adiabatic inversion pulse. A spectral-spatial 90 degree RF pulse and 2 identical dualband spectral-spatial 180 degree RF pulses constitute PRESS-based localization. Spiral k-space trajectories are used for encoding in x, y and f dimensions. Resolution in z is obtained using conventional phase encoding.
Figure 2.
(a) Dualband spectral-spatial RF spin echo pulse with the associated gradient waveforms and its spectral profile (b) Mesh plot of the spectral-spatial profile.
Lipid resonance was further suppressed using inversion recovery with an adiabatic non-spectral selective inversion pulse and 170ms of recovery time. Given the lipid suppression provided by the use of inversion recovery and spectral-spatial RF pulses, the PRESS box was prescribed to encompass the whole brain on the axial images and thus only used to suppress unwanted signals from tissue inferior to the brain.
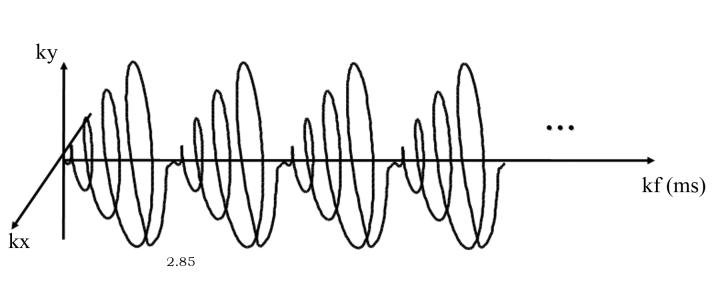
In-plane spatial information (kx, ky) was encoded using spiral k-space trajectories (8). Chemical shift information (kf) was encoded by repeated sampling with the same spiral trajectories. Spiral gradients were generated in real time during prescription according to FOV, spatial resolution, spectral bandwidth, and the number of interleaves (15). Encoding in z direction (kz) was performed using standard phase encoding. Figure 3 shows the readout scheme in kx, ky and kf.
Figure 3.
Spiral k-space trajectories in kx, kyand kf.
Data reconstruction and spectral quantification were fully automated. The signal from each of the 8 phased-array coils was reconstructed independently. The in-plane k-space data were gridded on a Cartesian grid to perform inverse FFT before apodizing with a 4 Hz Gaussian filter. Both zero and first-order phasing were then applied to every voxel spectrum using the residual water peak as a reference. For first order phasing, the locations of water and NAA were first found on the magnitude spectrum. Using the residual water peak as a pivot, linear phases at incremental steps were applied to the complex spectra. The final first order phase was set to the one that maximized the NAA peak in the absorption channel. Phased spectra for each voxel and coil were then combined, weighted by the water signal, to achieve maximum SNR (9).
The combined spectrum of each voxel was passed to LCModel for quantification. Concentrations of Cho, Cr and NAA and concentration ratios of Cho to Cr and NAA to Cr were generated for each voxel. Cramer-Rao lower bounds for the LCModel fits (expressed as %SD) were used as an indication of the quality of the spectrum, and both the water peak value and %SD of the LCModel estimates were used as criteria to identify and exclude voxels outside brain tissue as well as voxels with low quality spectra. In particular, metabolite signal intensity and ratio maps were generated from all voxels with estimated metabolite %SDs less than 20% and water peak values larger than a threshold._The threshold of water peak value was chosen to differentiate voxels on brain tissue from voxels on skull or subcutaneous fat. The complete reconstruction and spectral quantification for each volumetric MRSI data set required 30 minutes using a 1.5G Hz Pentium PC.
Reproducibility study
Eight healthy subjects, 6 male, 2 female, with ages ranging from 27 to 31 years old, were recruited for a reproducibility study. The subjects were from 27 to 31 years old, with a mean of 28.7 years old and standard deviation of 1.5 years. All 8 subjects were each scanned once within a 1 month interval to determine inter-subject variability while one 27-year-old female and one 31-year-old male subject were scanned 6 times within a 2-week period for the assessment of intra-subject variability. Consent forms, approved by the local Institutional Review Board, were obtained from all subjects before the experiments.
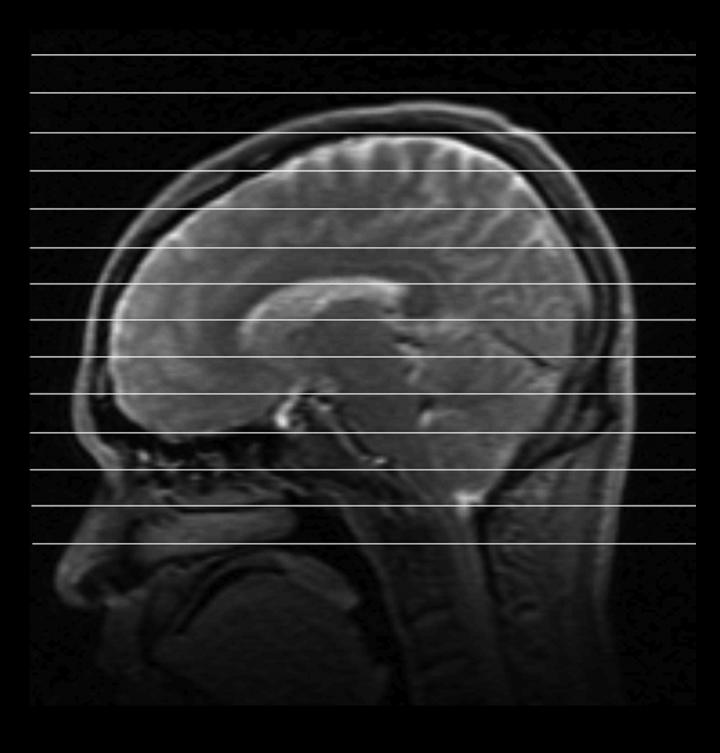
All data were collected at 1.5T using a General Electric (G.E. Medical Systems, Milwaukee, WI) scanner with 8-channel phased-array coil. Before acquisition, high-order shimming (16) was performed over a region covering all brain tissue superior to basal ganglia and thalamus. The PRESS box was prescribed to encompass the entire brain with the following MRSI acquisition parameters: TI/TE/TR=170/144/1500ms, 32cm FOV, 32x32 matrix size, 1 cc voxel, 8 NEX and 13 minute acquisition. Spiral k-space trajectories with 4 interleaves were used for spatial and spectral encoding, resulting in a spectral bandwidth of 350 Hz. A total number of 16 1cm-thick slices were resolved in S/I direction by phase encoding with the center slice through the ventricles as shown in Figure 4.
Figure 4.
Slice locations for the whole-brain 1H-MRSI study. 16 slices are resolved in S/I direction, of which 5 slices through and above basal ganglia and thalamus are processed for the reproducibility study.
A dual echo FSE sequence with echo time of 35ms and 80ms was performed on the subject after the MRSI scan to generate high-resolution structural images for the accurate identification of regions of interest. Careful attention was paid to make sure that the slice locations were the same as prescribed for the MRSI scan.
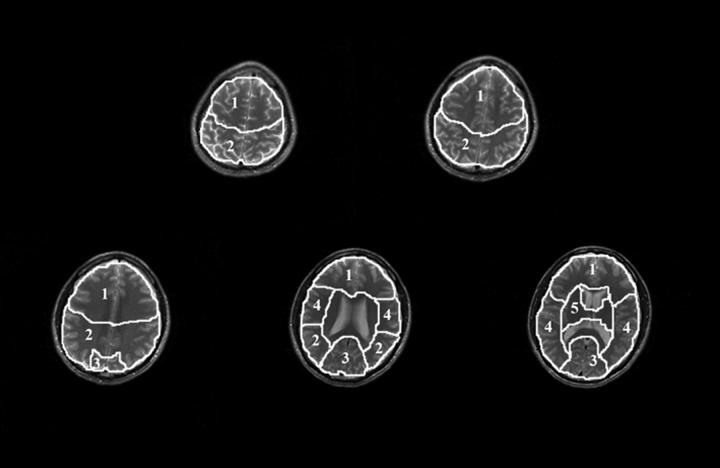
To study inter-regional variability, 5 regions of interest (ROIs), covering the frontal lobe, parietal lobe, occipital lobe, temporal lobe and basal ganglia and thalamus, were drawn on the high-resolution structural images to generate masks for each ROI. Representative ROIs are shown in Figure 5. Final metabolite values were obtained by averaging signals from all voxels within each ROI.
Figure 5.
Diagram of anatomically defined ROIs drawn on corresponding axial FSE images from one representative scan. ROIs are as follows: 1. frontal lobe, 2. parietal lobe, 3. occipital lobe, 4. temporal lobe, 5. basal ganglia and thalamus. Regional metabolite signal intensities and ratios were obtained by averaging voxels within each ROI.
Results
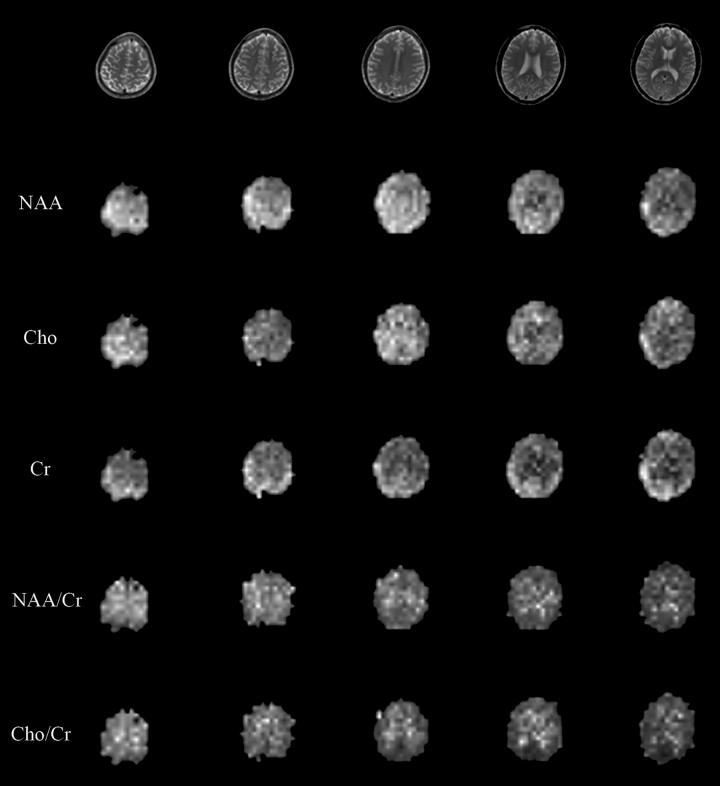
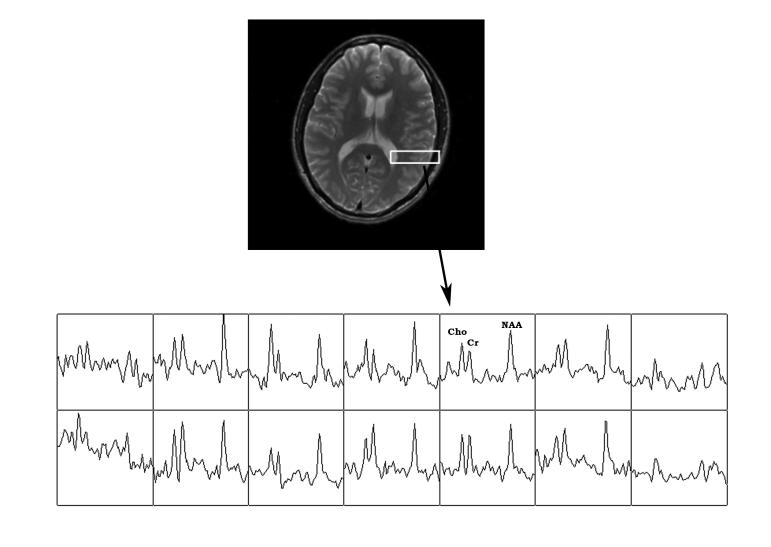
With high-order shimming, spectra with SNR of 25 or higher for NAA were obtained from slices through and superior to the basal ganglia and thalamus. A typical slice of the high-resolution FSE data set and corresponding metabolite spectra from representative voxels are shown in Figure 6. Spectra from all voxels were analyzed using LCModel. Voxels with Cramer-Rao lower bounds associated with Cho, Cr and NAA larger than 20% were excluded together with voxels having water peaks lower than a threshold. The total number of voxels in all 5 ROIs was on the order of 500 and the typical number of voxels excluded was on the order of 10 and most of them were close to the skull with spectra contaminated by residual lipids. Metabolite maps of Cho, Cr and NAA and metabolite concentration ratio maps of NAA to Cr and Cho to Cr were obtained using the LCModel results. Figure 7 shows the metabolite maps and metabolite concentration ratio maps with associated high resolution structural images from one representative scan.
Figure 6.
Representative metabolite spectra from selected voxels including the grey matter cortical ribbon.
Figure 7.
Metabolite maps and metabolite concentration ratio maps with associated FSE images. Spectra from each of the 8 phased-array coils are first phased and then combined for optimal SNR. Metabolite maps and metabolite concentration ratio maps are constructed using LCModel estimation of the combined spectra. Voxels with the Cramer-Rao lower bound of estimation larger than 20% are excluded.
Coefficients of variations were calculated for metabolite concentration ratios as the SNR-optimized combined signals from 8-channel phased-array coils result in shading of the metabolite intensity images due to B1 inhomogeneity and coil sensitivity profiles. The shading of the metabolite intensity images can be removed with B1 maps and coil sensitivity profiles. Since majority of clinical applications use metabolite concentration ratios for diagnosis, in this study, the reproducibility of the sequence was evaluated with coefficients of variations of metabolite concentration ratios to save scan time.
The inter-subject regional reproducibility results are given in Table 1 with mean and coefficients of variation (CVs) of metabolite concentration ratios obtained from 8 subjects. The inter-subject CVs of the five ROIs ranged from 6.1% to 11% for NAA/Cr and 7.2% to 12.1% for Cho/Cr. Assuming normal distribution of coefficient of variation, the 95% confidence interval for the coefficient of variation from 5 ROIs was also calculated. The upper confidence bounds on the coefficient of variation for NAA/Cr ratio from 5 ROIs range from 12.5% to 22.6% and the upper confidence bounds on the coefficient of variation of Cho/Cr ratio for 5 ROIs range from 14.4% to 24.9%.
Table 1.
Inter-subject regional mean metabolite concentration ratios and their associated CVs. Data obtained from 8 subjects, 6 male, 2 female, ages from 25 to 32. Each subject was scanned once.
| Region of interest | NAA/Cr | Cho/Cr | ||
|---|---|---|---|---|
| Mean | CV | Mean | CV | |
| Frontal lobe | 1.80 | 6.1 | 0.27 | 7.2 |
| Parietal lobe | 1.89 | 6.8 | 0.29 | 12.1 |
| Occipital lobe | 1.90 | 8.9 | 0.30 | 10.2 |
| Temporal lobe | 1.68 | 11.0 | 0.31 | 8.8 |
| Basal ganglia and thalamus | 1.68 | 6.6 | 0.30 | 8.8 |
The intra-subject regional reproducibility results are shown in Table 2 and Table 3 using data obtained from 6 scans of each of the 2 subjects. For the 27 year old female subject, the intra-subject CVs of five ROIs ranged from 4.7% to 12.7% for NAA/Cr and 2.7% to 7.1% for Cho/Cr with the upper 95% confidence interval bounds on the coefficient of variation of NAA/Cr ratio from 5 ROIs from 11.5% to 31% and the upper 95% confidence interval bounds on the coefficient of variation for Cho/Cr ratio from 5 ROIs from 6.6% to 17.5%.
Table 2.
Intra-subject regional mean metabolite concentration ratios and their associated CVs. Data obtained from 6 scans of one 27 year old female subject within a 2 week period.
| Region of interest | NAA/Cr | Cho/Cr | ||
|---|---|---|---|---|
| Mean | CV | Mean | CV | |
| Frontal lobe | 1.68 | 8.9 | 0.23 | 2.7 |
| Parietal lobe | 1.88 | 4.7 | 0.24 | 3.0 |
| Occipital lobe | 1.88 | 5.6 | 0.28 | 3.7 |
| Temporal lobe | 1.70 | 7.4 | 0.29 | 4.0 |
| Basal ganglia and thalamus | 1.67 | 12.7 | 0.26 | 7.1 |
Table 3.
Intra-subject regional mean metabolite concentration ratios and their associated CVs. Data obtained from 6 scans of one 31 year old male subject within a 2 week period.
| Region of interest | NAA/Cr | Cho/Cr | ||
|---|---|---|---|---|
| Mean | CV | Mean | CV | |
| Frontal lobe | 1.78 | 2.6 | 0.28 | 3.5 |
| Parietal lobe | 1.73 | 2.7 | 0.25 | 2.5 |
| Occipital lobe | 1.77 | 2.3 | 0.22 | 3.5 |
| Temporal lobe | 1.77 | 5.5 | 0.27 | 2.0 |
| Basal ganglia and thalamus | 1.63 | 5.1 | 0.29 | 6.6 |
For the 31 year old male subject, the intra-subject CVs of five ROIs ranged from 2.3% to 5.5% for NAA/Cr and 2.0% to 6.6% for Cho/Cr with the upper 95% confidence interval bounds on the coefficient of variation of NAA/Cr ratio from 5 ROIs from 6.4% to 13.5% and the upper 95% confidence interval bounds on the coefficient of variation for Cho/Cr ratio from 5 ROIs from 4.9% to 16.3%.
Discussion
1H-MRSI has become an important research and clinical tool capable of obtaining spatial and chemical-shift information simultaneously. However, its clinical use has been limited by restricted spatial coverage, low SNR, and long acquisition times. With fast imaging methods using spiral k-space trajectories and water and lipid suppression using inversion recovery and dualband spectral-spatial RF pulses, the sequence used in this study achieved volumetric brain coverage with 1cc voxel size and 13 minutes of scan time. In addition, with effective lipid suppression using both inversion recovery and dualband spectral-spatial RF pulses and a PRESS box encompassing the whole brain, spectra of Cho, Cr and NAA from subcortical grey matter close the skull were obtained at the cost of suppression of lactate. Hence, greater spatial coverage is achieved with our approach in exchange for the inability to simultaneously image lactate. The residue water peak provided valuable information for phasing the spectra and was used to differentiate brain tissue from subcutaneous lipids and skull. Setting a threshold using water peaks in combination with the Cramer-Rao lower estimation bounds associated with each metabolite from LCModel estimation, voxels with low SNR or outside the brain were effectively excluded.
The sensitivity and reliability of the implemented whole-brain MRSI acquisition and associated data processing algorithms have been systematically evaluated from the reproducibility study. Reproducibility of both single- and multi-voxel brain spectroscopy has been studied by numerous researchers, most commonly using either STEAM- or PRESS-based localizations. With respect to single-voxel studies, Narayana et al. (17) found inter-individual CVs of 21-29% while Marshall et al. (18) reported intra-individual CVs of 8-26%. Brooks et al. (19) using a short TE STEAM sequence and MRUI (Magnetic Resonance User Interface, Leuven, Belgium) for quantification, reported CVs of 3.3-8.1% for NAA, Cr, Cho and Myo-inositol. Using a PRESS sequence and LCModel for quantification, Schirmer et al. (20) reported intra-individual CVs ranging from 3.8 to 6.4% and inter-individual CVs ranging from 7.6 to 15% for absolute concentration of Cho, Cr and NAA.
All spectroscopic imaging reproducibility studies we discovered so far are based on PRESS or STEAM localizations with standard phase encoding and limited brain coverage to avoid lipid contamination. Among them, Li et al. (21) reported intra-subject median CVs for a total of 1876 voxels of 13.8%, 18.5% and 20.1% for NAA, Cr and Cho, respectively. Jackson et al. (22) investigated the reproducibility of metabolite concentration ratios and found overall CVs of 18% for NAA/Cr and 16% for Cho/Cr. In studies by Tedeschi et al. (23, 24), similar to our inter-regional variability study, variation of 8 brain ROIs were obtained with inter-subject CVs ranged from 4.2 to 8.7% for NAA/Cr and 5.0 to 13.6% for Cho/Cr; intra-subject CVs ranged from 8.2 to 22.2% for NAA/Cr and 4.5 to 21% for Cho/Cr.
Reproducibility of in vivo MRSI is determined by many factors including SNR, B0 and B1 inhomogeneity, gradient imperfections, subject motion, errors in subject positioning, and inaccuracies in drawing the selected ROIs. A direct comparison of the proposed sequence with conventional phase-encoded STEAM or PRESS acquisitions, which, with the same 32x32x16 matrix size and 1500ms repetition time would require 6.8 hours, is clearly not feasible. However, the coefficients of variation as measured by the proposed volumetric 1H-MRSI sequence and associated processing algorithm are comparable to or slightly better than literature reports for standard PRESS and STEAM sequence. Hence, for the case of brain 1H-MRSI of NAA, Cre, and Cho, the proposed volumetric method achieves similar sensitivity and reproducibility as more standard methods despite the greatly extended spatial coverage.
The sequence used in the current study was designed for 3D 1H-MRSI of major long T2 metabolites, Cho, Cre and NAA, with high spatial resolution, whole brain coverage, and reduced scan time. In order to achieve sufficient lipid suppression required for whole brain coverage, the excitation pulses in the sequence consist of a spectral-spatial 90 degree RF pulse and 2 identical dualband spectral-spatial 180 degree RF pulses. To maximize the lipid suppression without disturbing the closest metabolite NAA, a 36 ms pulse length was chosen for all 3 RF pulses for sharp transition. As a result, the sequence can not be used for shot-echo, e.g. 35ms, data acquisition.
There are multiple factors that distinguish the described spectroscopic imaging method from the cited studies. First, the spectroscopic imaging sequence achieves whole brain coverage with robust lipid suppression using both spectral-spatial RF pulses and inversion recovery. Using spiral readout gradients and 8-channel phased-array coil acquisition, 3D spectroscopic images with high SNR and high spatial resolution are obtained at clinically acceptable 13-minute scan time. Moreover, with 1% reference residual water signal, spectra are easily phased in the postprocessing. Finally, using both residual water signal and Cramer-Rao lower bound from LCModel analysis, voxels with low quality metabolite spectrum are automatically excluded.
One limitation of this study is that all data were acquired at one institution. A larger multi-center trial would be a logical next step.
Conclusion
This study assessed the repeatability of a 1.5T volumetric MRSI sequence using spectral-spatial RF pulses, spiral readout gradients, and automated data analysis tools. Inter- and intra-subject metabolite concentration ratio CVs from anatomically defined brain ROIs were found to be comparable to those reported for MRSI experiments. Such measures of reliability are critical to the experimental design and data interpretation necessary for any subsequent clinical and research studies.
Acknowledgments
The study is supported by grants NIH RR 09784, CA098523 and the Lucas foundation.
References
- 1.Haase A, Frahm J, Hanicke W, Matthaei D. 1H NMR chemical shift selective (CHESS) imaging. Phys Med Biol. 1985;30(4):341–344. doi: 10.1088/0031-9155/30/4/008. [DOI] [PubMed] [Google Scholar]
- 2.Bottomley PA. Spatial localization in NMR spectroscopy in vivo. Ann N Y Acad Sci. 1987;508:333–348. doi: 10.1111/j.1749-6632.1987.tb32915.x. [DOI] [PubMed] [Google Scholar]
- 3.Frahm J, Bruhn H, Gyngell ML, Merboldt KD, Hanicke W, Sauter R. Localized high-resolution proton NMR spectroscopy using stimulated echoes: initial applications to human brain in vivo. Magn Reson Med. 1989;9(1):79–93. doi: 10.1002/mrm.1910090110. [DOI] [PubMed] [Google Scholar]
- 4.Haupt CI, Schuff N, Weiner MW, Maudsley AA. Removal of lipid artifacts in 1H spectroscopic imaging by data extrapolation. Magn Reson Med. 1996;35(5):678–687. doi: 10.1002/mrm.1910350509. [DOI] [PMC free article] [PubMed] [Google Scholar]
- 5.Bydder GM, Young IR. MR imaging: clinical use of the inversion recovery sequence. J Comput Assist Tomogr. 1985;9(4):659–675. [PubMed] [Google Scholar]
- 6.Posse S, Tedeschi G, Risinger R, Ogg R, Le Bihan D. High speed 1H spectroscopic imaging in human brain by echo planar spatial-spectral encoding. Magn Reson Med. 1995;33(1):34–40. doi: 10.1002/mrm.1910330106. [DOI] [PubMed] [Google Scholar]
- 7.Macovski A. Volumetric NMR imaging with time-varying gradients. Magn Reson Med. 1985;2(1):29–40. doi: 10.1002/mrm.1910020105. [DOI] [PubMed] [Google Scholar]
- 8.Adalsteinsson E, Irarrazabal P, Topp S, Meyer C, Macovski A, Spielman DM. Volumetric spectroscopic imaging with spiral-based k-space trajectories. Magn Reson Med. 1998;39(6):889–898. doi: 10.1002/mrm.1910390606. [DOI] [PubMed] [Google Scholar]
- 9.Nimrod Maril REL. An Automated Algorithm for Combining Multivoxel MRS Data Acquired With Phased-Array Coils. Journal of Magnetic Resonance Imaging. 2005;21:317–322. doi: 10.1002/jmri.20261. [DOI] [PubMed] [Google Scholar]
- 10.Provencher SW. Automatic quantitation of localized in vivo 1H spectra with LCModel. NMR Biomed. 2001;14(4):260–264. doi: 10.1002/nbm.698. [DOI] [PubMed] [Google Scholar]
- 11.Provencher SW. Estimation of metabolite concentrations from localized in vivo proton NMR spectra. Magn Reson Med. 1993;30(6):672–679. doi: 10.1002/mrm.1910300604. [DOI] [PubMed] [Google Scholar]
- 12.Amir A, Schricker JMP, Kurhanewicz John, Swanson Mark G., Daniel B. Vigneron. Dualband Spectral-Spatial RF Pulses for Prostate MR Spectroscopic Imaging. Magnetic Resonance in Medicine. 2001;46:1079–1087. doi: 10.1002/mrm.1302. [DOI] [PubMed] [Google Scholar]
- 13.Star-Lack J, Vigneron DB, Pauly J, Kurhanewicz J, Nelson SJ. Improved solvent suppression and increased spatial excitation bandwidths for three-dimensional PRESS CSI using phase-compensating spectral/spatial spin-echo pulses. J Magn Reson Imaging. 1997;7(4):745–757. doi: 10.1002/jmri.1880070422. [DOI] [PubMed] [Google Scholar]
- 14.Pauly JLR,P, Nishimura D, Macovski A. Parameter relations for the Shinnar-Le Roux selective excitation pulse design algorithm. Medical Imaging, IEEE Transactions on. 1991;10(1):53–65. doi: 10.1109/42.75611. [DOI] [PubMed] [Google Scholar]
- 15.Glover GH. Simple analytic spiral K-space algorithm. Magn Reson Med. 1999;42(2):412–415. doi: 10.1002/(sici)1522-2594(199908)42:2<412::aid-mrm25>3.0.co;2-u. [DOI] [PubMed] [Google Scholar]
- 16.Kim DH, Adalsteinsson E, Glover GH, Spielman DM. Regularized higher-order in vivo shimming. Magn Reson Med. 2002;48(4):715–722. doi: 10.1002/mrm.10267. [DOI] [PubMed] [Google Scholar]
- 17.Narayana PA, Johnston D, Flamig DP. In vivo proton magnetic resonance spectroscopy studies of human brain. Magn Reson Imaging. 1991;9(3):303–308. doi: 10.1016/0730-725x(91)90415-i. [DOI] [PubMed] [Google Scholar]
- 18.Marshall I, Wardlaw J, Cannon J, Slattery J, Sellar RJ. Reproducibility of metabolite peak areas in 1H MRS of brain. Magn Reson Imaging. 1996;14(3):281–292. doi: 10.1016/0730-725x(95)02084-7. [DOI] [PubMed] [Google Scholar]
- 19.Brooks WM, Friedman SD, Stidley CA. Reproducibility of 1H-MRS in vivo. Magn Reson Med. 1999;41(1):193–197. doi: 10.1002/(sici)1522-2594(199901)41:1<193::aid-mrm27>3.0.co;2-p. [DOI] [PubMed] [Google Scholar]
- 20.Schirmer T, Auer DP. On the reliability of quantitative clinical magnetic resonance spectroscopy of the human brain. NMR Biomed. 2000;13(1):28–36. doi: 10.1002/(sici)1099-1492(200002)13:1<28::aid-nbm606>3.0.co;2-l. [DOI] [PubMed] [Google Scholar]
- 21.Li BS, Babb JS, Soher BJ, Maudsley AA, Gonen O. Reproducibility of 3D proton spectroscopy in the human brain. Magn Reson Med. 2002;47(3):439–446. doi: 10.1002/mrm.10081. [DOI] [PubMed] [Google Scholar]
- 22.Jackson EF, Doyle TJ, Wolinsky JS, Narayana PA. Short TE hydrogen-1 spectroscopic MR imaging of normal human brain: reproducibility studies. J Magn Reson Imaging. 1994;4(4):545–551. doi: 10.1002/jmri.1880040406. [DOI] [PubMed] [Google Scholar]
- 23.Tedeschi G, Bertolino A, Campbell G, Barnett AS, Duyn JH, Jacob PK, Moonen CT, Alger JR, Di Chiro G. Reproducibility of proton MR spectroscopic imaging findings. AJNR Am J Neuroradiol. 1996;17(10):1871–1879. [PMC free article] [PubMed] [Google Scholar]
- 24.Tedeschi G, Bertolino A, Righini A, Campbell G, Raman R, Duyn JH, Moonen CT, Alger JR, Di Chiro G. Brain regional distribution pattern of metabolite signal intensities in young adults by proton magnetic resonance spectroscopic imaging. Neurology. 1995;45(7):1384–1391. doi: 10.1212/wnl.45.7.1384. [DOI] [PubMed] [Google Scholar]


