

Abstract
The regulation of antibody reporting intensities is critical to various in situ fluorescence imaging analyses. While such control is often necessary to visualize sparse molecular targets, the ability to tune marker intensities is also essential for highly multiplexed imaging strategies where marker reporting levels must be tuned to both optimize dynamic detection ranges and minimize crosstalk between different signals. Existing chemical amplification approaches generally lack such control. Here, we demonstrate that linear and branched DNA complexes can be designed to function as interchangeable building blocks that can be assembled into organized, fluorescence reporting complexes. We show that the ability to program DNA strand displacement reactions between these complexes offer new opportunities to deterministically tune the number of dyes that are coupled to individual antibodies in order to both increase and controllably balance marker levels within fixed cells.
Keywords: antibodies, immunofluorescence, DNA strand displacement, dynamic DNA, multiplexed detection
Introduction
The chemical amplification of molecular recognition events is critical to numerous in situ analyses of proteins, RNA and other biomolecular species within cells and tissues. Such capabilities are often necessary to extend the dynamic range of an imaging technique so that dilute molecular targets can be visualized within a specimen. Several enzymatic signal amplification strategies have been established that allow large numbers of active dye molecules to be localized to their primary target including tyramide signal amplification (TSA)[1,2] and polymerase chain reaction-based methods such as rolling circle amplification (RCA)[3]. Non-enzymatic amplification procedures based on the triggered polymerization of nucleic acid hairpin devices have also been developed explicitly for the in situ detection of mRNA targets[4,5]. Each of these methods offer high signal amplification gains and can be used to detect low level molecular species. However, they generally offer limited control over final amplification levels since they rely on chemical reactions that need to be timed and/or quenched in order to arrest the signal amplification process. Moreover, the rates of these chemical reactions likely depend on the local concentrations and chemical environment surrounding their primary targets, which can, in turn, lead to sample- and local context-dependent modulation of signal amplification rates and levels in different settings.
In addition to increased detection sensitivities, a variety of molecular analyses stand to benefit from the development of convergent amplification strategies that can produce defined and uniform amplification gains that can be tuned predictively to regulate the marker reporting levels. Such capabilities are important for comparative analyses of marker levels within and across different biological samples since potential variability in protein staining can compromise abilities to assess functionally significant changes in marker levels. Furthermore, marker intensities must often be regulated for multiplexed molecular imaging strategies where multiple types of fluorescent reporting molecules are used to detect different molecular targets within a sample. The emission spectra of most fluorophores are relatively broad and exhibit a significant degree of spectral overlap. Since these properties can lead to appreciable bleed-through of target signals between a microscope’s spectral channels, the levels of multiple markers in multi-colour imaging assays must be balanced appropriately so that intense staining of one particular marker does not compromise abilities to distinguish the concentrations and localization patterns of other labelled markers. Such control is especially important for multiplexed hyperspectral imaging methods that employ high-resolution spectral detection systems and spectral deconvolution algorithms to separate signals originating from fluorophores that exhibit a large degree of spectral overlap[6,7]. These approaches require an even tighter balance of marker levels to both maximize the available dynamic range of a hyperspectral imaging system for each marker[8], and to ensure the detection of dilute species is not influenced by noise generated by spatially and spectrally overlapping signals stemming from more abundant species within a sample[8]. These issues are typically addressed by diluting the recognition reagents of the more intense targets within a sample to achieve more equitable intensity distributions among each overlapping target[7]. Although it would clearly be beneficial to balance maker intensities by amplifying the less intense signals, the lack of control over amplification levels provided by existing technologies generally limits their use in these applications.
Herein, we explore whether a new class of dynamic DNA complexes can be harnessed to controllably regulate signal intensities within fixed cell samples. As opposed to typical hybridization probe technologies that that have been employed for mRNA detection and require the use of chemical denaturants to assist in target recognition[4,9–11], these complexes are unique in that they react via a process called DNA strand displacement – the isothermal exchange of strands between different thermodynamically stable DNA complexes[12–19]. Insights into this mechanism has opened various new avenues to engineered DNA complexes that can operate as programmable amplifiers, logic gates, and molecular machines in solution[20–22]. Recently, our group demonstrated that relatively simple dynamic DNA complexes can be designed to function as reconfigurable/erasable molecular imaging probes that can be used to image different sets of protein markers within the same cells through multiple sequential rounds of fluorescence microscopy[19]. Importantly, these functions are facilitated by the high selectivity of the strand displacement process and the ability to perform strand displacement reactions at ambient temperature and with mild reaction buffers, conditions that are necessary to minimize perturbations in cell ultrastructure and marker integrity. In this report, we show that an analogous series of dynamic linear and branched DNA complexes can be designed to function as modular building blocks that can be used to program the assembly of organized immunofluorescent reporting complexes that possess discrete numbers of dyes. The resultant control over antibody intensities therefore provides new abilities to both enhance marker signals within a sample and balance them appropriately for multiplex detection approaches.
Results and Discussion
Proportional regulation of protein reporting intensities
The present dynamic DNA complexes were designed so that they can be used interchangeably to both generate structurally-organized, dendritic reporting complexes that possess different number of branches and to control the number of dye molecules coupled to each branch. The self-assembly of these complexes into immunofluorescent reporting complexes via strand-displacement is illustrated in Figure 1. DNA sequences and descriptions of domain structures for each complex are provided in the Supporting Information (Figure S1 and Table S1). Reporting complexes are generated using three different modular components: a ssDNA-conjugated antibody (DNA-Ab) to facilitate protein recognition, multi-stranded and branched DNA complexes that add additional DNA appendages to the antibody-conjugate, and a linear, labelling DNA complexes that outfit each terminal branch of a complex with fluorescent dye molecules. The branched and linear complexes are both designed to react with one another via strand displacement processes that are analogous to those described previously[14,19]. The reactive domains within each complex are specified so that they can be used interchangeably to generate different sized DNA reporting complexes and to control the total number of dyes that are coupled to their protein target. For example, signal intensities can be varied in a single stage reaction between a DNA-Ab conjugate and a linear probe that carries different numbers of dyes. Alternatively, the number of labelling sites per antibody can be increased via sequential displacement reactions that produce a single or multi-generation dendrimers whose terminal branches can be outfitted with dyes.
Figure 1.

Self-assembly of organized immunofluorescent reporting complexes using modular dynamic DNA complexes. Target proteins are outfitted with a ssDNA tag using a primary antibody (Ab) and a DNA-conjugated secondary antibody. Strand displacement reactions are then performed to either (i) label the ssDNA tag directly with a linear, DNA probe complex that, in the present study, carries between 1 and 3 dye molecules, or to (ii and iii) build branched DNA complexes to increase the number of target sites for the linear probe’s displacement reactions. For simplicity, all reactions are shown using a linear probe possessing a single dye molecule and a quencher.
We first tested whether structurally-organized fluorescent reporting complexes can be assembled in situ robustly enough to allow individually antibody intensities to be set to a fixed level based on the maximum number of dyes that can be integrated into a complex. To do so, we chose to label an exogenously-expressed, GFP-leucine zipper construct (GFP-ZE) within HeLa cells that were fixed and permeablized. The GFP-ZE proteins were coupled to a ssDNA oligonucleotide using an artificial protein polymer (ZR-ELS6-ssDNA) that associates tightly with this ZE tag through the formation of a heterodimeric leucine zipper complex (KD = 10−15 M)[23,24]. Importantly, these polymers can be used to label expressed proteins uniformly with a single ssDNA while producing minimal background labelling [15]. These features therefore allow the GFP proteins to serve as internal fluorescent standards for comparisons of reporting complex intensities across experiments where the expected number of branches and dyes within a complex are tuned.
Representative fluorescence images of GFP-expressing cells that were labelled with different numbers of dye molecules are shown in Figure 2A. In each of these experiments, dyes were coupled to the reporting complex using a linear probes that carry a single Cy3 molecule according to reactions depicted in Figure 1. The number of dyes per GFP target was modulated by either labelling their ssDNA-tags directly or by coupling a single or multiple branched DNA complexes to their ZR-ELS6-ssDNA polymers in sequential displacement reactions and then labelling the terminal sites of the reporting complex using a linear probe. The expected number of reactions required to build a structure and the number branches and dyes per GFP protein are indicated in each panel using the notation: P(# displacement reactions, # branches, # dyes). For example, the largest reporting complex in Figure 1 (iii), which is formed through 3 displacement reactions, has 9 branches and a single dye on each branch, is designated as P(3,9,9).
Figure 2.
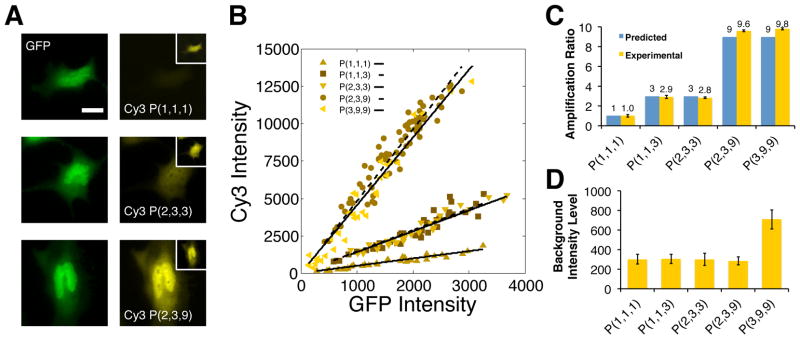
Regulating protein reporting intensities via the assembly of linear and branched DNA complexes: (A) Representative images of GFP expressing cells that are labeled through sequential displacement reactions that produce organized reporting complexes containing between 1 and 9 dyes. The number of reactions employed, labeling site/branches and dyes in a complex are indicated using the notation: P(i,j,k). All images were collected using the same exposure conditions and are contrasted identically. The inset shows maximum contrast for each image. Scale bar indicates 20 μm. (B) Correlations between average DNA-probe and GFP intensities. Each plot shows the average intensities of the cytoplasmic regions of 30 cells. The lines through the data indicate least square fits to the data (R2 ranges from 0.88–0.94). (C) Comparisons of theoretical and measured amplification ratios for the reporting complexes analyzed in B. Theoretical amplification ratios indicate the maximum number dyes that can be integrated into a complex. Experimental ratios are determined by dividing the slopes from the fits in B by the slope obtained using a linear complex containing a single dye: the P(1,1,1) complex. (D) Plots of mean background labeling intensities subtracted by dark noise and determined from intensity analyses within the cytoplasmic regions of approximately 30 non-GFP-expressing cells. Error bars indicate standard deviation of the means in C and D.
The images in Figure 2A show HeLa cells that possessed comparable GFP expression levels and are contrasted identically. The resultant Cy3 intensities of in these cells clearly increase as the expected number of dyes in a complex increases. Moreover, nuclear (Figure S2) and cytoplasmic (Figure 2) staining patterns match those of the GFP image closely in each case, indicating that the linear and branched probes can both be dispersed and react uniformly throughout the cell volume. Average DNA-probe signals within the cytoplasm of cells were also found to correlate linearly with their GFP expression level for a range of complex structures that are assembled using different combinations of probes and reaction sequences as shown in Figure 2B. When normalized against reactions that couple a single dye per GFP target (i.e., reactions yielding P(1,1,1) reporters), the slopes of these trends obtained from linear regression fits were found to increase proportionally according to the maximum possible number of the dyes that can be integrated into a complex (Figure 2C). Importantly, this response, which we define as a reporting complex’s amplification ratio, was very similar for reporting complexes containing the same number of dyes regardless of whether they were formed through a single, or multiple sequential displacement reactions (e.g., for the P(3,9,9) and P(2,3,9) complexes). Moreover, background Cy3 intensities within untransfected cells were hardly distinguishable over the root-mean-square intensities of cellular autofluorescence and were largely independent of the reaction scheme employed (Figure 2D).
The close agreement between the predicted and measured amplification ratios in Figure 2C suggest that stand displacement can be used to assemble fluorescence reporting complexes containing predefined numbers of dye molecules in high synthetic yield within fixed cells. Furthermore, analyses of background intensities suggest this mechanism can be employed to enhance protein target signal intensities without significant compromises to the single-to-background ratios. Given these responses, one may expect that amplification ratios exceeding 9 could also be achieved, for example, by assembling a branched complex in two linear DNA complex possessing multiple molecules on an accessory domain. Multiple copies of dyes were introduced into the present labelling probes by appending an additional domain that increases their total length by 18 bp (Figure S1). Although this approach was chosen to avoid interference within a complex’s reactive domain, we found that these probes tended to produce Cy3 intensities that were very similar to those found for the P(3,9,9) case, indicating only 1.5 branches of this complex is labelled on average (Figure S3). We believe this result indicates that there may be an upper limit to the size of a branched reporting complex that can be formed in situ, at least given the fixation conditions employed in the present experiments due to the steric restrictions inside fixed cells. Assuming the branched complexes adopt a tetrahedral geometry, a P(3,9,9) reporting complex is expected to have a effective radius of approximately stages to generate a reporter with 9 terminal branches, similarly to the P(3,9,9) complex, and then labelling each branch using a 63 nm (Supporting Information; Figure S3). Consequently, the displacement reactions used to couple multiple dyes per branch will increase a complex’s total size by approximately 6 nm. Considering these probes are shown to be capable of labelling smaller P(2,3,9) branched reporting complexes much more effectively, these results suggest the crowded environment of cells introduces steric constraints that may limit the total size of a complex that can be assembled completely in situ. Nevertheless, regardless of the source of this constraint, we still expect that higher amplification ratios approaching at least 20 can still be attained by incorporating additional dyes in to the branched complexes as well as within other positions of linear probes in a way that does not increase their total size or interrupt the strand displacement processes.
Regulated immunofluorescent protein intensities
We next examined whether similar control over fluorescence reporting intensities can be achieved using DNA-conjugated antibodies to detect endogenously expressed proteins (Figure 3). In these experiments, a primary antibody and a DNA-conjugated secondary antibody were used to couple ssDNA tags to stathmin, a microtubule regulatory protein. DNA strand displacement reactions were then performed to assemble reporting complexes possessing between 1 and 9 dyes. Epifluorescent control images shown are shown in Figure S4. Complexes containing 3 and 9 dye molecules were generated using linear labelling probes possessing 1 or 3 dye molecules by reacting with single branched DNA complex that had already been reacted to the DNA-Ab conjugates. As was found for the GFP targets, stathmin intensities in the resultant images clearly reflect the number of dye molecules integrated into the complexes (Figure 3A). Moreover, each labelling approach is found to reproduce the cytoplasmic distributions and punctate staining patterns that were observed in prior studies that employed the same primary antibody and both similar linear DNA probe complexes as well as standard dye-conjugated secondary antibodies[19].
Figure 3.

Discretely increasing amplification ratio on anti-stathmin antibody target. (A) Images of Cy3-labelled probes systems (P(1,1,1), P(2,3,3), P(2,1,9) with amplification ratios of 1×,3×,9× respectively). Equally contrasted images in the top row are taken at same imaging conditions and show similar discrete increases in amplification ratio as per Figure 2. The same images are contrasted individually in the bottom row and indicate extent of labeling for each probe system. Scale bar indicates 20 μm. (B) Comparison of experimental observed amplification ratios on modular probes targeting antibodies. Cytoplasmic regions of approximately 10 cells were taken at the same conditions for each probe system. Error bars indicate standard deviation of fluorescent signal. Fluorescent intensities were background subtracted with the mean fluorescent response from approximately 30 regions with no cells. (C) Singnal to Background ratios of modular DNA probe systems targeting antibodies. Error bars indicate standard deviation of true signal to standard deviation of background. (D) Background labeling of modular DNA probe systems targeting antibodies. GSU corresponds to grey scale units measured using a 14 bit camera. Error bars indicate standard deviations of background fluorescent labeling.
Analogously to the GFP-labelling analyses, immunofluorescence amplification ratios were determined by normalizing the average signal levels within cells for each reporting complex to those produced by labelling the secondary DNA-Ab conjugate via a displacement reaction with a linear duplex possessing a single dye molecule (Figure 3B). Again, the amplification ratio for each reporting complex scaled proportionally according to the maximum number of dyes that can be integrated into a complex. Signal to Background ratio increased with increasing amplification ratio (Figure 3C). Background levels were similar to those produced in the GFP labelling experiments and were not found to increase appreciably with increasing numbers of dyes (Figure 3D). As is indicated visually by increasing intensities in the fluorescence images, these trends persist despite the combination of punctuate and diffuse staining patterns found in cells, indicating that the amplification gains are nearly equivalent for both of these features. Moreover, the amplification gains come with improved signal-to-background ratios. These results therefore show that strand displacement mechanism can be harnessed to assemble different forms of organized immunofluorescent reporting complexes within fixed cells in high yield, thus, allowing antibody intensity levels to be controllably and discretely modulated by design.
Balancing immunofluorescence intensities for spectral deconvolution analyses
We next evaluated whether the ability to regulate immunofluorescent intensities of proteins can be used to balance marker levels within a cell sample for hyperspectral imaging analyses. For these experiments, we chose to image stathmin and microtubules since they overlap spatially within cells, but exhibit characteristically different localization patterns. The intensities of the stathmin proteins were regulated using the Cy3-bearing, dynamic DNA-complexes described above. The microtubules were imaged using a primary antibody raised against tubulin and secondary antibodies that were conjugated directly with Alexa514 fluorophores. The combined emission spectra of the Alexa514 and Cy3 dyes were measured using 32 spectral channels that were separated by 2.5 nm over a range of 532–610 nm. The intensities of microtubules, which stain much brighter than stathmin, were adjusted based on epi-fluorescence analyses to produce a ~9/1 microtubule/stathmin labelling ratio for the case where a single Cy3 dye is coupled to stathmin (via a P(1,1,1) reporting complex). The combined and deconvolved spectral responses of pixels within labelled cells were then compared for cases where the stathmin was labelled with 1 or 9 dye molecules.
Representative confocal images of stathmin proteins and microtubules are shown in Figure 4 where their signals are displayed as spectrally mixed (raw data) and unmixed (spectrally deconvolved). When the DNA reporting complexes integrated a single dye, stathmin proteins were barely detectable within mixed images since they are overwhelmed by the Alexa514-labeled microtubules (Figure 4A; top panel), a problem we found persists for various laser excitation intensities and detector gains. This imbalance in signal levels is also reflected in the combined and unmixed spectra for each dye type. The composite spectral fit produced by the linear deconvolution algorithm displays reasonable agreement with the raw spectral data (Figure 4B and 4C). Yet, despite this agreement, microtubule filaments and filament structures such as microtubule organization centers can be clearly detected in the unmixed ‘Cy3/stathmin’ images where the signals are presumably only derived from the Cy3 dyes. This response can be attributed to the dominance of the microtubule signals in the sample. With this condition, small errors in the spectral fitting procedures can still result in an appreciable misallocation of Alexa514/microtubule intensities into the stathmin image since these contributions constitute a significant proportion of the total spectral signal generated by stathmin. In contrast, unmixed images, as well as pixel spectra, for the case where the stathmin proteins were labelled with 9 Cy3 dyes clearly display much more balanced microtubule and stathmin signal levels (Figure 4A; bottom panel, and Figure 4C). In this case, microtubule features are not found in the unmixed stathmin images, which, instead, exhibit nearly indistinguishable localization patterns to those of control experiments where only the stathmin proteins are labelled (Supporting Information; Figure S4).
Figure 4.

Balancing marker levels within a sample to improve the unmixing of signals in hyperspectral image analyses. (A) Images of microtubules and stathmin proteins where their signals were unbalanced (top) and unbalanced (bottom) by assembling organized DNA reporting complexes possessing 1 and 9 Cy3 dye molecules respectively. Microtubules signals were labeled with Alexa514 conjugated antibodies as describe in the text. Spectrally mixed, unmixed and merged, and unmixed and separated images are provided for each experiment. Scalle bars are 20 μm. (B and C) Spectral responses of pixels within cells for cases where the stathmin and microtubule signals were unbalanced (B) and balanced (C).
Conclusion
We have demonstrated that dynamic DNA complexes can function as interchangeable building blocks that can be assembled into organized fluorescent reporting complexes that are selectively tethered to proteins and possess defined number of dye molecules. Such control provided new abilities to set antibody reporting intensities to predetermined levels within fixed cells. While this capability is generically useful for quantitative and comparative in situ analyses of protein levels and states within and among different cells and tissues, the ability to regulate protein reporting intensities has significant utility for multiplexed protein analyses that employ hyperspectral imaging and spectral deconvolution procedures. These methods typically employ relatively low bit-depth detectors, and, thus, intrinsically offer a limited dynamic range for protein detection. This limitation is only exacerbated when multiple dyes possessing a significant degree of spectral overlap are employed for marker detection. In these cases, the levels of each marker must be balanced evenly to maximize the dynamic range of detection available for each markers and to minimize the extent to which protein signals are misallocated by spectral deconvolution algorithms. Such conditions are typically configured by purely reducing the extent to which more abundant and intense markers are labeled. However, the present approach offers new opportunities to balance by increasing the signal intensities of low level markers, and, hence, can selectively relieve the constraints where the least intense markers in a sample determine the detection sensitivities for the remaining markers examined within a same sample.
Finally, the DNA strand displacement reactions used to assemble the present reporting complexes are similar to those employed in dynamic DNA complexes we have previously developed to function as reconfigurable/erasable molecular imaging probes[14,15,19]. Consequently, it should be possible to use these complexes to adaptively regulate protein intensities for multiple sequential analyses of different protein targets within a sample, or to preliminarily survey and then readjust marker reporting levels to achieve a more optimal balance of marker intensities, a capability that has particular utility for examining patient samples where staining levels cannot necessarily be predictively predetermined. In this way, these types of dynamic DNA systems offer new abilities to both increase the accuracy and reliability of in situ immunofluorescence imaging approaches, as well as the complexity of the molecular analyses that can be performed using these techniques.
Experimental Section
Materials
Oligonucleotides were purchased from Integrated DNA Technologies (IDT). Stathmin and microtubules were detected using polyclonal rabbit (ab20022, Abcam, Cambridge MA) and monoclonal mouse (clone DM1A, T6199, Sigma-Aldrich, St. Louis, MO) primary antibodies. Immunofluorescence signals were generated via secondary staining using goat anti-rabbit IgG (A10533 or A10520, Invitrogen) and AlexaFluor514-conjugated goat anti-mouse IgG (A31555, Invitrogen, Carlsbad, CA). The construction and preparation of the recombinant GFP-ZE proteins and ZR-ELS6-ssDNA polymers was conducted as previously described [23].
Dynamic DNA probe construction
DNA complex sequences were designed on a per-domain basis using previously described custom MATLAB script that generates and concatenates domains based on multiple criteria, including two-state hybridization energies, melting temperatures, strand concentrations, and salt concentrations as described previously [14,15]. Each complex was prepared by thermally annealing its strands in solution prior to its use in labelling experiments. The branched DNA complexes were annealed using a method described in reference 25. The four short strands (S) and four long (L) strands in these complexes were mixed in 1xTAE buffer with 12.5mM Mg2+ in a 5:4 (L:S) stoichiometric ratio; [L] = 20 μM. The strands were heated to 95°C for two min and then transferred to a 2 L water bath at 95°C. The water bath was then put in a polystyrene insulated container and cooled to 4°C over two days. Due to the size of the branched DNA complexes and the rigidity of such branched complexes [25–27], the complexes were purified using size exclusion chromatography as opposed to PAGE purification. After the annealing reaction, 100 μl samples were purified at 4°C by FPLC using a Superdex 200 10/300 GL column and a PBS flow rate of 250μl/min. The relevant fractions containing branched complexes were then concentrated by butanol extraction and ethanol precipitation, followed by drying on a centrifugal evaporator. The resultant structures were then examined by 7% non-denaturing PAGE analyses using SYBR-Gold staining (Invitrogen).
Antibody-DNA conjugation was performed via copper catalyzed Click chemistry [19,28]. Briefly, antibodies were diluted to 1 mg/mL in PBS. 20ug of the secondary antibody (unlabelled goat anti-rabbit) was combined with 2.5 μL 1 M NaHCO3 and 2.5 μL NHS-(PEO)4-Azide (10 mM in anhydrous DMSO, Thermo Scientific). The reaction was incubated at room temperature for 45 minutes. The azide-functionalized antibody was then purified by gel filtration using a Tris-buffered Bio-Spin 30 column (Bio-Rad Laboratories Inc, Hercules, CA). A hexynyl-modified DNA target strand was then coupled to the functionalized antibody using a Click-It Reaction Buffer Kit (Invitrogen). The resulting DNA-functionalized antibodies were purified once more using gel filtration to remove unconjugated DNA oligonucleotides.
Protein labelling
HeLa cells were cultured on glass coverslips in DMEM Glutamax media (Invitrogen) supplemented with 10% FBS. For GFP-based experiments cells were transiently transfected at 50% confluency with a vector containing the GFP-ZE construct using Fugene HD (Roche Applied Science, Mannheim, Germany) per the manufacture’s protocol. After 24 hours, the cells were washed twice with PBS at 37°C and then fixed with freshly prepared 4% paraformaldehyde in PBS at 37°C followed by two additional washes with PBS. The fixation reaction was then quenched after 30 minutes using 1mg/ml NaBH4 in PBS for 10min at room temperature. The cells where then washed twice in PBS and permeablized using 0.2% Trition X-100 in PBS. The cells were then washed again in PBS and stored overnight in PBS with 0.02% NaN3.
Prior to cell labelling, coverslips were rinsed in Milli-Q water, dried under an airstream, and attached to custom-fabricated micro-well chambers (10-round wells with 0.36cm2 culture and culture volume of 400μl). The samples were blocked using a solution containing 1% BSA, 5mg/ml Herring Sperm DNA and 0.5uM polyT DNA and 1% Dextran Sulfate in 1x PBS. 1x TAE with 12.5mM Mg2+ to prevent non-specific adhesion of the antibodies and DNA probes. These reagents were also present in the solutions during the strand displacement reactions. The linear labelled probes were reacted for 2 hrs and then washed three times in 1x TAE for 10 min. Cells were then reacted with the branched DNA complexes [200 μM] 4 hours at 30°C and then washed overnight at 4°C in 1xTAE with agitation.
Microscopy and image analyses
Epi-fluorescent images were collected using an inverted Nikon TiE microscope using either a 40× 0.95 NA objective or with a 60× 1.4 NA oil immersion objective and a 14-bit EMCCD camera (LucaR; Andor). Images were processed using a combination of Nikon (NIS-Elements) and ImageJ software. Epi-fluorescence images were background subtracted to account for camera dark noise and non-specific labelling, and bleed-through between fluorescent channels. Amplification rations were determined by measuring the cytoplasmic intensities of approximately 30 different cells for each probe complex and experiment.
32 channel, Hyperspectral images were collected using an inverted Nikon A1 laser scanning confocal microscope fitted with a 60x 1.4 NA oil immersion objective and a 12-bit spectral detector. The dyes were excited using a 514nm laser. 2048×2048 pixel images were collected using a pinhole size of 1.0 airy units. Reference spectra were collected by examining the emission responses of each antibody and DNA-antibody probe complex individually at the same laser intensities and detector gains employed for the spectral unmixing experiments. The mixed spectra were deconvolved using NIS-Elements software functions.
Supplementary Material
Acknowledgments
This work was funded in part by grants from the National Instutute of Health (1R21CA147912) and the Welch Foundation (C-1625).
Footnotes
Supporting information for this article is available on the WWW under http://www.chembiochem.org or from the author.
References
- 1.Hopman AH, Ramaekers FC, Speel EJM. J Histochem Cytochem. 1998;46:771–777. doi: 10.1177/002215549804600611. [DOI] [PubMed] [Google Scholar]
- 2.Ness JM, Akhtar RS, Latham CB, Roth KA. J Histochem Cytochem. 2003;51:981–987. doi: 10.1177/002215540305100801. [DOI] [PubMed] [Google Scholar]
- 3.Kingsmore SF, Patel DD. Curr Opin Biotechnol. 2003;14:74–81. doi: 10.1016/s0958-1669(02)00019-8. [DOI] [PubMed] [Google Scholar]
- 4.Choi HMT, Chang JY, Trinh LA, Padilla JE, Fraser SE, Pierce NA. Nat Biotechnol. 2010;28:1208–U103. doi: 10.1038/nbt.1692. [DOI] [PMC free article] [PubMed] [Google Scholar]
- 5.Dirks RM, Pierce NA. Proc Natl Acad Sci USA. 2004;101:15275–15278. doi: 10.1073/pnas.0407024101. [DOI] [PMC free article] [PubMed] [Google Scholar]
- 6.Parsa H, Upadhyay R, Sia SK. Proc Natl Acad Sci USA. 2011;108:5133–5138. doi: 10.1073/pnas.1007508108. [DOI] [PMC free article] [PubMed] [Google Scholar]
- 7.Schieker M, Pautke C, Haasters F, Schieker J, Docheva D, Böcker W, Guelkan H, Neth P, Jochum M, Mutschler W. J Anat. 2007;210:592–599. doi: 10.1111/j.1469-7580.2007.00716.x. [DOI] [PMC free article] [PubMed] [Google Scholar]
- 8.Gao L, Kester RT, Tkaczyk TS. Opt Express. 2009;17:12293–12308. doi: 10.1364/oe.17.012293. [DOI] [PMC free article] [PubMed] [Google Scholar]
- 9.Raj A, van den Bogaard P, Rifkin SA, van Oudenaarden A, Tyagi S. Nat Meth. 2008;5:877–879. doi: 10.1038/nmeth.1253. [DOI] [PMC free article] [PubMed] [Google Scholar]
- 10.Femino AM, Fay FS, Fogarty K, Singer RH. Science. 1998;280:585–590. doi: 10.1126/science.280.5363.585. [DOI] [PubMed] [Google Scholar]
- 11.Levsky JM, Singer RH. J Cell Sci. 2003;116:2833–2838. doi: 10.1242/jcs.00633. [DOI] [PubMed] [Google Scholar]
- 12.Zhang DY, Winfree E. J Am Chem Soc. 2009;131:17303–17314. doi: 10.1021/ja906987s. [DOI] [PubMed] [Google Scholar]
- 13.Zhang DY, Turberfield AJ, Yurke B, Winfree E. Science. 2007;318:1121. doi: 10.1126/science.1148532. [DOI] [PubMed] [Google Scholar]
- 14.Duose DY, Schweller RM, Zimak J, Rogers AR, Hittelman WN, Diehl MR. Nucleic Acids Res. 2011:1–10. doi: 10.1093/nar/gkr1209. [DOI] [PMC free article] [PubMed] [Google Scholar]
- 15.Duose DY, Schweller RM, Hittelman WN, Diehl MR. Bioconj Chem. 2010;21:2327–2331. doi: 10.1021/bc100348q. [DOI] [PMC free article] [PubMed] [Google Scholar]
- 16.Lubrich D, Green SJ, Turberfield AJ. J Am Chem Soc. 2009;131:2422–2423. doi: 10.1021/ja807765v. [DOI] [PubMed] [Google Scholar]
- 17.Yin P, Choi HMT, Calvert CR, Pierce NA. Nature. 2008;451:318–322. doi: 10.1038/nature06451. [DOI] [PubMed] [Google Scholar]
- 18.Genot AJ, Zhang DY, Bath J, Turberfield AJ. J Am Chem Soc. 2011;133:2177–2182. doi: 10.1021/ja1073239. [DOI] [PubMed] [Google Scholar]
- 19.Schweller RM, Zimak J, Duose DY, Hittelman WN. Angew Chem Int Ed. n.d doi: 10.1002/anie.201204304. [DOI] [PMC free article] [PubMed] [Google Scholar]
- 20.Shin JS, Pierce NA. J Am Chem Soc. 2004;126:10834–10835. doi: 10.1021/ja047543j. [DOI] [PubMed] [Google Scholar]
- 21.Zhang DY, Seelig G. Nat Chem. 2011;3:103–113. doi: 10.1038/nchem.957. [DOI] [PubMed] [Google Scholar]
- 22.Winfree E. J Biomol Struct Dyn. 2000:263–270. doi: 10.1080/07391102.2000.10506630. [DOI] [PubMed] [Google Scholar]
- 23.Schweller RM, Constantinou PE, Frankel NW, Narayan P, Diehl MR. Bioconj Chem. 2008;19:2304–2307. doi: 10.1021/bc8003606. [DOI] [PMC free article] [PubMed] [Google Scholar]
- 24.Moll JR, Ruvinov SB, Pastan I, Vinson C. Protein Sci. 2001;10:649–655. doi: 10.1110/ps.39401. [DOI] [PMC free article] [PubMed] [Google Scholar]
- 25.Wang X, Seeman NC. J Am Chem Soc. 2007;129:8169–8176. doi: 10.1021/ja0693441. [DOI] [PMC free article] [PubMed] [Google Scholar]
- 26.Seeman NC, Kallenbach NR. Annu Rev Biophys Biomol Struct. 1994;23:53–86. doi: 10.1146/annurev.bb.23.060194.000413. [DOI] [PubMed] [Google Scholar]
- 27.Carbone A, Seeman NC. Natural Computing. 2003;2:133–151. [Google Scholar]
- 28.Guo J, Wang S, Dai N, Teo YN, Kool ET. Proc Natl Acad Sci USA. 2011;108:3493–3498. doi: 10.1073/pnas.1017349108. [DOI] [PMC free article] [PubMed] [Google Scholar]
Associated Data
This section collects any data citations, data availability statements, or supplementary materials included in this article.